")
Back to Journals » Journal of Multidisciplinary Healthcare » Volume 14
A Deep Learning Model to Predict Knee Osteoarthritis Based on Nonimage Longitudinal Medical Record
Authors Ningrum DNA , Kung WM , Tzeng IS , Yuan SP, Wu CC , Huang CY, Muhtar MS, Nguyen PA, Li JYC , Wang YC
Received 16 June 2021
Accepted for publication 27 August 2021
Published 11 September 2021 Volume 2021:14 Pages 2477—2485
DOI https://doi.org/10.2147/JMDH.S325179
Checked for plagiarism Yes
Review by Single anonymous peer review
Peer reviewer comments 2
Editor who approved publication: Dr Scott Fraser
Dina Nur Anggraini Ningrum,1– 3 Woon-Man Kung,4 I-Shiang Tzeng,4– 6 Sheng-Po Yuan,1,7 Chieh-Chen Wu,4 Chu-Ya Huang,8 Muhammad Solihuddin Muhtar,2 Phung-Anh Nguyen,2,9 Jack Yu-Chuan Li,1,2,10,11 Yao-Chin Wang12,13
1Graduate Institute of Biomedical Informatics, College of Medical Science and Technology, Taipei Medical University, Taipei, Taiwan; 2International Center for Health Information Technology (ICHIT), Taipei Medical University, Taipei, Taiwan; 3Public Health Department, Faculty of Sport Science, Universitas Negeri Semarang, Semarang City, Indonesia; 4Department of Exercise and Health Promotion, College of Kinesiology and Health, Chinese Culture University, Taipei, Taiwan; 5Department of Research, Taipei Tzu Chi Hospital, Buddhist Tzu Chi Medical Foundation, New Taipei City, Taiwan; 6Department of Statistics, National Taipei University, Taipei, Taiwan; 7Department of Otorhinolaryngology, Shuang-Ho Hospital, Taipei Medical University, New Taipei City, Taiwan; 8Taiwan College of Healthcare Executives, Taipei, Taiwan; 9Department of Healthcare Information and Management, Ming Chuan University, Taoyuan, Taiwan; 10Department of Dermatology, Wan Fang Hospital, Taipei Medical University, Taipei, Taiwan; 11TMU Research Center of Cancer Translational Medicine, Taipei Medical University, Taipei, Taiwan; 12Graduate Institute of Injury Prevention and Control, College of Public Health, Taipei Medical University, Taipei, Taiwan; 13Department of Emergency Medicine, Min-Sheng General Hospital, Taoyuan, Taiwan
Correspondence: Jack Yu-Chuan Li Email [email protected]; [email protected]
Yao-Chin Wang Email [email protected]
Purpose: To develop deep learning model (Deep-KOA) that can predict the risk of knee osteoarthritis (KOA) within the next year by using the previous three years nonimage-based electronic medical record (EMR) data.
Patients and Methods: We randomly selected information of two million patients from the Taiwan National Health Insurance Research Database (NHIRD) from January 1, 1999 to December 31, 2013. During the study period, 132,594 patients were diagnosed with KOA, while 1,068,464 patients without KOA were chosen randomly as control. We constructed a feature matrix by using the three-year history of sequential diagnoses, drug prescriptions, age, and sex. Deep learning methods of convolutional neural network (CNN) and artificial neural network (ANN) were used together to develop a risk prediction model. We used the area under the receiver operating characteristic (AUROC), sensitivity, specificity, and precision to evaluate the performance of Deep-KOA. Then, we explored the important features using stepwise feature selection.
Results: This study included 132,594 KOA patients, 83,111 females (62.68%), 49,483 males (37.32%), mean age 64.2 years, and 1,068,464 non-KOA patients, 545,902 females (51.09%), 522,562 males (48.91%), mean age 51.00 years. The Deep-KOA achieved an overall AUROC, sensitivity, specificity, and precision of 0.97, 0.89, 0.93, and 0.80 respectively. The discriminative analysis of Deep-KOA showed important features from several diseases such as disorders of the eye and adnexa, acute respiratory infection, other metabolic and immunity disorders, and diseases of the musculoskeletal and connective tissue. Age and sex were not found as the most discriminative features, with AUROC of 0.9593 (− 0.76% loss) and 0.9644 (− 0.25% loss) respectively. Whereas medications including antacid, cough suppressant, and expectorants were identified as discriminative features.
Conclusion: Deep-KOA was developed to predict the risk of KOA within one year earlier, which may provide clues for clinical decision support systems to target patients with high risk of KOA to get precision prevention program.
Keywords: artificial intelligence, clinical decision support system, medical informatics application, precision medicine
Introduction
Knee osteoarthritis (KOA), is a degenerative disorder which is characterized by pathologic alterations in the osteochondral unit, composed of cartilage (hyaline and calcified), meniscus (fibrocartilage), and subchondral bone.1 It is responsible for around 85% of the burden of osteoarthritis.2 In the Taiwanese population, the prevalence of KOA among the elderly population is approximately 37% in individuals over 50 years old.3 Whereas in the US, KOA has been manifested in 12% of adults 65 years old, and in 13% of females and 10% of males 60 years old or older.4–6
Among etiologies, age is one of the prominent risk factors for KOA,7 which may be associated with cumulative exposure to many other risk factors leading to structural deteriorations in the joints. The other indicative pathological factors of KOA include female gender, obesity, and injury.8 Previous studies reported that activities involving frequent kneeling, heavy lifting, and high-impact sports are associated with KOA.9,10 In addition, genetic factors may also contribute the risk of KOA for about 40–80%, which is higher than hand and hip osteoarthritis. Even long-term use of administration of the drug oral N-acetylcysteine (NAC) is associated with a higher risk of KOA.11 However, predicting the risk of KOA is still a challenge, which might be achieved through employing artificial intelligence (AI).
In recent years, machine/deep learning and big medical data have been shown to possess immense potential to offer personalized healthcare by risk prediction to increase prevention efficacy and cost effectiveness.12–16 Machine/deep learning is an extension of classic statistical methodology that manages high-dimensional data such as images and large-scale electronic medical records (EMRs). The convolutional neural network (CNN), a type of deep learning method, can analyze general and highly variable tasks represented in imaging data. A very commonly employed deep learning architecture, ie CNN can conduct key computational tasks, like object recognition, image segmentation, and image classification.17 CNN is comprised of building blocks like filters, which can extract the relevant characteristics from the sequential input data via convolution operation. Furthermore, CNN could capture spatial characteristics of an image and accurately identify the object and its location with respect to other objects in the image. The other artificial neural network (ANN) deep learning method is composed on three layers including input, hidden, and output. ANNs are highly interconnected computer processors (neurons), which can perform parallel computations during data processing and knowledge representation.18 ANNs enable learning of modeling of complex nonlinear relationships between input and output.
Notably, most of the previous related studies have used only image-based, not the cohort of EMR, time series, or temporal approach data to predict the risk of KOA.19 Instead of using images to train deep learning for KOA risk prediction, deep learning has been used on chronic illnesses such as cardiovascular disease and cancer based on nonimage EMRs.12,13,15,20,21 In this study, we attempted to capture the EMR such as time points of clinical visits, diagnoses, and specific medications of all genders and ages. Eventually, based on our previously employed synergistic CNN and ANN deep learning approaches,22 with increasing accuracy, we established a KOA prediction model by using nonimage and multidimensional electronic medical records, ie deep learning model for KOA prediction (Deep-KOA). This model is useful for physicians to classify the patients who need costly KOA image and biomechanical screening. To our knowledge, our novel deep learning model (Deep-KOA) using EMR of three years would help in predicting the risk of KOA in the forthcoming year.
Patients and Methods
Dataset
We collected data from one of the largest administrative health care databases in the world, Taiwan’s National Health Insurance Research and Development (NHIRD), which stores all claims of diagnoses, medications, and procedures from around 99.9% of Taiwan inhabitants.23 The NHIRD contains claims data for insurance reimbursement, demographic characteristics, International Classification of Diseases, Ninth Revision, Clinical Modification (ICD-9-CM) for diagnoses and procedure codes, and medication prescriptions using the World Health Organization Anatomical Therapeutic Chemical (WHO-ATC) codes. We analyzed two million data samples from January 1, 1999 to December 31, 2013. This study was approved by the Taipei Medical University Institutional Review Board, in which the patient’s informed consent was not required because all information was anonymized and deidentified.
Study Population and Definitions
We identified the Taiwan population dataset, aged 25 years or more who had information of age, sex, and at least three years of records, had one or more admission claim during 1999–2013, and excluded patients with code of bed confinement status (ICD-9-CM code: V49.84) or accepted treatment for anterior cruciate ligament (ACL) (ICD-9-CM code: 844.2) or total knee replacement/total knee arthroplasty (TKA) (ICD-9-CM: V43.65) before the index date. For the KOA group, index date is the first date of diagnosed KOA. The KOA group was validated by ICD-9-CM codes, KOA localized (715.16, 715.26, or 715.36), or KOA unspecified (715.96). For the control group, index date is the last day available in database. We used patients’ EMR for the past three years to predict the risk of KOA incident one year later.
Prediction Model Construction
For each patient, we used the maximum age, gender, ICD-9-CM as diagnostic code, WHO-ATC code as medication code, and the total number of clinical visits found during the three-year observation window to create the feature. We also used 1098 ICD-9-CM codes consisting of 17 organ systems (001–999) and additional V-code (supplementary classification of factors influencing health status and contact with health services). In this study, the first three digits of the ICD-9-CM code were used. There were 1029 diagnostic categories found in the cohort data. For the WHO-ATC code, we used the first five characters (eg, A01AA) to cover most medications in the same category, there were 830 medication categories included and 695 medication categories were prescribed in the cohort data.
A model architecture that encompasses CNN and ANN is proposed. This architecture is made up of the first steps, which are data preprocessing. After that, the information is fed into the neural network. In order to make the optimal judgement, the distinct classification algorithms of CNN and ANN are merged (Figure 1). CNN is a type of deep learning approach that has grown popular in computer vision and health care, which is made up of many layers, such as convolution layers, pooling layers, and fully connected layers. It uses a backpropagation algorithm to learn spatial hierarchies of information automatically and adaptively.24 ANN is used as an extension of linear regression to capture complicated nonlinear connections between input variables and outcomes. Multiple hidden layers with combination of prespecified functionals are used to show the relationships between output and input variables. The objective is to minimize the error between outcome and expectations.25
 |
Figure 1 Electronic Medical Record (EMR) matrix and network architecture of Deep-KOA. The vertical axis of the input matrix consists of diagnostic and medication codes. The diagnostic features occupy 1029 blocks out of all 1098 International Classification of Diseases, Ninth Revision, Clinical Modification (ICD-9-CM) codes, and the medication features occupy 695 blocks out of all 830 World Health Organization-Anatomical Therapeutic Chemical (WHO-ATC) codes. The horizontal axis consists of 157 weeks (three years), and each cell is filled with visiting history of the patient. For each diagnosis code per week, the value is divided by seven (one week consist of seven days), and for each medication per week, the value is divided by 28 (assuming: one medication maximum prescribed as 4×7 days in a week). The EMR matrix data are fed to the convolutional neural network (CNN) architecture with leaky rectified linear unit (ReLU), and the static data (maximum age and sex of the patient) are fed to the artificial neural network (ANN) architecture. |
We considered the prediction of the KOA risk label as a binary classification problem and built a supervised CNN and ANN learning model to finish it. Each patients’ EMR input was changed to an image-like matrix. We also included the time dimension information.20 The vertical axis of input matrix consists of codes of diagnoses and medications. The horizontal axis consists of 157 weeks (three years), each cell consists of visiting history of the patient, each visit consists of a diagnosis code per week divided by seven (one week consists of seven days), and each visit consists of a medication code per week divided by 28 (assuming one medication maximum prescribed as 4×7 days in a week). The EMR matrix data input to network architecture using CNN consists of steps from convolution, average pooling, max pooling, leaky rectified linear unit (ReLU), and flatten. The maximum age and sex data of the patient input are fed to the ANN architecture, and finally combined to get the final score of classification. All patients’ data were split into 85% for training and 15% for testing, and later in the training set were split into 70% for training and 30% for internal validation.
Evaluation
We used the area under the receiver operating characteristic (AUROC), sensitivity, specificity, and precision to evaluate performance of the model. Optimal cutoff risk score threshold is the best threshold identified by both maximum sensitivity and specificity. Besides, losing AUROC with gradual selection is also carried out to investigate the importance and to determine the model factor using stepwise feature selection. The method mentioned above is implemented in the TensorFlow application program using Python programming language version 2.4.0 and 3.8.6 respectively.
Results
The mean ±standard deviation (SD) age in the KOA group was 64.20±12.49 years, with 83,111 females (62.68%) and 49,483 males (37.32%) (Table 1). For the nonKOA control group, the mean ±SD age was 51.00±15.79 years, with 545,902 females (51.09%) and 522,562 males (48.91%). The average numbers of annual clinical visits were 38.50 and 21.90 visits in KOA group and nonKOA control group per patient per year. The average numbers of annual diagnoses (ICD-9-CM code) were 34.60 and 21.90 diagnoses in KOA group and nonKOA control group, respectively per patient per year. The observed average numbers of annual medications (WHO-ATC code) were 62.11 and 30.54 medications per patient per year in the KOA and control groups, respectively. We found 694.81 and 298 medications per patient per year in the KOA group and control group, respectively if the numbers of medications were multiplied by prescription days per patient per year. Similarly, there were 1.90 and 0.82 medications per patient per day in the KOA group and control group, respectively.
 |
Table 1 Demographics of Sampled Dataset |
Based on the learning curve of the Deep-KOA model using diagnoses and medication features (Figure 2), the loss and accuracy curve of training and validation vs epoch, the validation and training loss curve shows that the Deep-KOA model has been found less prone to overfitting. Both the plot of training loss (green line) and validation loss (red line) diminished to a point of stability with a small gap between them. The training and validation dataset were representative, shown by the small gap between the plot of training loss and plot of validation loss along with the plot of training accuracy (blue line) and plot of validation accuracy (orange line) that increase to a point of stability and have small gaps between them.
 |
Figure 2 Learning curve of Deep-KOA model using diagnosis and medication features. Based on loss and accuracy curve of training and validation vs epoch (iteration), the validation and training loss curve shown that the Deep-KOA model has less overfitting, plot of training loss (green line) decreases to point of stability and plot of validation loss (red line) decreases to point of stability and has small gap with the training loss. The training and validation dataset were representative, it is shown by small gap between plot of training loss and plot of validation loss along with plot of training accuracy (blue line) and plot of validation accuracy (orange line) also increase to point of stability and has small gap between them. |
The Deep-KOA model with only diagnoses (ICD-9-CM code) input features reached an AUROC 0.94 at best threshold of 0.34 (Table 2). Whereas the Deep-KOA with only medication (WHO-ATC code) input features revealed an AUROC 0.79 at best threshold of 0.05. While applying both ICD-9-CM diagnostic and WHO-ATC medications as input features, the Deep-KOA showed an AUROC, sensitivity (recall), specificity, and precision (positive predictive value) of 0.97, 0.89, 0.93, and 0.80, respectively at best threshold of 0.15 (Figure 3A). The best balance we got between true positive rate and false positive rate, based on the final risk probability score was between zero (nonKOA) and one (KOA). We optimized the Deep-KOA model (Figure 3B) through the TensorFlow optimization toolkit by removing some connections between nodes inside layers. After optimization, the model size was significantly decreased by up to 33% (147 MB) when compared to its original size (442 MB). AUROC between original and optimized models was found to be nearly the same (AUROC=0.97).
 |
Table 2 Performance of Deep-KOA with Different Input Features |
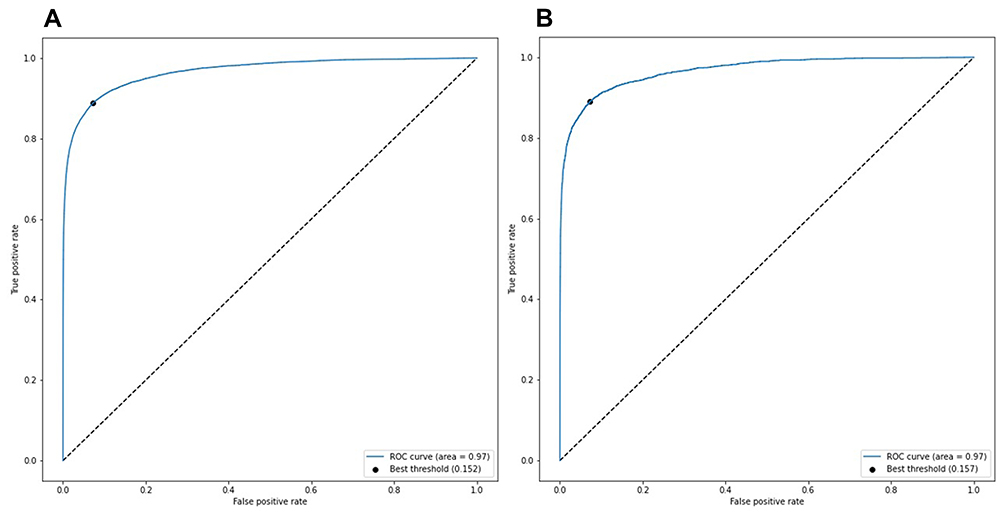 |
Figure 3 Area under the receiver operating characteristic curve (AUROC) of the Deep-KOA model using diagnosis and medication features, before the optimization (A) and after the optimization (B). The best threshold (dot) is 0.15, the best balance between true positive rate and false positive rate. Optimized model obtained from the TensorFlow optimization toolkit by removing some connections between nodes inside layers. After optimization, the model size decreased significantly by up to 33% from its original size (from 442 MB to 147 MB). In this case, AUROC between original and optimized model are almost the same (AUROC=0.97). |
The features presented in Table 3 were identified through eliminating each feature from diagnoses and medications at a group or individual level. The features were chosen based on the highest feature frequency in both the KOA and nonKOA control groups. As shown in Table 3, age and sex were not the most important features in the Deep-KOA prediction model, with AUROC of 0.9593 (−0.76% loss) and 0.9644 (−0.25% loss) respectively. High prevalence of diseases associated with eye and adnexa, acute respiratory infection, esophagus, stomach, duodenum, musculoskeletal, connective tissue, and chronic comorbidities (eg, other metabolic disorders, immunity, circulatory system, and hypertension-associated disorders) served as discriminative features for KOA prediction. Whereas medications such as antacid, cough suppressant, and expectorants were top-ranked discriminative features.
 |
Table 3 Important Features in Deep-KOA Model for Prediction of Knee Osteoarthritis (KOA) |
To compare the model performance, three patients from each of the KOA and nonKOA control groups were randomly chosen based on feature similarity, especially the number of features during three-years visiting (Table 4), which revealed the best threshold calculated at 0.152 in the Deep-KOA model, with the highest nonKOA score of 0.137 and the lowest KOA score of 0.172. These patients had the same number of features including diagnoses and medications in the nonKOA patients, showing a noticeable score difference.
 |
Table 4 Patient Data Sample for Deep-KOA Model Evaluationa |
Discussion
Despite the fact that the KOA field is relatively slow to adopt use of AI compared to other fields,19 there are currently many studies focused on developing KOA prediction models using AI-based on medical image (magnetic resonance imaging, MRI),26–29 clinical information,30 self-reported,31 and biomechanical data.29,31 EMRs are a common data source used increasingly for clinical risk prediction. However, studies did not fully leverage the breadth of EMR data, as they uncommonly used longitudinal information and employed relatively few predictor variables.14 Most previous studies focused on KOA progression prediction,19 and our study focused on KOA disease risk prediction. This Deep-KOA model can show strong discrimination without using image-based information (MRI or X-ray), biomechanical data, or self-reported questionnaire. This Deep-KOA model using nonimage, nonbiomechanical, and longitudinal medical record data achieved AUROC of 0.97, sensitivity of 0.89, and specificity of 0.93. The AUROC of previous studies using longitudinal images and biomarker data was 0.92.28 The Deep-KOA model only uses diagnostic data and medication data generally available in the EMR system. Optimized Deep-KOA decreased significantly by up to 33% from its original size (442 to 147 MB) while maintaining the high AUROC of 0.97. This optimized model can be deployed in a web-based or even on device mobile application.
Some of the discriminative factors identified in Deep-KOA could be consistent with the previous literature. In a previous study, age is one of the prominent risk factors for KOA.7 But in Deep-KOA, age is one of the discriminative factors, but not the prominent one. Similarly, female gender has higher risk.8 But in Deep-KOA, gender is one of the discriminative factors and female percentage was higher in the KOA dataset. Obesity as one of the metabolic disorders and metabolic syndrome is found to be one of the important discriminative factors that strengthens the findings of previous study.32 Long-term use of NAC is associated with a higher risk of KOA.11 In Deep-KOA, mucolytics (R05CB) and NAC (R05CB01) are found as significant factors. Other predictive parameters include high prevalence disease, comorbidities, chronic disease, and medications can also be potentially explored as new risk factors of KOA or as confounding factors in further research.
Based on Table 4, with the best threshold calculated at 0.152 in the Deep-KOA model, the highest nonKOA score is 0.137 and the lowest KOA score is 0.172. If the threshold is at 0.5, it would have one false negative, which is still good considering this patient has the same number of features (diagnosis and medication) as the nonKOA patient, and a noticeable score difference. This indicates that the model is able to determine the features’ pattern, which will decide if the corresponding patient is KOA or nonKOA. All of those KOA patients have much more medication prescription days compared to nonKOA, though they have the same number of features. Interestingly, the Deep-KOA with medication-only model has AUROC of 0.79 while the Deep-KOA with diagnosis-only model has AUROC of 0.94. But in these cases, the number of prescription days or long-term medications used has more impact on the final prediction score.
This study has several limitations. The NHIRD did not include MRI or other image results, laboratory results, body mass index, exposure (eg, occupation), genetic parameters, and information on the types, pathologic characteristics, and grading of KOA. Therefore, separate predictions of KOA could not be performed. However, by using nonimage variables, this model still holds the potential to be used in a generali worldwide population. Further investigation by adding image variables under the same concept will be necessary to enhance the performance and detail labelling output (stage of the KOA risk).
Conclusion
Deep-KOA was developed to predict the risk of KOA within one year earlier, achieved high sensitivity and specificity, and provided clues for clinical decision support systems to target patients with high risk of KOA to get a precision prevention program. Deep-KOA can assist physicians to classify patients who are at high risk of getting KOA in the future based on longitudinal medical records before screening using image or biomechanical retrieval.
Acknowledgments
The first author thanks the Directorate General of Resources for Science, Technology and Higher Education, at the Ministry of Education and Culture, Republic Indonesia for the sponsorship of her doctoral study. The authors are also grateful to Md. Mohaimenul Islam, PhD (International Center for Health Information Technology, Taipei Medical University) who provided advices and assisted on the process of drafting the manuscript. They were not compensated for their contributions. Jack Yu-Chuan Li and Yao-Chin Wang contributed equally as co-corresponding authors for this study.
Disclosure
The authors report no conflicts of interest in this work.
References
1. Goldring SR, Goldring MB. Changes in the osteochondral unit during osteoarthritis: structure, function and cartilage–bone crosstalk. Nat Publ Gr. 2016;12(11):632–644. doi:10.1038/nrrheum.2016.148
2. Vos T, Allen C, Arora M, et al. Global, regional, and national incidence, prevalence, and years lived with disability for 310 diseases and injuries, 1990–2015: a systematic analysis for the Global Burden of Disease Study 2015. Lancet. 2016;388:1545–1602. doi:10.1016/S0140-6736(16)31678-6
3. Lin FH, Chen HC, Lin C, et al. The increase in total knee replacement surgery in Taiwan A 15-year retrospective study. Medicine. 2018;97:31. doi:10.1097/MD.0000000000011749
4. Zhang Y, Jordan JM. Epidemiology of osteoarthritis. Clin Geriatr Med. 2010;26(3):355–369. doi:10.1016/j.cger.2010.03.001
5. Felson DT, Zhang Y. An Update on the Epidemiology of Knee and Hip Osteoarthritis with a View to Prevention. Vol. 41. American College of Rheumatology; 1998.
6. Kim H-A, Kim S, Seo YI, et al. The epidemiology of total knee replacement in South Korea: national registry data. Rheumatology. 2008;47(1):88–91. doi:10.1093/rheumatology/kem308
7. Zhang Y, Jordan JM. Epidemiology of osteoarthritis. Rheum Dis Clin North Am. 2008;34(3):515–529. doi:10.1016/j.rdc.2008.05.007
8. Silverwood V, Blagojevic-Bucknall M, Jinks C, Jordan JL, Protheroe J, Jordan KP. Current evidence on risk factors for knee osteoarthritis in older adults: a systematic review and meta-analysis. Osteoarthr Cartil. 2015;23(4):507–515. doi:10.1016/j.joca.2014.11.019
9. Driban JB, Hootman JM, Sitler MR, Harris KP, Cattano NM. Is participation in certain sports associated with knee osteoarthritis? A systematic review. J Athl Train. 2017;52(6):497–506. doi:10.4085/1062-6050-50.2.08
10. Ezzat AM, Li LC. Occupational physical loading tasks and knee osteoarthritis: a review of the evidence. Physiother Canada. 2014;66(1):91–107. doi:10.3138/ptc.2012-45BC
11. Yeh Y-T, Liang -C-C, Chang C-L, Hsu C-Y, Li P-C. Increased risk of knee osteoarthritis in patients using oral N-acetylcysteine: a nationwide cohort study. BMC Musculoskelet Disord. 2020;21(1):1–8. doi:10.1186/s12891-020-03562-1
12. Hippisley-Cox J, Coupland C. Development and validation of risk prediction algorithms to estimate future risk of common cancers in men and women: prospective cohort study. BMJ Open. 2015;5(3):e007825. doi:10.1136/BMJOPEN-2015-007825
13. Cheng Y, Wang F, Zhang P, Hu J. Risk prediction with electronic health records: a deep learning approach. In: Venkatasubramanian SC, Meira W, Eds. 16th SIAM International Conference on Data Mining 2016, SDM 2016. Society for Industrial and Applied Mathematics Publications; 2016:432–440. doi:10.1137/1.9781611974348.49
14. Goldstein BA, Navar AM, Pencina MJ, Ioannidis JPA, Goldstein B. Opportunities and challenges in developing risk prediction models with electronic health records data: a systematic review. J Am Med Inform Assoc. 2017;24(1):198–208. doi:10.1093/jamia/ocw042
15. Weng SF, Reps J, Kai J, Garibaldi JM, Qureshi N, Liu B. Can machine-learning improve cardiovascular risk prediction using routine clinical data? PLoS One. 2017;12(4):e0174944. doi:10.1371/JOURNAL.PONE.0174944
16. Hill NR, Sandler B, Mokgokong R, et al. Cost-effectiveness of targeted screening for the identification of patients with atrial fibrillation: evaluation of a machine learning risk prediction algorithm. J Med Econ. 2020;23(4):386–393. doi:10.1080/13696998.2019.1706543
17. Jiang Y, Li C. Review article convolutional neural networks for image-based high-throughput plant phenotyping: a review. Plant Phenomics. 2020;2020:1–22. doi:10.34133/2020/4152816
18. Ramesh AN, Kambhampati C, Monson J, Drew PJ. Artificial intelligence in medicine. Ann R Coll Surg Engl. 2004;86(5):334–338. doi:10.1308/147870804290
19. Kokkotis C, Moustakidis S, Papageorgiou E, Giakas G, Tsaopoulos DE. Machine learning in knee osteoarthritis: a review. Osteoarthr Cartil Open. 2020;2(3):100069. doi:10.1016/j.ocarto.2020.100069
20. Wang -H-H, Wang Y-H, Liang C-W, Li Y-C. Assessment of deep learning using nonimaging information and sequential medical records to develop a prediction model for nonmelanoma skin cancer. JAMA Dermatol. 2019;155(11):1277. doi:10.1001/jamadermatol.2019.2335
21. Wang Y-H, Nguyen P-A, Islam MM, Li Y-C, Yang H-C. Development of deep learning algorithm for detection of colorectal cancer in EHR data. Stud Health Technol Inform. 2019;264:438–441. doi:10.3233/SHTI190259
22. Nur Anggraini Ningrum D, S-p Y, Kung W-M, et al. Deep learning classifier with patient’s metadata of dermoscopic images in malignant melanoma detection. J Multidiscip Healthc. 2021;14:877. doi:10.2147/JMDH.S306284
23. Syed-Abdul S, Moldovan M, Nguyen P-A, et al. Profiling phenome-wide associations: a population-based observational study: table 1. J Am Med Inform Assoc. 2015;22(4):896–899. doi:10.1093/jamia/ocu019
24. Yamashita R, Nishio M, Do RKG, Togashi K. Convolutional neural networks: an overview and application in radiology. Insights Imaging. 2018;9(4):611–629. doi:10.1007/S13244-018-0639-9
25. Jiang F, Jiang Y, Zhi H, et al. Artificial intelligence in healthcare: past, present and future. Stroke Vasc Neurol. 2017;2(4):230. doi:10.1136/SVN-2017-000101
26. Donoghue C, Rao A, Bull AMJ, Rueckert D. Manifold learning for automatically predicting articular cartilage morphology in the knee with data from the osteoarthritis initiative (OAI). In:
27. Du Y, Shan J, Zhang M. Knee osteoarthritis prediction on MR images using cartilage damage index and machine learning methods. In:
28. Marques J, Genant HK, Lillholm M, Dam EB. Diagnosis of osteoarthritis and prognosis of tibial cartilage loss by quantification of tibia trabecular bone from MRI. Magn Reson Med. 2013;70(2):568–575. doi:10.1002/mrm.24477
29. Pedoia V, Haefeli J, Morioka K, et al. MRI and biomechanics multidimensional data analysis reveals R2-R1ρ as an early predictor of cartilage lesion progression in knee osteoarthritis. J Magn Reson Imaging. 2018;47(1):78–90. doi:10.1002/jmri.25750
30. Tiulpin A, Klein S, Bierma-Zeinstra SMA, et al. Multimodal machine learning-based knee osteoarthritis progression prediction from plain radiographs and clinical data. Sci Rep. 2019;9(1):1. doi:10.1038/s41598-019-56527-3
31. Lazzarini YZN, Runhaar ZXJ, Bay-Jensen ZKAC, et al. A machine learning approach for the identification of new biomarkers for knee osteoarthritis development in overweight and obese women. Osteoarthr Cartil. 2017;25:2014–2021. doi:10.1016/j.joca.2017.09.001
32. Wang H, Cheng Y, Shao D, et al. Metabolic syndrome increases the risk for knee osteoarthritis: a meta-analysis. Evid Based Complement Alternat Med. 2016;2016:7242478. doi:10.1155/2016/7242478
 © 2021 The Author(s). This work is published and licensed by Dove Medical Press Limited. The full terms of this license are available at https://www.dovepress.com/terms.php and incorporate the Creative Commons Attribution - Non Commercial (unported, v3.0) License.
By accessing the work you hereby accept the Terms. Non-commercial uses of the work are permitted without any further permission from Dove Medical Press Limited, provided the work is properly attributed. For permission for commercial use of this work, please see paragraphs 4.2 and 5 of our Terms.
© 2021 The Author(s). This work is published and licensed by Dove Medical Press Limited. The full terms of this license are available at https://www.dovepress.com/terms.php and incorporate the Creative Commons Attribution - Non Commercial (unported, v3.0) License.
By accessing the work you hereby accept the Terms. Non-commercial uses of the work are permitted without any further permission from Dove Medical Press Limited, provided the work is properly attributed. For permission for commercial use of this work, please see paragraphs 4.2 and 5 of our Terms.