")
Back to Journals » Pharmacogenomics and Personalized Medicine » Volume 14
A Two-Stage Study Identifies Two Novel Polymorphisms in PRKAG2 Affecting Metformin Response in Chinese Type 2 Diabetes Patients
Authors Xiao D, Liu JY, Zhang SM, Liu RR, Yin JY , Han XY, Li X, Zhang W, Chen XP, Zhou HH, Ji LN, Liu ZQ
Received 29 March 2021
Accepted for publication 25 May 2021
Published 23 June 2021 Volume 2021:14 Pages 745—755
DOI https://doi.org/10.2147/PGPM.S305020
Checked for plagiarism Yes
Review by Single anonymous peer review
Peer reviewer comments 3
Editor who approved publication: Dr Martin H Bluth
Di Xiao,1,2,* Jun-Yan Liu,3,* Si-Min Zhang,4,* Rang-Ru Liu,1,5 Ji-Ye Yin,1,6 Xue-Yao Han,4 Xi Li,1,6 Wei Zhang,1,6,7 Xiao-Ping Chen,1,6 Hong-Hao Zhou,1,6,7 Li-Nong Ji,4 Zhao-Qian Liu1,6,7
1Department of Clinical Pharmacology, Xiangya Hospital, Central South University, Changsha, People’s Republic of China; 2Department of pharmacy, Xiangya Hospital, Central South University, Changsha, People’s Republic of China; 3Department of orthopaedics, Xiangya Hospital, Central South University, Changsha, People’s Republic of China; 4Department of Endocrinology and Metabolism, The People’s Hospital of Peking University, Beijing, People’s Republic of China; 5Key Laboratory of Tropical Diseases and Translational Medicine of the Ministry of Education & Hainan Provincial Key Laboratory of Tropical Medicine, Hainan Medical College, Haikou, People’s Republic of China; 6Institute of Clinical Pharmacology, Hunan Key Laboratory of Pharmacogenetics, Central South University, Changsha, People’s Republic of China; 7National Clinical Research Center for Geriatric Disorders, Xiangya Hospital, Central South University, Changsha, People’s Republic of China
*These authors contributed equally to this work
Correspondence: Zhao-Qian Liu; Li-Nong Ji Email [email protected]; [email protected]
Objective: Individual differences in glycemic response to metformin in antidiabetic treatment exist widely. Although some associated genetic variations have been discovered, they still cannot accurately predict metformin response. In the current study, we set out to investigate novel genetic variants affecting metformin response in Chinese type 2 diabetes (T2D) patients.
Methods: A two-stage study enrolled 500 T2D patients who received metformin, glibenclamide or a combination of both were recruited from 2009 to 2012 in China. Change of HbA1c, adjusted by clinical covariates, was used to evaluate glycemic response to metformin. Selected single nucleotide polymorphisms (SNPs) were genotyped using the Infinium iSelect and/or Illumina GoldenGate genotyping platform. A linear regression model was used to evaluate the association between SNPs and response.
Results: A total of 3739 SNPs were screened in Stage 1, of which 50 were associated with drug response. Except for one genetic variant preferred to affect glibenclamide, the remaining SNPs were subsequently verified in Stage 2, and two SNPs were successfully validated. These were PRKAG2 rs2727528 (discovery group: β=− 0.212, P=0.046; validation group: β=− 0.269, P=0.028) and PRKAG2 rs1105842 (discovery group: β=0.205, P=0.048; validation group: β=0.273, P=0.025). C allele carriers of rs2727528 and C allele carriers of rs1105842 would have a larger difference of HbA1c level when using metformin.
Conclusion: Two variants rs2727528 and rs1105842 in PRKAG2, encoding γ 2 subunit of AMP-activated protein kinase (AMPK), were found to be associated with metformin response in Chinese T2D patients. These findings may provide some novel information for personalized pharmacotherapy of metformin in China.
Keywords: type 2 diabetes, metformin response, genetic variants, PRKAG2
Introduction
Type 2 diabetes (T2D) is a common chronic metabolic disease that is harmful to public health. The 2019 International Diabetes Federation (IDF) Diabetes Atlas reported 116.4 million diabetics aged 20 to 79 years in China, making it the country with the highest number of diabetes sufferers in the world.1 Among adults in China, the estimated overall prevalence of diabetes is 10.9%, including diagnosed and undiagnosed cases.2 Yet, according to the latest epidemiological studies, only 25.8% of definitely diagnosed patients were receiving antidiabetic therapy, and only about 40% of patients were under favorable glycemic control.3
Oral antidiabetic drugs (OADs) can be classified as follows: biguanide (metformin is the only biguanide in general use), second-generation sulfonylureas (SUs), meglitinides, thiazolidinediones (TZDs), α-glucosidase inhibitors, dipeptidyl peptidase-4 (DPP-4) inhibitors, and sodium-glucose cotransporter 2 (SGLT2) inhibitors.4 Among these, metformin is the most widely used agent owing to its high efficacy, neutral/mild weight loss, low cost, and rare side effect of hypoglycemia.4 The American Diabetes Association continued to advise in 2020 that metformin is the preferred initial pharmacologic agent for type 2 diabetes and should be used up to contraindication or intolerance.5 Individual differences in glycemic response to metformin in antidiabetic treatment exist widely. Less than half of the T2D patients treated with metformin could reach their HbA1c target (˂7%) and 30% experienced an adverse gastrointestinal reaction.6–8
Metformin is not metabolized in vivo and is excreted unchanged in urine. Pharmacogenomics of metformin previously focused mainly on genetic variants of its transporters. SNPs within organic cation transporter (OCT) 1–3 (encoded by SLC22A1, SLC22A2, SLC22A3, separately)9–12 and multidrug and toxin extrusion (MATE) 1/2-k (encoded by SLC47A1/ SLC47A2),13,14 plasma monoamine transporter (PMAT; encoded by SLC29A4),15 serotonin reuptake transporter (SERT; encoded by SLC6A4),8,16 as well as thiamine transporter (THTR-2; encoded by SLC19A3)17 were reported to take part in the drug disposal process of metformin. Thus, genetic variants of transporters mentioned above probably have an impact on metformin pharmacokinetics, accompanied or not by an influence on pharmacodynamics.
Over the past few decades, about 50 single nucleotide polymorphisms (SNPs) have been found likely to affect its glycemic response, including several genetic variants identified by genome-wide association study (GWAS). These were rs11212617 closed to ATM (a regulator of the target of metformin, AMPK),18 rs8192675 in SLC2A2 (the coding gene of a glucose transporter, GLUT2),19 rs254271 in PRPF31 (pre-mRNA processing factor 31) and rs2162145 in CPA6 (carboxypeptidase A6).20 Taking rs11212617 near ATM as an example, several investigators attempted to conduct replication and meta-analysis of this locus to confirm its influence, but the results were inconsistent.21–23 Moreover, these high throughput screening researches were all conducted in a multiethnic population, among which Asians made up a small proportion or were not included.
We used a candidate gene approach, involving thousands of SNPs, to explore the characteristic genetic variants that affect metformin’s glycemic response in Chinese T2D patients.
Methods
Study Participants
Data for this study were obtained from two trials. One is the “Glibenclamide” arm of the Xiaoke Pill Trial, described in detail by Ji et al24. The other is a group of newly diagnosed T2D patients that received metformin monotherapy.
A total of 365 patients were recruited for the “Glibenclamide” arm. Among these, 182 received a combination treatment of metformin plus glibenclamide. We called it the “combination treatment group”, or “discovery group”. For this group, glycometabolism measurements were assessed at baseline and then every 12 weeks until the trial’s termination. Glibenclamide doses were adjusted according to changes of FPG level every four weeks, and metformin doses remained unchanged throughout the trial. Another 183 patients were treatment naïve T2D cases who received glibenclamide monotherapy. We named this as the “glibenclamide monotherapy group”, or “exclusion group”. Dose adjustment was similar to the above (Trial no. ChiCTR-TRC-08000074).
As for the metformin group, 145 newly diagnosed and drug-naïve T2D patients received metformin monotherapy for 16 weeks. We called it the “metformin monotherapy group” or “validation group”. Glycometabolism measurements were evaluated at baseline and at the ending point (Trial no. NCT00778622).
Phenotype Definitions
Referring to Zhou et al18 we used the change of HbA1c level (on-treatment HbA1c level minus pre-treatment HbA1c level), adjusted by known clinical covariates, as the glycemic response phenotype. On-treatment HbA1c was defined as the minimum recorded HbA1c achieved within 36 weeks after the index date in the “combination treatment group” and “glibenclamide monotherapy group”. The covariates included age, sex, weight, serum creatinine (Scr), baseline HbA1c level, and drug doses. If the first four covariates were all available, the creatinine clearance rate (Ccr) would be recommended as a whole instead of being adjusted separately. The Ccr was calculated as the following equation: (140-age) × weight (in kg) × (0.85 if female)/(0.818 * Scr (in μmol/L). Drug dose was defined as the average daily dose during the three months prior to the minimum HbA1c being achieved.
Genotyping
Infinium iSelect HD Custom Genotyping BeadChips and Illumina GoldenGate genotyping platforms were used for patient genotyping. SNPs were primarily selected on the basis of pharmacokinetics and pharmacodynamics, as well as reported disease-related SNPs, such as diabetes, obesity, glucose, and lipid metabolism. The 20 top-ranked GO (Gene Ontology) biological process and KEGG (Kyoto Encyclopedia of Genes and Genomes) Pathway analysis of SNP lists are presented in Figure S1. For iSelect BeadChip, SNP selection was based primarily on the DMET (Drug Metabolizing Enzymes and Transporter; Affymetrix) chip, with some extension. As for GoldenGate BeadChip, SNPs were selected mainly direct to metformin. Genes likely to affect metformin pharmacokinetics and pharmacodynamics, confirmed or speculated, were enrolled. In total, 2986 SNPs were included in the iSelect BeadChip, while 768 SNPs were customed into the GoldenGate BeadChip. For comparability between the two chips, 15 SNPs were customed into both. Because the “combination treatment group” was at the discovery stage, genotyping by both chips was undertaken. Subsequently, the “glibenclamide monotherapy group” used the iSelect chip only because glibenclamide-related genes were involved in this chip, while the “metformin monotherapy group” utilized the GoldenGate Chip for the same reason.
Statistical Analysis
Before genetic association analysis, SNP quality control (QC) and sample QC were performed in three groups. For each SNP, simultaneously satisfying call rate ≥90% and MAF (minor allele frequency) ≥0.05 and Hardy–Weinberg equilibrium (HWE) test P values > 0.5 were filtered. For each sample, a genotyping call rate ≥90% was retained for subsequent analyses. Stepwise linear regression was utilized to select clinical covariates of potential effects. Linear regression model was performed to test associations between each SNP and drug efficacy. The Bonferroni correction was used for multiple testing corrections to adjust raw P values. All the above analyses were achieved by using plink 1.07 (http://pngu.mgh.harvard.edu/purcell/plink/) and SPSS 20.0 (SPSS Inc., Chicago, Illinois, USA).
Results
Results of SNP Selection and Genotyping
A total of 2986 SNPs and 768 SNPs were included in iSelect BeadChip and GoldenGate BeadChip, separately. The accordance ratio of the 15 reduplicative SNPs was over 98%. In the “combination treatment group”, 551 SNPs in iSelect chip and 645 SNPs in GoldenGate Chip passed SNP and sample filtering. In the “glibenclamide monotherapy group”, 545 SNPs in iSelect chip passed filtering, while in the “metformin monotherapy group”, 644 SNPs in GoldenGate chip passed filtering. The screening process is shown in Table S1.
Characteristics of Study Populations
Detailed demographics are shown in Table 1. After strictly excluding patients who did not meet the entry criteria but were recruited, there were 176 patients (90 males and 86 females) in the combination treatment group (discovery group), 181 patients (106 males and 75 females) in the glibenclamide monotherapy group (exclusion group) and 143 patients (84 males and 59 females) in the metformin monotherapy group (validation group). Baseline age, weight, BMI, and waist/hip ratio are listed in Table 1. A relatively higher proportion of overweight and obese individuals were observed in the validation group. The baseline FPG levels were, respectively, 9.36±1.71, 9.02±1.57, and 8.50±1.80 mmol/L in the discovery, exclusion, and validation groups in sequence. The baseline HbA1c levels in turn were 8.47±1.26, 8.34±1.22, and 8.32±0.82%. The on-treatment HbA1c refers to the minimum HbA1c level during visits, and the level was 6.78±0.99, 6.56±0.90, 6.53±0.54% in sequence. Correspondingly, medication daily dose was the average daily dose for three months prior to the minimum HbA1c being achieved. For the discovery group, the glibenclamide daily dose was 2.50 mg (2.08–5.00 mg) (IQR, 25th and 75th percentile, the same as below) and the metformin daily dose was 1000 mg (750–1500 mg). For the exclusion group, the glibenclamide daily dose was 3.75 mg (2.50–5.00 mg). For the validation group, the metformin daily dose was 1500 mg (1500–2000 mg).
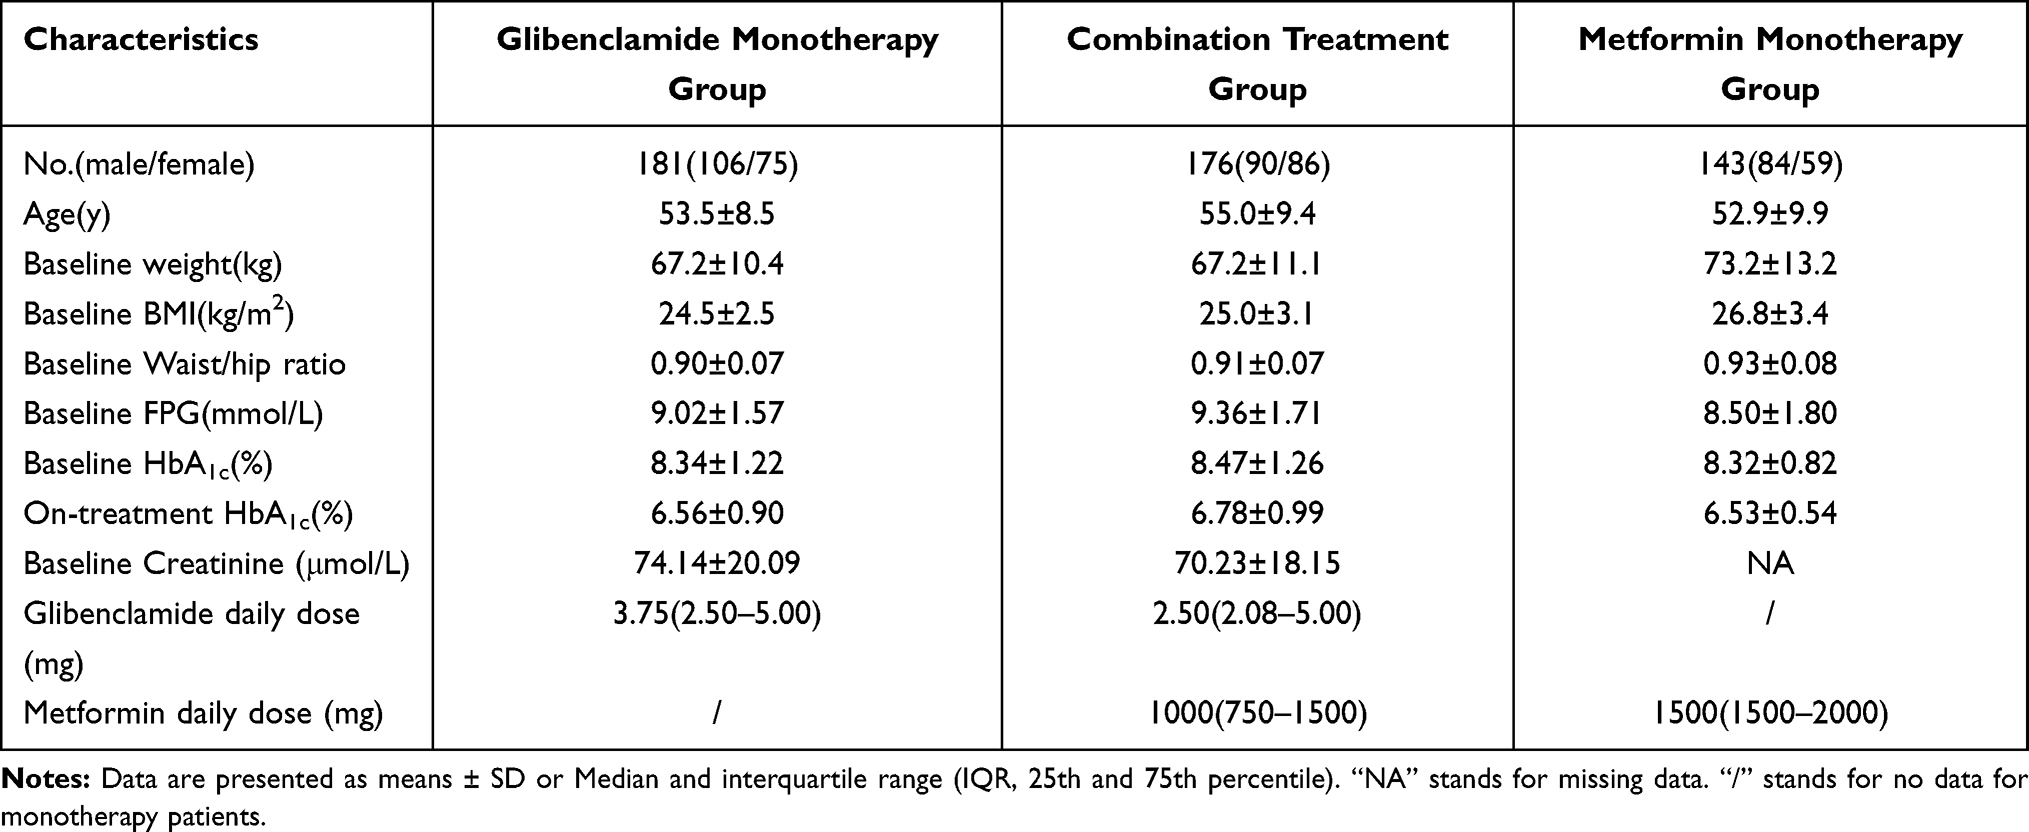 |
Table 1 Demographics of Study Populations |
Results of Genetic Association Analysis
The integrated workflow is shown in Figure 1.
 |
Figure 1 The design workflow of this clinical study. |
First, we established the association between genotypes and drug response in the discovery group. We merged genotyping data of two platforms and redid SNP and sample QC. 1245 SNPs passed filter, including 14 reduplicative loci between the two platforms, so that the number of enrolled SNPs was 1231. After adjustment for baseline HbA1c level, Ccr, and medication daily dose, 50 SNPs were found to be associated with the change of HbA1c value (P˂0.05, shown in Table 2). Among these probably positive loci, 60% were from the GoldenGate chip.
 |
Table 2 SNPs Associated with Phenotype in Discovery Group (Stage 1) |
Next, associations between genotype and phenotype in the exclusion group were analyzed. 19 of 545 SNPs were found related to glibenclamide response (P˂0.05, shown in Table 3), among which was rs1800545 in ADRA2A (adrenoceptor alpha 2A) with P value less than 0.05 in both groups above. Our preference is that this variant is the most likely to affect glibenclamide response.
 |
Table 3 SNPs Associated with Phenotype in Exclusion Group (Stage 1) |
Because most SNPs found in the discovery group were derived from the GoldenGate chip, only GoldenGate genotyping was performed on validation group patients using metformin monotherapy. In this group, 27 of 644 SNPs were found to be correlated with metformin glucose-lowering efficacy (P˂0.05, shown in Table 4). Compared with SNPs identified in the discovery group, two variants of the PRKAG2 (protein kinase AMP-activated non-catalytic subunit gamma 2) gene were validated (bold in Tables 2 and 4). One was PRKAG2 rs2727528 (discovery group: β=−0.212, P=0.046; validation group: β=−0.269, P=0.028). The other was PRKAG2 rs1105842 (discovery group: β=0.205, P=0.048; validation group: β=0.273, P=0.025). C allele carriers (W/M+M/M, W=wild type; M=mutation type) of rs2727528 and C allele carriers (W/W+W/M) of rs1105842 would have a larger difference of HbA1c level when using metformin (shown in Figure 2). Meanwhile, we were concerned that in the metformin monotherapy group, there were 5 SNPs located in the PRKAG2 gene found to be associated with metformin response. Except for the two SNPs mentioned above, the other three were rs1029946 (β=0.306, P=0.001), rs6964824 (β=−0.347, P=0.013), and rs2727551 (β=0.296, P=0.042). Linkage disequilibrium analysis showed that the linkage among the five SNPs was relatively low (shown in Figure 3). In addition, rs11212617 near C11orf65 or ATM, identified by the first metformin GWAS, was repeated in the metformin monotherapy group (β=−0.255, P=0.035), while C allele carriers benefited more in our research.
 |
Table 4 SNPs Associated with Phenotype in Validation Group (Stage 2) |
 |
Figure 2 Proportional reduction in HbA1c by PRKAG2 rs2727528 and rs1105842 genotypes as represented by violin plots. Proportional reduction in HbA1c was calculated as (on-treatment HbA1c level minus pre-treatment HbA1c level)/pre-treatment HbA1c level. (A) Proportional reduction in HbA1c among PRKAG2 rs2727528 different genotypes in discovery group; (B) Proportional reduction in HbA1c among PRKAG2 rs2727528 different genotypes in validation group; (C) Proportional reduction in HbA1c among PRKAG2 rs1105842 different genotypes in discovery group; (D) Proportional reduction in HbA1c among PRKAG2 rs1105842 different genotypes in validation group. |
 |
Figure 3 Linkage disequilibrium analysis of 5 SNPs (rs1029946, rs1105842, rs2727528, rs2727551, rs6964824) in PRKAG2 in validation group. (A) D’ of the 5 SNPs in PRKAG2; (B) r2 of the 5 SNPs in PRKAG2. |
Discussion
To our knowledge, the current study is the first to use high-throughput genotyping chips to identify candidate SNPs, which may affect metformin response in Chinese T2D patients through a two-stage study. Three groups totaling 500 patients met the final selection criteria and were analyzed. Previous studies on metformin pharmacogenomics were mostly carried out in patients receiving combination therapy, with at least one more antidiabetic drug being added to metformin. Even if subjects were metformin monotherapy patients, or considering monotherapy patients as a subgroup, the sample size was usually relatively small. This was understandable for at least two reasons. First, many T2D patients have progressed to such a degree that a single drug could not well control at the time of diagnosis. That is why we emphasize screening for diabetes. Second, as described in the introduction, a proportion of patients do not respond well to metformin or cannot tolerate its side effects. To cripple interference from the combined drugs, we individually recruited commensurate patients for treatment with the specified antidiabetic drug. We validated our results at the discovery stage in metformin monotherapy patients. All the above was to strengthen the credibility of verified SNPs in affecting metformin response in Chinese T2D patients.
In the discovery group, we screened out 50 SNPs nominally associated with the change of HbA1c value. Although the one with the lowest P value (10−3 level) did not pass the Bonferroni test (Bonferroni P value should be less than 4.06×10⁻⁵), potential impacts could be masked. Furthermore, due to the combination of metformin and glibenclamide, we did not know the contribution of each drug in glucose lowering. To minimize the influence, 19 SNPs were identified for association with glibenclamide response in the glibenclamide monotherapy group. It was not surprising that some of them were located in or near “known” genes to affect pharmacokinetics or pharmacodynamics of sulfonylureas, such as IRS1,25 CYP51A1,26 ADRA2A,27 and so on. Due to racial differences in allele frequency, some crucial variants of sulfonylureas like *2 variant (Arg144Cys, rs1799853), *3 variant (Ile359Leu, rs1057910) of CYP2C928 were rare mutations in Chinese patients, so that they either were not selected in the genotyping chip originally, or did not pass MAF filtering. By comparing the results of the two groups above, one repeated locus was regarded as associated with glibenclamide, but not metformin. Over 60% of the remaining 49 SNPs came from the GoldenGate chip, which was targeted at metformin’s intracorporal process and efficacy. Thus, we decided to verify the remaining SNPs using only the GoldenGate chip. A total of 27 SNPs with a raw P value less than 0.05 and PRKAG2 rs2727528 and rs1105842 were duplicated in both discovery and validation groups. Further analysis indicated that C allele carriers of rs2727528 and C allele carriers of rs1105842 would have a larger difference of HbA1c level when using metformin. This could mean that patients with prepotent genotype will obtain more benefit from metformin in glucose control. Meanwhile, we were concerned that in the metformin monotherapy group, five SNPs located in the PRKAG2 gene were nominally associated with metformin response, and were in poor linkage with each other. This suggests that PRKAG2 and its variants may contribute more to metformin efficacy than we recognize.
Metformin has been shown to act via both AMP-activated protein kinase (AMPK)-dependent and AMPK-independent mechanisms.29 AMPK is a heterotrimeric complex consisting of a catalytic subunit (α, encoded by PRKAA1 and PRKAA2) and two regulatory subunits (β, encoded by PRKAB1 and PRKAB2; γ, encoded by PRKAG1, PRKAG2, and PRKAG3).30,31 The γ-subunit harbors nucleotide-binding sites and plays an important role in AMPK regulation in response to cellular energy levels. In mammals, there are three isoforms of the γ-subunit, and these respond differently to regulation by nucleotides.32,33 A recent study has further reported that humans carrying the R302Q mutation in γ2 have increased adiposity and slightly raised fasting glucose levels compared with unaffected individuals, owing to chronic activation of γ2 AMPK when mutation exists.34 This suggests that mutation could change the state of activation. Genome-wide association studies show that PRKAG2 is significantly associated with diabetes incidence.35 In addition, methylation signatures of cg24061580 (PRKAG2) correlate with insulin resistance.36 Polymorphisms in encoding genes of other subunits, PRKAA1 (encode α1), PRKAA2 (encode α2), and PRKAB2 (encode β2), have been found to affect metformin glucose-lowering effect.37 However, PRKAG2 has been extensively studied mainly for its mutations, which could cause human cardiomyopathy characterized by hypertrophy, Wolff-Parkinson-White syndrome, conduction system disease, and glycogen storage in the myocardium.38 Recent studies have revealed the molecular pathogenesis of cardiac abnormality owing to PRKAG2 mutation. PRKAG2 mutant patients and model mice displayed anomalous atrioventricular conduction related to cardiac glycogen overload. Most likely, the increased AMPK activity caused by active mutation enhanced glycogen synthesis through robust glucose uptake.39,40 That is, glucose-6-phosphate and the abundant substrate functioned as allosteric activators of glycogen synthase, thus promoting the influx of glucose by AMPK activation to synthesize glycogen. However, because of insulin deficiency and glucagon-induced insulin resistance, diabetics cannot store glucose as liver glycogen, either directly (glycogen synthesis from dietary glucose after meals) or indirectly (glycogen synthesis from “de novo” synthesis of glucose).
Our study found that PRKAG2 rs2727528 and rs1105842 could affect the hypoglycemic effect of metformin in Chinese Han T2D patients. We speculate that the mutation in PRKAG2 might change the conformation or activity of γ2 AMPK, thus altering the rate of gluconeogenesis, glycogen cycling, and hepatic glucose output. Coincidentally, metformin acts primarily by decreasing hepatic glucose output, largely by inhibiting gluconeogenesis.41 The interaction between metformin and PRKAG2 mutation is fascinating. However, our hypothesis needs to be verified by cell and animal experiments.
There were certain limitations to our study. First, superabundant trivial loci were enrolled when designing the genotyping chip, especially those with very low allele frequency in Chinese people. Second, due to differences in visit times, only 16-week glycometabolism and lipometabolism measures were collected in the metformin monotherapy group. A different course of treatment compared with the discovery group may mask the effects of some meaningful gene variants.
Conclusion
Nevertheless, this is progressive research with a more rigorous grouping and a larger population to screen genetic variants that could affect metformin response in Chinese T2D patients. By correlating the change of HbA1c levels with thousands of related SNPs, we found that PRKAG2 rs2727528 and rs1105842 polymorphisms may affect metformin response in Chinese T2D patients. The mechanisms of their influence need further research.
Data Sharing Statement
The data used to support the findings of this study are available from the corresponding authors on reasonable request (Professor Zhao-Qian Liu, E-mail: [email protected] and Professor Li-Nong Ji, Email: [email protected]).
Ethics Approval and Informed Consent
The study was approved by the Ethics Committee of Xiangya School of Medicine, Central South University (Changsha, Hunan, China) (CTXY-110002-5), and was performed in accordance with the Helsinki Declaration. Written informed consent was provided by all subjects.
Acknowledgments
We thank all the participants in this clinical study. This work was supported by the National High-tech R&D Program of China (863 Program) (2009AA022704, 2012AA02A517), National Natural Science Foundation of China (81703620, 81874327), Hunan Provincial Natural Science Foundation of China Grant (2018JJ3845), and Hainan Province Key Research and Development Project (ZDYF2016128).
Disclosure
The authors declared no competing interests for this work.
References
1. Saeedi P, Petersohn I, Salpea P, et al. Global and regional diabetes prevalence estimates for 2019 and projections for 2030 and 2045: results from the International Diabetes Federation Diabetes Atlas, 9(th) edition. Diabetes Res Clin Pract. 2019;157:107843. doi:10.1016/j.diabres.2019.107843
2. Wang L, Gao P, Zhang M, et al. Prevalence and ethnic pattern of diabetes and prediabetes in China in 2013. JAMA. 2017;317:2515–2523. doi:10.1001/jama.2017.7596
3. Xu Y. Prevalence and control of diabetes in Chinese adults. JAMA. 2013;310:948–959. doi:10.1001/jama.2013.168118
4. Upadhyay J. Pharmacotherapy of type 2 diabetes: an update. Metabolism. 2018;78:13–42.
5. American Diabetes Association.9. Pharmacologic approaches to glycemic treatment: standards of medical care in diabetes-2020. Diabetes Care. 2020;43:S98–S110. doi:10.2337/dc20-S009
6. Esposito K, Chiodini P, Bellastella G, Maiorino MI, Giugliano D. Proportion of patients at HbA1c target <7% with eight classes of antidiabetic drugs in type 2 diabetes: systematic review of 218 randomized controlled trials with 78 945 patients. Diabetes Obes Metab. 2012;14:228–233.
7. McCreight LJ, Bailey CJ, Pearson ER. Metformin and the gastrointestinal tract. Diabetologia. 2016;59:426–435. doi:10.1007/s00125-015-3844-9
8. Dujic T, Zhou K, Tavendale R, Palmer CN, Pearson ER. Effect of Serotonin Transporter 5-HTTLPR polymorphism on gastrointestinal intolerance to metformin: a GoDARTS Study. Diabetes Care. 2016;39:1896–1901. doi:10.2337/dc16-0706
9. Shu Y, Brown C, Castro RA, et al. Effect of genetic variation in the organic cation transporter 1, OCT1, on metformin pharmacokinetics. Clin Pharmacol Ther. 2008;83:273–280. doi:10.1038/sj.clpt.6100275
10. Dujic T, Zhou K, Yee SW, et al. Variants in pharmacokinetic transporters and glycemic response to metformin: a metgen meta-analysis. Clin Pharmacol Ther. 2017;101:763–772. doi:10.1002/cpt.567
11. Zaharenko L, Kalnina I, Geldnere K, et al. Single nucleotide polymorphisms in the intergenic region between metformin transporter OCT2 and OCT3 coding genes are associated with short-term response to metformin monotherapy in type 2 diabetes mellitus patients. Eur J Endocrinol. 2016;175:531–540. doi:10.1530/EJE-16-0347
12. Xiao D, Guo Y, Li X, et al. The Impacts of SLC22A1 rs594709 and SLC47A1 rs2289669 polymorphisms on metformin therapeutic efficacy in Chinese type 2 diabetes patients. Int J Endocrinol. 2016;2016:4350712. doi:10.1155/2016/4350712
13. Choi JH, Yee SW, Ramirez AH, et al. A common 5ʹ-UTR variant in MATE2-K is associated with poor response to metformin. Clin Pharmacol Ther. 2011;90:674–684. doi:10.1038/clpt.2011.165
14. Tkac I, Klimčáková L, Javorský M, et al. Pharmacogenomic association between a variant in SLC47A1 gene and therapeutic response to metformin in type 2 diabetes. Diabetes Obes Metab. 2013;15:189–191. doi:10.1111/j.1463-1326.2012.01691.x
15. Chen S, Zhou J, Xi M, et al. Pharmacogenetic variation and metformin response. Curr Drug Metab. 2013;14:1070–1082. doi:10.2174/1389200214666131211153933
16. Han TK, Proctor WR, Costales CL, et al. Four cation-selective transporters contribute to apical uptake and accumulation of metformin in Caco-2 cell monolayers. J Pharmacol Exp Ther. 2015;352:519–528. doi:10.1124/jpet.114.220350
17. Liang X, Chien H-C, Yee SW, et al. Metformin is a substrate and inhibitor of the human thiamine transporter, THTR-2 (SLC19A3. Mol Pharm. 2015;12:4301–4310. doi:10.1021/acs.molpharmaceut.5b00501
18. Zhou K. Common variants near ATM are associated with glycemic response to metformin in type 2 diabetes. Nat Genet. 2011;43:117–120.
19. Zhou K, Yee SW, Seiser EL, et al. Variation in the glucose transporter gene SLC2A2 is associated with glycemic response to metformin. Nat Genet. 2016;48:1055–1059. doi:10.1038/ng.3632
20. Rotroff DM, Yee SW, Zhou K, et al. Genetic Variants in CPA6 and PRPF31 are associated with variation in response to metformin in individuals with type 2 diabetes. Diabetes. 2018;67:1428–1440. doi:10.2337/db17-1164
21. Florez JC, Jablonski KA, Taylor A, et al. The C allele of ATM rs11212617 does not associate with metformin response in the Diabetes Prevention Program. Diabetes Care. 2012;35:1864–1867. doi:10.2337/dc11-2301
22. van Leeuwen N, Nijpels G, Becker ML, et al. A gene variant near ATM is significantly associated with metformin treatment response in type 2 diabetes: a replication and meta-analysis of five cohorts. Diabetologia. 2012;55:1971–1977. doi:10.1007/s00125-012-2537-x
23. Out M, Becker ML, van Schaik RH, et al. A gene variant near ATM affects the response to metformin and metformin plasma levels: a post hoc analysis of an RCT. Pharmacogenomics. 2018;19:715–726. doi:10.2217/pgs-2018-0010
24. Ji L, Tong X, Wang H, et al. Efficacy and safety of traditional Chinese medicine for diabetes: a double-blind, randomised, controlled trial. PLoS One. 2013;8:e56703. doi:10.1371/journal.pone.0056703
25. Sesti G, Marini MA, Cardellini M, et al. The Arg972 variant in insulin receptor substrate-1 is associated with an increased risk of secondary failure to sulfonylurea in patients with type 2 diabetes. Diabetes Care. 2004;27:1394–1398. doi:10.2337/diacare.27.6.1394
26. Ren Q, Xiao D, Han X, et al. Genetic and clinical predictive factors of sulfonylurea failure in patients with type 2 diabetes. Diabetes Technol Ther. 2016;18:586–593. doi:10.1089/dia.2015.0427
27. Fagerholm V, Scheinin M, Haaparanta M. alpha2A-adrenoceptor antagonism increases insulin secretion and synergistically augments the insulinotropic effect of glibenclamide in mice. Br J Pharmacol. 2008;154:1287–1296. doi:10.1038/bjp.2008.186
28. Zhou K, Donnelly L, Burch L, et al. Loss-of-function CYP2C9 variants improve therapeutic response to sulfonylureas in type 2 diabetes: a Go-DARTS study. Clin Pharmacol Ther. 2010;87:52–56. doi:10.1038/clpt.2009.176
29. Rena G, Hardie DG, Pearson ER. The mechanisms of action of metformin. Diabetologia. 2017;60:1577–1585. doi:10.1007/s00125-017-4342-z
30. Grahame Hardie D. AMP-activated protein kinase: a key regulator of energy balance with many roles in human disease. J Intern Med. 2014;276:543–559. doi:10.1111/joim.12268
31. Xiao B, Sanders MJ, Carmena D, et al. Structural basis of AMPK regulation by small molecule activators. Nat Commun. 2013;4:3017. doi:10.1038/ncomms4017
32. Willows R, Navaratnam N, Lima A, Read J, Carling D. Effect of different gamma-subunit isoforms on the regulation of AMPK. Biochem J. 2017;474:1741–1754. doi:10.1042/BCJ20170046
33. Ross FA, Jensen TE, Hardie DG. Differential regulation by AMP and ADP of AMPK complexes containing different gamma subunit isoforms. Biochem J. 2016;473:189–199. doi:10.1042/BJ20150910
34. Yavari A, Stocker C, Ghaffari S, et al. Chronic Activation of gamma2 AMPK induces obesity and reduces beta cell function. Cell Metab. 2016;23:821–836. doi:10.1016/j.cmet.2016.04.003
35. Jablonski KA, McAteer JB, de Bakker PIW, et al. Common variants in 40 genes assessed for diabetes incidence and response to metformin and lifestyle intervention in the diabetes prevention program. Diabetes. 2010;59:2672–2681. doi:10.2337/db10-0543
36. Ramos-Lopez O, Samblas M, Milagro FI, et al. Circadian gene methylation profiles are associated with obesity, metabolic disturbances and carbohydrate intake. Chronobiol Int. 2018;35:969–981. doi:10.1080/07420528.2018.1446021
37. Maruthur NM, Gribble MO, Bennett WL, et al. The pharmacogenetics of type 2 diabetes: a systematic review. Diabetes Care. 2014;37:876–886. doi:10.2337/dc13-1276
38. Porto AG, Brun F, Severini GM, et al. Clinical Spectrum of PRKAG2 Syndrome. Circ Arrhythm Electrophysiol. 2016;9:e003121. doi:10.1161/CIRCEP.115.003121
39. Luptak I, Shen M, He H, et al. Aberrant activation of AMP-activated protein kinase remodels metabolic network in favor of cardiac glycogen storage. J Clin Invest. 2007;117:1432–1439. doi:10.1172/JCI30658
40. Hunter RW, Treebak JT, Wojtaszewski JF, Sakamoto K. Molecular mechanism by which AMP-activated protein kinase activation promotes glycogen accumulation in muscle. Diabetes. 2011;60:766–774. doi:10.2337/db10-1148
41. Stumvoll M, Nurjhan N, Perriello G, Dailey G, Gerich JE. Metabolic effects of metformin in non-insulin-dependent diabetes mellitus. N Engl J Med. 1995;333:550–554. doi:10.1056/NEJM199508313330903
 © 2021 The Author(s). This work is published and licensed by Dove Medical Press Limited. The full terms of this license are available at https://www.dovepress.com/terms.php and incorporate the Creative Commons Attribution - Non Commercial (unported, v3.0) License.
By accessing the work you hereby accept the Terms. Non-commercial uses of the work are permitted without any further permission from Dove Medical Press Limited, provided the work is properly attributed. For permission for commercial use of this work, please see paragraphs 4.2 and 5 of our Terms.
© 2021 The Author(s). This work is published and licensed by Dove Medical Press Limited. The full terms of this license are available at https://www.dovepress.com/terms.php and incorporate the Creative Commons Attribution - Non Commercial (unported, v3.0) License.
By accessing the work you hereby accept the Terms. Non-commercial uses of the work are permitted without any further permission from Dove Medical Press Limited, provided the work is properly attributed. For permission for commercial use of this work, please see paragraphs 4.2 and 5 of our Terms.