")
Back to Journals » Clinical Epidemiology » Volume 7
Adaption and validation of the Safety Attitudes Questionnaire for the Danish hospital setting
Authors Kristensen S, Sabroe S, Bartels P, Mainz J, Bang Christensen K
Received 8 October 2014
Accepted for publication 24 November 2014
Published 2 February 2015 Volume 2015:7 Pages 149—160
DOI https://doi.org/10.2147/CLEP.S75560
Checked for plagiarism Yes
Review by Single anonymous peer review
Peer reviewer comments 5
Editor who approved publication: Professor Henrik Sørensen
Solvejg Kristensen,1–3 Svend Sabroe,4 Paul Bartels,1,5 Jan Mainz,3,5 Karl Bang Christensen6
1The Danish Clinical Registries, Aarhus, Denmark; 2Department of Health Science and Technology, Aalborg University, Aalborg, Denmark; 3Aalborg University Hospital, Psychiatry, Aalborg, Denmark; 4Department of Public Health, Aarhus University, Aarhus, Denmark; 5Department of Clinical Medicine, Aalborg University, Aalborg, Denmark; 6Department of Biostatistics, University of Copenhagen, Copenhagen, Denmark
Purpose: Measuring and developing a safe culture in health care is a focus point in creating highly reliable organizations being successful in avoiding patient safety incidents where these could normally be expected. Questionnaires can be used to capture a snapshot of an employee's perceptions of patient safety culture. A commonly used instrument to measure safety climate is the Safety Attitudes Questionnaire (SAQ). The purpose of this study was to adapt the SAQ for use in Danish hospitals, assess its construct validity and reliability, and present benchmark data.
Materials and methods: The SAQ was translated and adapted for the Danish setting (SAQ-DK). The SAQ-DK was distributed to 1,263 staff members from 31 in- and outpatient units (clinical areas) across five somatic and one psychiatric hospitals through meeting administration, hand delivery, and mailing. Construct validity and reliability were tested in a cross-sectional study. Goodness-of-fit indices from confirmatory factor analysis were reported along with inter-item correlations, Cronbach's alpha (α), and item and subscale scores.
Results: Participation was 73.2% (N=925) of invited health care workers. Goodness-of-fit indices from the confirmatory factor analysis showed: c2=1496.76, P<0.001, CFI 0.901, RMSEA (90%CI) 0.053 (0.050-0056), Probability RMSEA (p close)=0.057. Inter-scale correlations between the factors showed moderate-to-high correlations. The scale stress recognition had significant negative correlations with each of the other scales. Questionnaire reliability was high, (α=0.89), and scale reliability ranged from α=0.70 to α=0.86 for the six scales. Proportions of participants with a positive attitude to each of the six SAQ scales did not differ between the somatic and psychiatric health care staff. Substantial variability at the unit level in all six scale mean scores was found within the somatic and the psychiatric samples.
Conclusion: SAQ-DK showed good construct validity and internal consistency reliability. SAQ-DK is potentially a useful tool for evaluating perceptions of patient safety culture in Danish hospitals.
Keywords: patient safety culture, questionnaire, validity, reliability, Denmark
Introduction
Billions of people use hospital services across the globe yearly, and the vast majority are treated without risk or harm. However, studies from the United States, Australia, and Europe suggest that one in ten hospital patients experience some sort of harm, and it has been shown that medical errors, low quality of patient care, and increased length of hospital stay can be caused by lack of attention to patient safety.1,2 A culture of safety has been suggested to be a core mechanism of the organizational context underlying safe, effective, and timely patient care.3 Patient safety culture (PSC) is a reflection of professionals’ shared assumptions, values, beliefs, and practices.4 Enhancing PSC has been associated with reductions in specific patient safety problems, such as ventilator-associated pneumonia, blood stream infections, patient falls, medication errors, and increased mortality.5–7 Thus, clinical governance activities more and more often include measuring and improving PSC as a stepping stone to creating highly reliable organizations.8
Questionnaires can be used to capture a snapshot of an employee’s perception of different dimensions of PSC. The results can help clinical leaders, frontline staff, quality and safety officers, etc, to identify cultural strengths and weaknesses, plan strategic improvement activities, and track changes over time, as well as provide benchmark data.9
A good questionnaire should be valid, reliable, and discriminating. The validity of a questionnaire is assessed by the degree to which the questionnaire measures what it is intended to measure, whereas reliability mirrors the degree of stability and repeatability of measures. Discrimination is the ability of the questionnaire to separate out important differences between the individuals or groups.10
There is a growing body of literature on the psychometric properties of PSC questionnaires.11–15 Two of the most used PSC questionnaire were compared by Etchegaray and Thomas and considerable variation was found with regard to the number of items, topics of the cultural dimensions, feasibility, and usage. The Safety Attitudes Questionnaire (SAQ) was reported to be feasible in use and one of the most thoroughly validated and widely used instruments, with stable factors and good psychometric properties across different national settings.16 Further, the SAQ has also been extensively used to explore the relationship between perceptions of PSC and clinical outcomes.5–7
The SAQ was originally developed for hospitals from the Flight Management Attitudes Questionnaire, an explorative human factor questionnaire used in commercial aviation.17,18 The SAQ was developed via a multistep process, and it was validated using explorative and confirmatory factor analysis (CFA) on data from 10,843 respondents from 203 clinical areas in the United States, the United Kingdom, and New Zealand. Exploratory factor analysis was applied to explore the existence of a latent structure of the items, yielding six factors. Multilevel CFA was used to evaluate the factor structure underlying the six factors. The goodness-of-fit values indicated good internal construct validity of the model, confirming that the SAQ measures the aspects of the culture expressed in the hypothesized factors. Item-factor correlations within clinical areas indicated that the items can generally be regarded as important contributors to the hypothesized factor to which they belong. The scale reliability coefficients confirmed acceptable internal consistency reliability; items in the questionnaire are closely related as a group measuring the same underlying construct.19
The validity and reliability of translated versions of the SAQ has been documented in countries including Norway, Germany, Switzerland, Sweden, and the Netherlands. In these studies, the most frequently used method is to assess internal construct validity and reliability. Items indicated on the original factor structure are hypothesized as six factors.20–28 They are preselected into the factors and confirmed using CFA.20–28 Questionnaire and scale reliability are investigated by Cronbach’s alpha (α).20–24,28,29 When the items and the scales remain across cultural setting, one can benchmark data and cooperate in improvement and learning activities following a measurement.
A literature search on PubMed, PsycINFO, Embase, and MEDLINE, using the search terms “patient safety culture” or “patient safety climate” combined with “Denmark”, did not reveal any validated instruments for measuring professionals’ perceptions of PSC in Danish hospitals. A lack of evidence describing the quality of PSC in Danish hospitals was also identified, although one 12-year-old study described 1,584 doctors’ and nurses’ attitudes toward reporting of adverse events.30
The aim of this study was to adapt the SAQ for use in Danish hospitals, assess construct validity and internal consistency reliability, and present Danish benchmarking data.
Materials and methods
A cross-sectional study design was applied. A Danish version of SAQ (SAQ-DK) was distributed across five somatic and one psychiatric hospital.
The SAQ
The original SAQ short form is an explorative questionnaire with 31 items comprising six subscales, and additional items on demographic information. The subscales are: teamwork climate, safety climate, stress recognition, job satisfaction, working conditions, and perceptions of unit management. It can be used to assess safety attitudes across specialties in hospitals. Respondents answer on a 5-point Likert scale as 1= disagree strongly, 2= disagree slightly, 3= neutral, 4= agree slightly, and 5= agree strongly. Items are assumed to have interval properties. Items 2 and 11 are negatively worded.18
Adaption of the SAQ into Danish
The corresponding author obtained permission to translate and use the SAQ short form from 2007 into the Danish language verbally from B Sexton, The University of Texas at Houston – Memorial Hermann Center for Healthcare Quality and Safety Houston, Texas, USA. The SAQ was adapted into Danish following modified principles adapted from Beaton et al, which involved a forward–backward translation technique, a pilot study, and a refinement process via an expert panel.31 Jointly, panel members had linguistic skills, knowledge of terminology, and clinical and patient safety work experience in Denmark.
To establish face validity of SAQ-DK, the 15 respondents of the pilot study were asked to comment on any wording that could lead to doubt in understanding of the items or be misinterpreted, and suggest alternative wording. Most importantly, the adaption process resulted in addressing health care workers in general, not specifically doctors and nurses, and allowing respondents to select “not applicable” as a possible answer. This is consistent with recommendations from Norway.20
Study setting and sample
Denmark has a public health care system with free and equal access for citizens. The system is predominantly financed through general taxes, and operationalizing hospital care is the responsibility of the five Danish regions. Approximately 14% of hospital staff are doctors, 43% nurses and nursing assistants, and 42% other staff, such as allied health care profession, administrative, and technical staff.32 Female hospital employees amount to 82%.33 Denmark has a sophisticated array of initiatives for monitoring and developing the quality of care.34 Analogs between Denmark and the other Scandinavian countries are present for hospital organization, education, and concepts of patient safety.
The study was integrated into two quality improvement projects: the Danish Safer Hospital Programme and the Good Psychiatric Department.35,36 One acute care, regional, somatic, teaching hospital from each of the five regions and one psychiatric university hospital participated. Across the somatic hospitals, 15 inpatient bed units were selected as; one operating room and one intensive care unit in each hospital. Further, one unit of internal medicine, oncology, neurology, surgery, and cardiology participated across the five hospitals. In the psychiatric hospital, six outpatients units and ten inpatient bed units were included from the same ward. These were either disease-specific or generic and either open or closed units. In total, 31 in- and outpatient units (clinical areas) participated.
Based on human resource data provided by the hospitals, 1,263 respondents (doctors, nurses, nursing assistants and similar, psychologists, physiotherapists, occupational therapists, music therapists, logopedics staff, dietitians, social workers, administrative staff, and hospital porters) were eligible for participation. Full- and part-time staff working in the selected clinical areas at least half of their working time qualified for inclusion. This included staff with a significant work commitment to a clinical area, as they could influence or be influenced by the culture in that clinical area, but who were not based in that clinical area, eg, a physiotherapist spending most of her/his working hours in a specific bed unit while being employed in the physiotherapy department.
Data collection
Data were collected between April and August 2011.
A local project manager was appointed at each hospital to cooperate with the research team and ensure uniformity in the data collection by following the study guidelines.
Participants were given 4 weeks to answer the questionnaire. A reminder was posted in the units after 2 weeks; it also stated the current local participation rate.
In the 15 somatic clinical areas, the questionnaire was distributed through unit-specific staff meetings led by one of the researchers and/or the hospital project manager. Meeting administration was supplemented by hand delivery and in-house mailing to include staff not participating in the meetings. In the psychiatric clinical areas, the survey and study information were distributed electronically via emails to all included staff.
The participants were informed that participation was voluntary and anonymous, that all answers would be treated with confidentiality, and that no individual responses would be available to local management. The Danish Data Protection Agency approved the study.
Statistical analysis
Respondent demographics are expressed as frequencies.
To describe the construct validity of SAQ-DK, the underlying cross-national original factorial structure described by Sexton et al was tested.19 The hypothesized six-factor model comprised teamwork climate (items 1–6), safety climate (items 7–13), job satisfaction (items 15–19), stress recognition (items 20–23), perceptions of unit management (items 24–29), and working conditions (items 30–32).37 The hypothesized model was tested via CFA using the entire sample of 925 respondents from 31 clinical areas. The fit of the model was described by chi-square statistics (χ2, degrees of freedom [df], P-value), comparative fit index (CFI), and root mean square error of approximation (RMSEA) in accordance with recommendations by Blunch10 and previous SAQ validation studies.19,20,22,23,29 The following threshold values were used for an acceptable model fit: χ2/df <5.00 as suggested by Wheaton et al;38 CFI >0.90 as suggested by Bentler;39 RMSEA <0.06 as suggested by Bentler;39 and the probability RMSEA (probability RMSEA >0.05) as suggested by Browne and Cudeck.40
Item-factor loadings exceeding 0.30 were regarded as acceptable as per Hair et al.41
Further, construct validity was studied by the degree of linear association between pairs of two dimensions; Pearson’s correlation coefficients (r) were described.
The reliability of SAQ-DK was described by measures of internal consistency. Items hypothesized as a factor were regarded as closely related if α>0.70.42 The correlation between one item and the sum score of the other items in the hypothesized factor (item-subscale correlations) was examined to investigate item discrimination, which is the degree to which differences between respondents’ ratings of a single item were consistent with differences in their ratings of the subscale as a whole. Item discrimination was regarded as acceptable if the correlation coefficients ≥0.30.10
SAQ-DK item scores were described as %-missing, mean item score, standard deviations (SDs), %-agree (“agree slightly” or “agree strongly”) and %-disagree (“disagree slightly” or “disagree strongly”). Item mean scores were calculated based upon the 5-point Likert scale (range 1–5) as the total sum of scores from 1–5 from all respondents divided by the number of responses. Items with missing answers were eliminated from the item statistics.
Benchmarking data were presented for the entire sample and for the somatic and psychiatric samples respectively (subsamples), reporting the percent of respondents with a positive attitude (%-positive) and scale mean scores and SD. For this purpose, SAQ-DK item scores were converted to a 0- to 100-point scale, where 1=0, 2=25, 3=50, 4=75, and 5=100. Items 2 and 11 were reverse scored, so that their valence matched the positively worded items. Individual scale mean scores were calculated by the average score of the scaled items (range 0–100), and the %-positive was calculated as the proportion of respondents with an individual mean scale score of 75 or higher, according to recommendations in the literature.43 SAQ-DK mean scale scores were calculated for each scale by the average score of the scaled items (range 0–100).
Subscale results of the somatic and the psychiatric samples were compared. For each scale, %-positive were compared using chi-square testing. Mean scale scores of the two subsamples were compared using independent t-testing.
Analyses of variance (ANOVAs) were performed to test for significant between-unit variability in mean scale scores within the psychiatric and the somatic samples respectively. Analysis of the somatic sample was controlled for the effect of hospital.
Statistical significance was defined as P≤0.05.
The CFA was performed using SPSS Amos version 22.0; all other analyses were performed using IBM SPSS version 21.0 (IBM Corporation, Armonk, NY, USA).
Results
In total, 925 of 1,263 questionnaires were returned (73.2%); 277 questionnaires originated from the psychiatric sample and 648 from the somatic sample. In the somatic subsample, the response rate was 71.9%, and, in the psychiatric subsample, it was 76.5%. The number of participants varied from six in small outpatient settings to 80 in large bed units. Respondent characteristics are shown in Table 1.
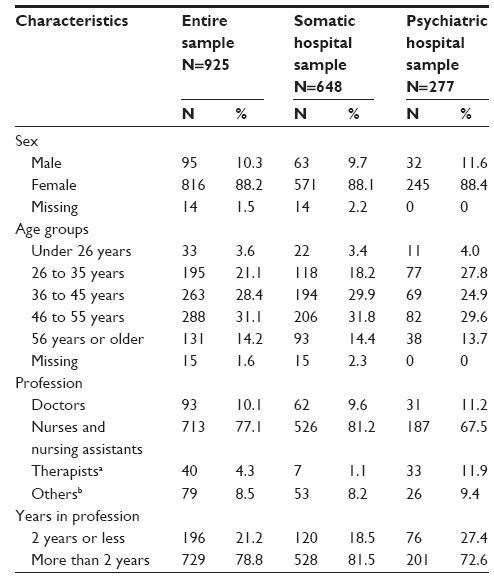 | Table 1 Respondent characteristics |
Item analysis
SAQ-DK item descriptions are shown in Table 2.
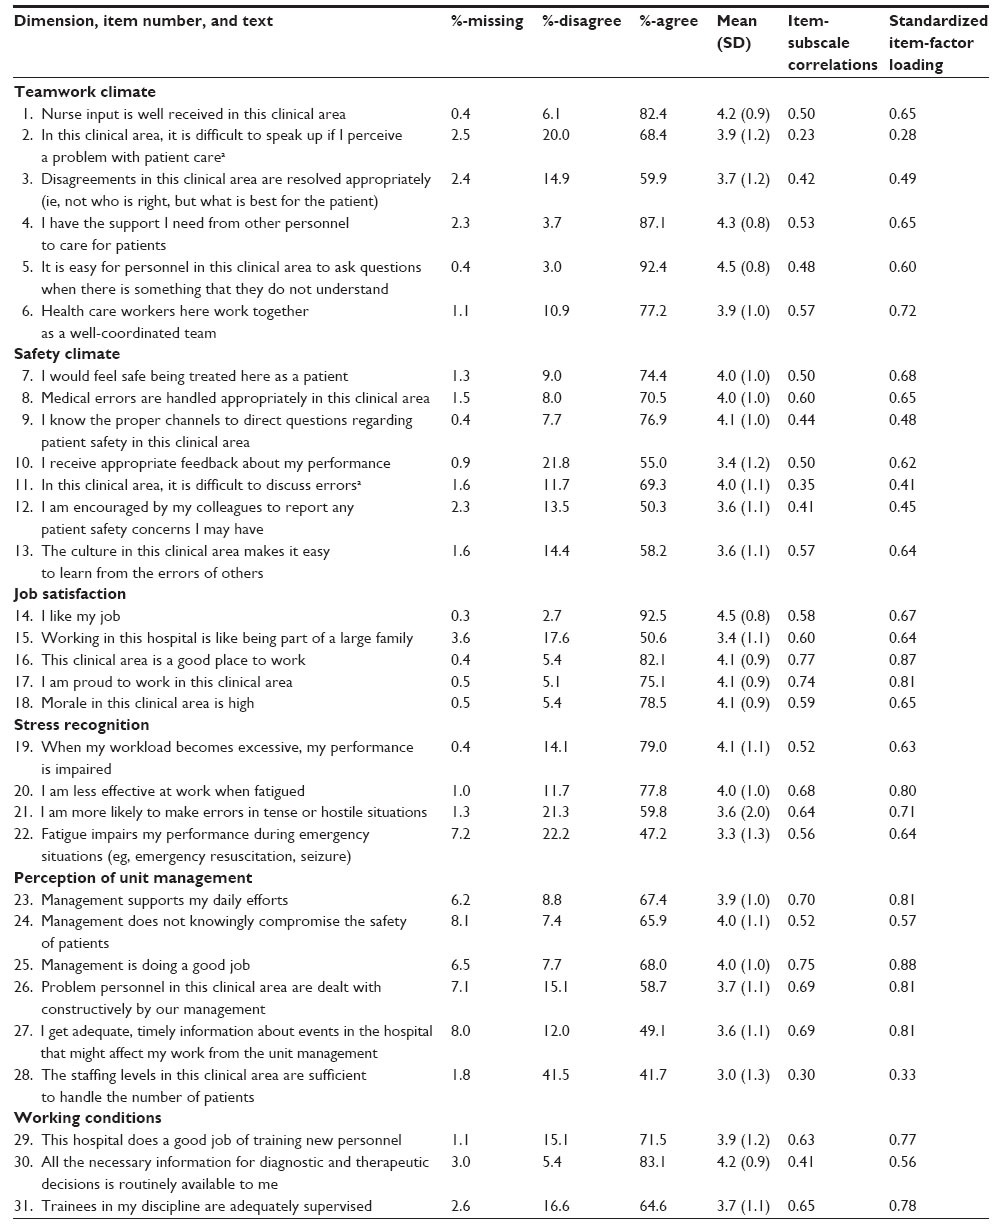 | Table 2 SAQ-DK item descriptions, subscale-corrected item-total correlations, and item-factor loadings (N=925) |
The average rate of incomplete (missing and not applicable) data at the item level was 2.3%, with a range of 0.3% to 8.1%. Item 27, “I get adequate, timely information about events in the hospital that might affect my work from the unit management”, provided the highest proportion (8.1%) of missing answers, and item 14, “I like my job”, from the job satisfaction scale, provided the lowest proportion (0.3%). Items in the perception of unit management scale had the highest proportion of missing data together with item 22: “Fatigue impairs my performance during emergency situations (eg, emergency resuscitation, seizure)” (7.2%). No items were excluded in the further analysis because of the level of missing data.20
A full range of scores between 1 and 5 was observed for all items. Response patterns were observed according to the proportions of %-missing, %-agree, %-disagree, and %-neutral. Item responses were visibly skewed toward the positive, but showed considerable variation across all items. Item 14 had the highest proportion of %-agree (92.5%). Item 28, “The staffing levels in this clinical area are sufficient to handle the number of patients”, provided the lowest level of %-agree (41.7%) and the highest level of %-disagree (41.5%) across all items.
The item mean of item 5, “It is easy for personnel in this clinical area to ask questions when there is something that they do not understand”, and 14, “I like my job”, was above 4.5, indicating little variability in the scores of these two items.
Item reliability characteristics are shown in Table 2. Item-subscale correlations, reflecting the correlation between the score on the item and the total scale score of the other items in the scale, ranged from 0.23 to 0.77. Item 2, “In this clinical area, it is difficult to speak up if I perceive a problem with patient care”, had item-subscale correlations <0.30, indicating a weak relationship with the other items in the hypothesized factor. All other items correlated modestly to well with the sum of the other items in their scale; Pearson’s r>0.30 confirmed good discriminative ability of the items.
The factor structure of the responses was analyzed, and fit indices regarding item-factor loadings are also shown in Table 2. Only item 2 had an item-factor loading below the acceptable threshold of 0.3. The item-factor loading was 0.28, meaning that less than 8% of variance is explained by the factor. Also, item 28 had a low item-factor loading of 0.33. All other items had item-factor loading between 0.41 and 0.88, explaining 16%–77% of the variance by the factor.
Factor structure of the SAQ
The factor structure of the responses was analyzed to provide formal testing of the goodness of fit of the pre-hypothesized six-factor model to the data. Goodness-of-fit indices following CFA are displayed in Table 3. The chi-square test of the model fit revealed a χ2/df ratio of 3.572, which is below the acceptable threshold of 5.00.38 The CFI was 0.901, exceeding the threshold value of 0.90.39 The RMSEA was 0.053 (90% confidence interval: 0.050–0.056), which was below the anticipated threshold value of 0.06. Finally, the probability RMSEA (p close) was 0.057, which was above the threshold of 0.05, as desired.39
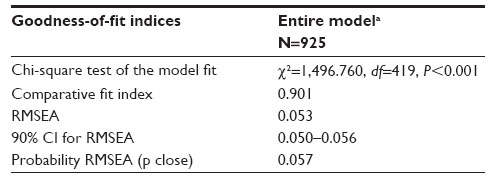 | Table 3 Results of the confirmatory factor analysis |
Scale reliability and correlations
The Cronbach’s alpha coefficient for the total SAQ-DK was high (0.89), and it changed minimally when items were removed (0.88–0.90). Scale reliability is shown in Table 4. Cronbach’s alpha exceeded the set cut off point of 0.70 for all scales (0.70–0.86), indicating good scale reliability.
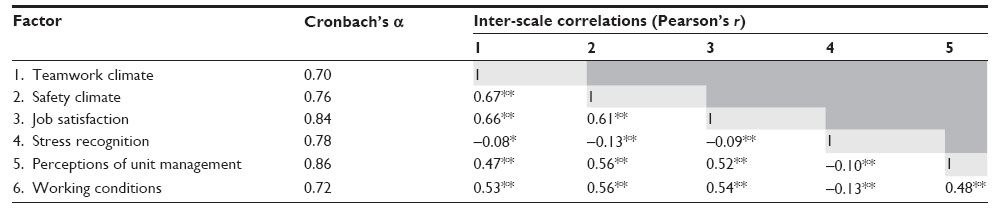 | Table 4 Scale reliability and inter-scale correlations of SAQ-DK (N=925) |
Scale-to-scale correlations were studied by the degree of linear association between pairs of two scales: Pearson’s correlation coefficients are shown in Table 4. All scales correlated negatively, with the stress recognition scale revealing Pearson’s r between -0.13 and -0.08 (P<0.05). Pearson’s correlations indicated significant strong positive relationships for all other scales; correlation coefficients ranged from 0.47 to 0.67 (P<0.01).
Benchmarking data
The entire sample
Subscale results for SAQ-DK (N=925) are shown in Table 5 for the entire sample, reporting %-positive and mean scale statistics.
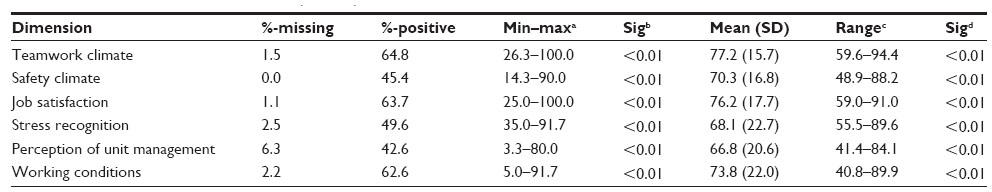 | Table 5 Subscale results for SAQ-DK (N=925) |
Across the entire sample, %-positive ranged from 42.6% for perception of unit management to 64.8% for teamwork climate. Most variation in %-positive across the 31 clinical areas was found for working conditions, where the lowest %-positive was 5.0% and the highest %-positive was 91.7%.
Variations in %-positive across the clinical areas are shown as minimum–maximum in Table 5, and the distributions of %-positive for the 31 clinical areas are shown in Figure 1. Less than 60% of responders reporting positive attitudes would indicate a need for improvement, according to the literature.27 The number of units with %-positive below 60% varied from ten units, (33%) for teamwork climate, to 24 units (77%), for safety climate. Differences in %-positive across the 31 clinical areas were analyzed by χ2 statistics. Significant differences in the proportions of staff with a positive attitude per clinical area were found for all climate dimensions (P<0.05).
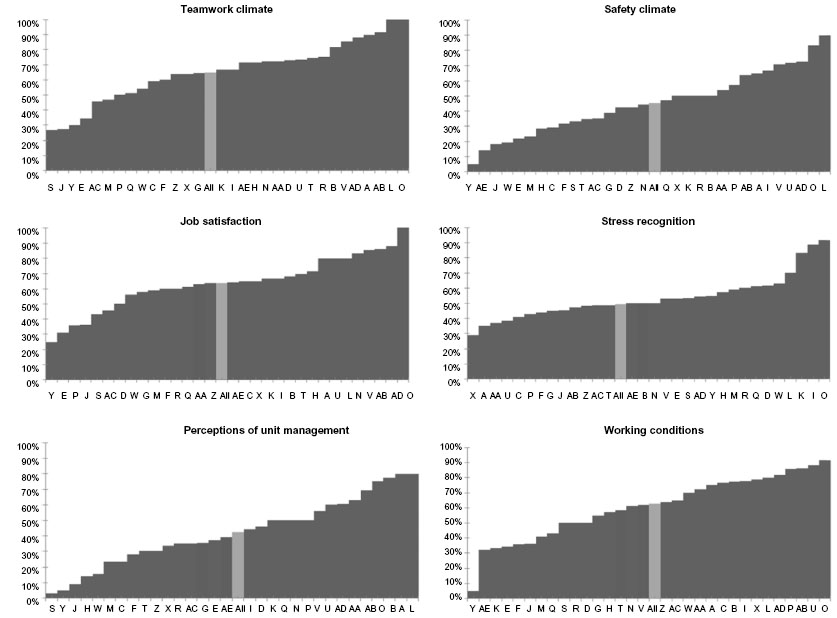 | Figure 1 Distribution of percent of positive scores (%-positive) per dimension for the 31 clinical areas.a |
Higher proportions of positive responders were found among female staff than among male staff for all scales, but differences in %-positive between the sexes were only found for teamwork climate and working conditions (P<0.05). Differences in %-positive were found across doctors, nurses and nursing assistants, and others for perception of unit management only (P<0.05).
Mean scale scores (SD) are displayed in Table 5 and ranged from 66.8 (20.6) for perception of unit management to 77.2 (15.7) for teamwork climate. The scale means of the 31 clinical areas were significantly different for all six cultural dimensions (P<0.001).
Female staff had higher mean scale score than male staff on all scales; however, these were only statistically significant for teamwork climate, safety climate, and job satisfaction (P<0.05). Mean scales scores differed among doctors, nurses and nursing assistants, and others for teamwork climate, job satisfaction, and perception of unit management (P<0.05), but no consistent pattern was found.
The somatic and psychiatric clinical areas
Subscale results for the somatic and the psychiatric samples are shown in Table 6.
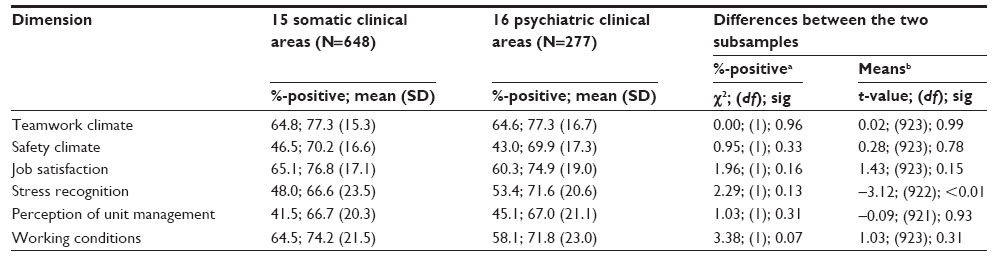 | Table 6 Subscale results within and between the somatic and psychiatric clinical areas |
Comparing %-positive across the two subsamples revealed no differences in %-positive for any of the dimensions (P>0.05).
Comparing scale means across the two samples showed statistically significant differences for the stress recognition scale only, which was higher in the psychiatric than in the somatic sample (t=-3.12, df=922, and P=0.002).
Variability in scale means was tested in both samples separately using ANOVA for each climate dimension. In the somatic sample, testing was controlled for the effect of hospital. In both subsamples, all mean scale scores differed across the clinical areas (P<0.001) for all six dimensions.
Discussion
Based on data from a multisite, cross-sectional study involving 925 health care workers, construct validity and internal consistency reliability of SAQ-DK were investigated and benchmarking data derived. To date, this study presents the most comprehensive evidence-based information on Danish hospital staff perceptions of PSC using a validated questionnaire.30
Construct validity and reliability
CFA was applied to the full dataset, and the fit of the hypothesized six-factor model was described. The χ2/df ratio was below the acceptable threshold.38 The Danish χ2 ratio was higher than in Norway (2.583) and Switzerland (1.653), but well below that found by Sexton et al for the American-English language sample (13.152).19,20,28 The CFI exceeded the threshold value.39 The range for the CFI was 0.90 to 0.99 in other SAQ validation studies.19,20,22–24,28 The RMSEA was below the anticipated threshold value.39 In other SAQ validation studies, the RMSEA ranged from 0.03 to 0.07.19,20,22–24,28 Finally, the probability RMSEA was above the threshold;40 in Norway, it was 0.893.20 Different SAQ validation studies use slightly different SAQ versions and different statistical approaches; this should be taken into account when comparing psychometric properties. For this reason, and because of analogs in education, and concepts and methods in patient safety, the Danish study compares best to the Norwegian.20
Inter-scale correlations revealed negative correlations between the stress recognition scale and all other scales, indicating that this scale is distinct from the other scales and not part of the same underlying construct. The intent of the stress recognition scale is to capture attitudes about stress in the delivery of patient care. Items in the stress recognition scale differ from all other items as they address self-behavior, eg, how stressors affect personal performance, but not to which degree. SAQ items from the other scales emphasize behavior and attitudes of colleagues and the effect on the safety climate. In-depth analysis of the psychometric properties of the stress recognition scale confirms that it is not reflective of PSC in the same way as the other scales, which should be accounted for when planning improvement activities.44 Educating clinicians about how teamwork can effectively counteract, among other things, the impact of fatigue, stress, and high workload on human performance has proved effective.45
Significant strong positive relationships were found among all other scales, indicating that they belong to the same underlying construct. The same scale-to-scale correlation pattern has been found in other SAQ validation studies.19,22,23,29
The Cronbach’s alpha coefficient for the total SAQ-DK was high and changed minimally when the different items were removed. Cronbach’s alpha exceeded 0.70 for all scales. The closer Cronbach’s alpha coefficient is to 1.0, the greater the internal consistency of the items in the instrument or the scale, indirectly indicating the degree to which a set of items measures a single one-dimensional latent construct. At the scale level, Cronbach’s alpha ranged from 0.59–0.89 in other SAQ validation studies.19,20,22–24,28 SAQ-DK showed good internal consistency at the scale and instrument level.
At the item level, item 2, “In this clinical area, it is difficult to speak up if I perceive a problem with patient care”, raised validity concerns: the item-factor loading was below the acceptable threshold of 0.03, and the subscale-corrected item-total correlation indicated a weak relationship with the other items in the scale, thus impairing discriminative ability. A low item-factor loading for item 2 was also found in Turkey.23 Further analysis of the discriminative ability of the items is suggested.
Benchmarking data
Benchmarking data for the full sample and the somatic and psychiatric samples were provided separately. Scale means can mask the extent to which a scale score has a large or small SD, while the proportion of respondents with positive attitudes (%-positive) gives a more explicit picture of the homogeneity of the attitudes of the staff within a specific SAQ dimension. Further, the %-positive is easy to both interpret and assess in terms of the need for improvement among managers and frontline staff; for example, 45% of staff reported positive attitudes, whereas the rule of thumb is that less than 60% of staff reporting positive attitudes in any SAQ dimension would indicate a need for improvement.27
Across the entire sample, %-positive ranged from 42.6%, for perception of unit management, to 64.8%, for teamwork climate. The proportion of staff with positive attitudes was lower for safety climate and perception of unit management in Denmark than in Switzerland and USA.27 Further, the proportion of clinical areas with %-positive below 60% was 77% for safety climate. No differences were found for %-positive across the two subsamples for any of the dimensions, indicating homogeneity in the perceptions of the different dimensions of safety climate for the somatic and psychiatric staff. The Danish results differed from Australian results, wherein poorer PSCs were found in psychiatric than in somatic hospitals.46 Differences in the proportions of staff holding positive attitudes across the 31 clinical areas were found for all dimensions, and the range of %-positive across the Danish clinical areas was larger than in USA and Switzerland.27 Generally, the detected variation in %-positive across clinical areas may result from the local clinical managers demonstrating different levels of engagement in patient safety and support for provision of safe care; a large number of clinical areas might benefit from interventions targeting weak dimensions of the safety culture.47
The Danish scale means compare well with findings from USA and Switzerland.27 Comparing scale means across the two subsamples showed statistically significant differences for the stress recognition scale only; this is consistent with previous research.27 There was variability in all scale mean scores at the clinical area level within the somatic and psychiatric samples respectively. These findings underpin that Danish PSC results should be generated at the unit level to ensure a sense of relevance and ownership for both results and follow up activities based upon results; this is in line with findings from Norway.48
Methodological considerations
The overall response rate was 73%, which is better than in most other SAQ validation studies, with response rates of 52%–79%.19–21,28,29 The response rate stresses the acceptability of measuring PSC and applying SAQ-DK in the Danish hospitals.
In the somatic sample, the response rate was 72%, versus 77% in the psychiatric sample. The different methods of questionnaire distribution (paper format at staff meetings, hand delivery, and internal mailing versus electronic delivery) might have impacted participation differently in the two samples. The extent of local support for the PSC survey and fundamental differences in customs and attitudes toward participation in surveys in the different settings could have influenced participation differently at the clinical area and hospital levels.
The somatic sample did not include university hospitals, and the psychiatric data only originated from one department in a university hospital. The somatic clinical areas represented only a subset of specialties, which should be taken into account when interpreting the results. The sample size was large enough to comply with ten health care staff members per item, as desired for CFA.12
Males were underrepresented in the sample (10%) in comparison with Danish hospital staff (18%) in general. Males generally scored lower than their female colleagues, thus the benchmarking data for the SAQ-DK scales might be overestimated. Further, no information on ethnicity was asked of the respondents, thus no conclusions can be drawn in regard to the influence of ethnicity in the benchmarking data. Although the study is strengthened by inclusion of multiple sites, selection bias cannot be ruled out, and generalization of the findings to other hospitals and health settings should be performed with caution.
The average rate of incomplete data was below 13% for all items; hence, no items were excluded from the analysis, in line with previous research.28 Items in the perception of unit management had the highest proportion of missing answers. This might indicate respondents’ reluctance to answer questions about the management because they regard these questions as sensitive, are not aware of the exact management involvement in patient safety issues, or are in doubt about whether the management could attain access to their answers. Further research could address the underlying causes and implications of high rates of incomplete data. These findings are in line with findings from the Netherlands.21
The phrasing and interpretation of items 2, 11, 22, and 23 was frequently discussed in staff meetings, where the survey was administered or results presented, indicating that information bias might be present. Items 2 and 11 were both negatively worded. Using negative or positive phrasing for these two items does not lead to differences in the fit of the model, based on data from Swedish pharmacies.29 Adaptions of items 22 and 23 in the Swiss SAQ were recommended due to poor psychometric item properties.28 Further studies at the item level are suggested to investigate phrasing, content, and interpretation, especially of items 2, 11, 22, and 23.
Conclusion
SAQ-DK showed acceptable psychometric properties, and seems to be an appropriate tool with which to evaluate health care staff perceptions of PSC in Danish hospitals. However, based upon results of testing, minor adjustments and further testing of a small number of items are suggested.
Studies to identify issues influencing perceptions of the different dimensions of PSC are essential to support decisions about ways to improve, and further studies to investigate the strength of the association between variations in perception of PSC and organizational and clinical variables are needed.
Acknowledgments
The authors would like to acknowledge the participating hospitals, the local project coordinators, and the respondents for their effort and support. TrygFonden is acknowledged for substantial financial support.
Disclosure
The authors report no conflicts of interest in this work.
References
de Vries EN, Ramrattan MA, Smorenburg SM, Gouma DJ, Boermeester MA. The incidence and nature of in-hospital adverse events: a systematic review. Qual Saf Health Care. 2008;17:216–223. | |
Huang DT, Clermont G, Kong L, et al. Intensive care unit safety culture and outcomes: a US multicenter study. Int J Qual Health Care. 2010;22:151–161. | |
Ostroff C, Kinicki AJ, Muhammad RS. Organizational culture and climate. In: Weiner IB, Schmitt NW, Highhouse S, editors. Handbook of Psychology. Volume 12: Industrial and Organizational Psychology. 2nd ed. New York, NY: John Wiley and Sons; 2012:643–676. | |
Schneider B, Ehrhart MG, Macey WH. Organizational climate and culture. Annu Rev Psychol. 2013;64:361–388. | |
Morello RT, Lowthian JA, Barker AL, McGinnes R, Dunt D, Brand C. Strategies for improving patient safety culture in hospitals: a systematic review. BMJ Qual Saf. 2013;22:11–18. | |
Pronovost P. Interventions to decrease catheter-related bloodstream infections in the ICU: the Keystone Intensive Care Unit Project. Am J Infect Control. 2008;36:S171. e1–e5. | |
Weaver SJ, Lubomksi LH, Wilson RF, Pfoh ER, Martinez KA, Dy SM. Promoting a culture of safety as a patient safety strategy: a systematic review. Ann Intern Med. 2013;158:369–374. | |
Pronovost PJ, Berenholtz SM, Goeschel CA, et al. Creating high reliability in health care organizations. Health Serv Res. 2006;41:1599–1617. | |
Nieva VF, Sorra J. Safety culture assessment: a tool for improving patient safety in healthcare organizations. Qual Saf Health Care. 2003;12 Suppl 2:ii17–ii23. | |
Blunch NJ. Introduction to Structural Equation Modelling Using SPSS and Amos. 2nd ed. London: SAGE Publications Ltd, 2012. | |
Colla JB, Bracken AC, Kinney LM, Weeks WB. Measuring patient safety climate: a review of surveys. Qual Saf Health Care. 2005;14:364–366. | |
Flin R, Burns C, Mearns K, Yule S, Robertson EM. Measuring safety climate in health care. Qual Saf Health Care. 2006;15:109–115. | |
Mannion R, Konteh FH, Davies HT. Assessing organisational culture for quality and safety improvement: a national survey of tools and tool use. Qual Saf Health Care. 2009;18:153–156. | |
Robb G, Seddon M. Measuring the safety culture in a hospital setting: a concept whose time has come? N Z Med J. 2010;123:68–78. | |
Singla AK, Kitch BT, Weissman JS, Campbell EG. Assessing patient safety culture: a review and synthesis of the measurement tools. J Patient Saf. 2006;2:105–115. | |
Etchegaray JM, Thomas EJ. Comparing two safety culture surveys: safety attitudes questionnaire and hospital survey on patient safety. BMJ Qual Saf. 2012;21:490–498. | |
Helmreich RL, Merritt AC, Sherman PJ, Gregorich SE, Wiener EL. The Flight Management Attitudes Questionnaire (FMAQ) NASA/UT/FAA Technical Report. 93–94. Austin, TX: University of Texas; 1993. | |
Helmreich RL, Merritt AC. Culture at Work in Aviation and Medicine: National, Organizational, and Professional Influences. Brookfield, VT: Ashgate; 1998. | |
Sexton JB, Helmreich RL, Neilands TB, et al. The Safety Attitudes Questionnaire: psychometric properties, benchmarking data, and emerging research. BMC Health Serv Res. 2006;6:44. | |
Deilkås ET, Hofoss D. Psychometric properties of the Norwegian version of the Safety Attitudes Questionnaire (SAQ), Generic version (Short Form 2006). BMC Health Serv Res. 2008;8:191. | |
Devriendt E, Van den Heede K, Coussement J, et al. Content validity and internal consistency of the Dutch translation of the Safety Attitudes Questionnaire: an observational study. Int J Nurs Stud. 2012;49:327–337. | |
Göras C, Wallentin FY, Nilsson U, Ehrenberg A. Swedish translation and psychometric testing of the safety attitudes questionnaire (operating room version). BMC Health Serv Res. 2013;13:104. | |
Kaya S, Barsbay S, Karabulut E. The Turkish version of the safety attitudes questionnaire: psychometric properties and baseline data. Qual Saf Health Care. 2010;19:572–577. | |
Lee WC, Wung HY, Liao HH, et al. Hospital safety culture in Taiwan: a nationwide survey using Chinese version Safety Attitude Questionnaire. BMC Health Serv Res. 2010;10:234. | |
Nordén-Hägg A, Kälvemark-Sporrong S, Lindblad ÅK. Exploring the relationship between safety culture and reported dispensing errors in a large sample of Swedish community pharmacies. BMC Pharmacol Toxicol. 2012;13:4. | |
Raftopoulos V, Savva N, Papadopoulou M. Safety culture in the maternity units: a census survey using the Safety Attitudes Questionnaire. BMC Health Serv Res. 2011;11:238. | |
Schwendimann R, Zimmermann N, Küng K, Ausserhofer D, Sexton B. Variation in safety culture dimensions within and between US and Swiss Hospital Units: an exploratory study. BMJ Qual Saf. 2013;22:32–41. | |
Zimmermann N, Küng K, Sereika SM, Engberg S, Sexton B, Schwendimann R. Assessing the Safety Attitudes Questionnaire (SAQ), German language version in Swiss university hospitals – a validation study. BMC Health Serv Res. 2013;13:347. | |
Nordén-Hägg A, Sexton JB, Kälvemark-Sporrong S, Ring L, Kettis-Lindblad A. Assessing safety culture in pharmacies: the psychometric validation of the Safety Attitudes Questionnaire (SAQ) in a national sample of community pharmacies in Sweden. BMC Clin Pharmacol. 2010;10:8. | |
Madsen MD, Østergaard D, Andersen HB, Hermann N, Schiøler T, Freil M. [The attitude of doctors and nurses towards reporting and handling errors and adverse events]. Ugeskr Laeger. 2006;168:4195–4200. Danish. | |
Beaton DE, Bombardier C, Guillemin F, Ferraz MB. Guidelines for the process of cross-cultural adaptation of self-report measures. Spine (Phila Pa 1976). 2000;25:3186–3191. | |
Fakta om sundhedsvæsnet – sundhedsvæsnet i tal [Facts about health care – health care in figures] [webpage on the Internet]. Copenhagen: Danske Regioner; 2011 [updated March 25, 2014]. Available from: http://www.regioner.dk/aktuelt/temaer/fakta+om+regionernes+effektivitet+og+%C3%B8konomi/kopi+af+fakta+om+sundhedsv%C3%A6senet. Accessed November 12, 2014. Danish. | |
Gender distribution of hospital staff in Denmark [webpage on the Internet] Copenhagen: Danmarks Statistik; 2014. Available from http://www.statistikbanken.dk/statbank5a/default.asp?w=1366. Accessed December 11, 2014. | |
Hewlett E, Klazinga NS, Kumar A. OECD Reviews of Health Care Quality: Denmark. Executive Summary, Assessement and Recommendations. Paris: OECD, Health Division, Directorate for Employment, Labour and Social Affairs; 2013;9–175. | |
Udvikling af modelafdelinger: den gode psykiatriske afdeling [Development of model departments: the good psychiatric department] [webpage on the internet]. Copenhagen: Sundhedsstyrelsen; 2010 [updated November 27, 2014]. Available from: https://sundhedsstyrelsen.dk/da/sundhed/puljer-og-projekter/2010–2013/udvikling-af-modelafdelinger-den-gode-psykiatriske-afdeling. Accessed December 11, 2014. Danish. | |
Safer Hospitals Programme: Danish Safer Hospital Programme [webpage on the Internet]. Copenhagen: Dansk Selskab for Patientsikkerhed [updated February 3, 2014]. Available from: http://www.patientsikkerhed.dk/in-english/projects/safer-hospitals-programme.aspx. Accessed December 11, 2014. | |
SAQ Short Form Scale Items. The University of Texas at Houston – Memorial Hermann Center for Healthcare Quality and Safety Houston, Texas, USA. Available from: https://med.uth.edu/chqs/files/2012/05/SAQ-Short-Form-Scale-Items_000.pdf. Accessed December 18, 2014. | |
Wheaton B, Muthén B, Alwin DF, Summers GF. Assessing reliability and stability in panel models. In: Heise DRT, editor. Sociological Methodology. San Francisco, CA: Jossey-Bass; 1977:84–136. | |
Bentler PM. Comparative fit indexes in structural models. Psychol Bull. 1990;107:238–246. | |
Browne MW, Cudeck R. Alternative ways of assessing model fit. In: Testing Structural Equation Models. Bollen KA, Long JS, editors. Newbury Park, CA: Sage Publications, Inc.; 1993:136–162. | |
Hair JF Jr, Black WC, Babin BJ, Anderson RE. Multivariate Data Analysis. 7th ed. London: Prentice-Hall; 2009. | |
Pett MA, Lackey NR, Sullivan JJ. Making Sense of Factor Analysis: The Use of Factor Analysis for Instrument Development in Health Care Research. Thousand Oaks, CA: Sage Publications, Inc; 2003. | |
To calculate the 100pt scale score (e.g., teamwork climate) for an individual respondent. The University of Texas at Houston – Memorial Hermann Center for Healthcare Quality and Safety Houston, Texas, USA. Available from: https://med.uth.edu/chqs/files/2012/05/Scale-Computation-Instructions.pdf. Accessed December 18, 2014. | |
Taylor JA, Pandian R. A dissonant scale: stress recognition in the SAQ. BMC Res Notes. 2013;6:302. | |
Dawson D, Reid K. Fatigue, alcohol and performance impairment. Nature. 1997;388:235. | |
Gallego B, Westbrook MT, Dunn AG, Braithwaite J. Investigating patient safety culture across a health system: multilevel modelling of differences associated with service types and staff demographics. Int J Qual Health Care. 2012;24:311–320. | |
McFadden KL, Stock GN, Gowen CR 3rd. Leadership, safety climate, and continuous quality improvement: impact on process quality and patient safety. Health Care Manage Rev. Epub February 21, 2014. | |
Deilkås E, Hofoss D. Patient safety culture lives in departments and wards: multilevel partitioning of variance in patient safety culture. BMC Health Serv Res 2010;10:85. |
 © 2015 The Author(s). This work is published and licensed by Dove Medical Press Limited. The full terms of this license are available at https://www.dovepress.com/terms.php and incorporate the Creative Commons Attribution - Non Commercial (unported, v3.0) License.
By accessing the work you hereby accept the Terms. Non-commercial uses of the work are permitted without any further permission from Dove Medical Press Limited, provided the work is properly attributed. For permission for commercial use of this work, please see paragraphs 4.2 and 5 of our Terms.
© 2015 The Author(s). This work is published and licensed by Dove Medical Press Limited. The full terms of this license are available at https://www.dovepress.com/terms.php and incorporate the Creative Commons Attribution - Non Commercial (unported, v3.0) License.
By accessing the work you hereby accept the Terms. Non-commercial uses of the work are permitted without any further permission from Dove Medical Press Limited, provided the work is properly attributed. For permission for commercial use of this work, please see paragraphs 4.2 and 5 of our Terms.