")
Back to Journals » Journal of Blood Medicine » Volume 15
Assessment of Erythrocyte Osmotic Fragility and Its Determinants, and Comparison of Hematological Indices Among Type 2 Diabetes Mellitus Patients on Follow-Up at Jimma Medical Center, Southwest Ethiopia
Authors Tujara Z , Reta W , Tadesse E, Dereje I , Tesfa M
Received 9 November 2023
Accepted for publication 18 January 2024
Published 22 January 2024 Volume 2024:15 Pages 9—19
DOI https://doi.org/10.2147/JBM.S445620
Checked for plagiarism Yes
Review by Single anonymous peer review
Peer reviewer comments 2
Editor who approved publication: Dr Martin H Bluth
Zenebe Tujara,1 Wondu Reta,2 Eyasu Tadesse,2 Ifa Dereje,1 Mekonnen Tesfa1
1Department of Medicine, College of Health sciences, Salale University, Fiche, Oromia, Ethiopia; 2Department of Biomedical Sciences, Institute of Health, Jimma University, Jimma, Oromia, Ethiopia
Correspondence: Zenebe Tujara, Tel +251-917796943, Email [email protected]
Background: Diabetes Mellitus (DM) is one of the most prevalent non-communicable diseases worldwide. Approximately 9.3% of the general population was estimated to have DM globally in 2019. Erythrocyte osmotic fragility (EOF) in hyperglycemic patients is expected to increase and determine the rate of erythrocyte hemolysis.
Purpose: This study aimed to assess erythrocyte osmotic fragility (EOF) and its determinants and to compare hematological indices among T2DM patients on follow-up at the Jimma Medical Center (JMC), Jimma, Southwest Ethiopia.
Methods: A facility-based cross-sectional study involving 124 participants (each 62) of T2DM patients and controls was conducted from October to November 2020 using a structured questionnaire. 5 mL of venous blood was drawn to assess OF, complete blood count, and blood glucose levels. EOF was investigated using a series hypotonic solution of NaCl. The supernatant of the centrifuged sample was transferred to cuvette test tubes, and the hemolysis stage was read on a spectrophotometer. The collected data were coded and entered into Epi-data Version 3.1. The analysis was performed using SPSS Version 23.
Results: Compared with non-diabetic controls, patients with T2DM had significantly increased EOF. FBG > 126mg/dl (AOR=7.741, 95% CI: 1.562– 38.360), PPBG > 200 mg/dl (AOR=7.576, 95% CI: 1.519– 37.791), RDW (AOR=4.558, 95% CI: 1.136– 18.284) were significantly associated with abnormal EOF. A statistically significant increase in total white blood cells and absolute neutrophil counts (P < 0.001) were observed in T2DM patients. From RBC indices, red blood cell distribution width (RDW) and mean corpuscular volume (MCV) were significantly increased in T2DM patients (P < 0.001).
Conclusion: This study suggests that EOF was greater in patients with T2DM than in non-diabetic controls and was determined by FBG, PPBG, and RDW. The study also demonstrated that hematological index alterations were higher in T2DM subjects than in non-diabetic controls.
Keywords: diabetes, osmotic fragility, hematological indices, RBC
Introduction
Diabetes mellitus (DM) is a group of metabolic disorders with various etiologies characterized by chronic hyperglycemia resulting from defects in insulin secretion, insulin action, or both. It is one of the most prevalent noncommunicable diseases worldwide.1 The prevalence of DM is steadily increasing worldwide and can be attributed to recently released updates from the World Health Organization (WHO), which states that the number of people with DM has quadrupled to an estimated 422 million adults worldwide since the publication of the first report by the WHO in 1980.2
In 2017, it was estimated that 451 million people (aged 18–99 years) had DM worldwide. This number is expected to increase to 693 million by 2045. In 2017, approximately 5 million deaths worldwide were attributable to DM in the age range of 20–99 years.3 According to the World Health Organization (WHO), DM is becoming a global pandemic.4 DM encompasses a heterogeneous group of disorders characterized by hyperglycemia associated with multiple disorders, including metabolic, cellular, and blood disturbances, leading to vascular complications.5 T2DM, which is previously referred to as “noninsulin-dependent DM” or “adult-onset DM”, accounts for ~90–95% of all DM. It encompasses individuals with insulin resistance and is usually a relative (rather than absolute) insulin deficiency.6 T2DM associated with a poor lifestyle is a primary factor leading to a progressive reduction in physical activity and changes in dietary habits. Therefore, a greater percentage of the population will be overweight or obese. It is one of the most common chronic diseases worldwide, affecting approximately 7% of the general population, is a major public health challenge in the 21st century.3,7 The chronic hyperglycemia in DM, especially when poorly controlled, causes long-term damage, dysfunction, and failure of different organs of the body like the eyes, kidneys, nerves, blood, and blood vessels.8
Patients with T2DM have a significantly higher erythrocyte osmotic fragility (EOF) than matched non-diabetic subjects, and fasting plasma glucose is the strongest correlate of increased EOF in the patient group.9,10 EOF was greater in T2DM, which is positively correlated with glycosylated hemoglobin. EOF determines the rate of hemolysis in erythrocytes.9,11 Several studies have shown that abnormal erythrocyte membrane formation in hyperglycemia may be associated with increased RBC fragility, leading to anemia.12 The pathogenesis of diabetic complications is complex; however, hyperglycemia appears to be the primary mechanism of disease progression. Chronic exposure to glucose affects human cells. However, erythrocytes have gained special interest from the research community owing to their long lifespan (120 days).13 Abnormal glycation, which can adversely affect hemoglobin and membrane proteins in erythrocytes, has been shown to correlate with reduced membrane fluidity. High levels of glycosylated hemoglobin have been found to correlate with decreased deformability of erythrocytes.14 Researchers have observed that EOF is increased in chronic diabetic patients in the Indian population. They suggested that EOF is related to the duration of DM.15
Anemia is a highly prevalent condition in people with T2DM. It is defined by the WHO as hemoglobin concentration below the threshold for women (>15 years) <12.0 g/dl and men (>15 years) <13 g/dl. Generally, anemia in chronic diseases such as DM is normocytic normochromatic, although in a few cases, microcytosis and hypochromia also occur.16
According to the WHO definition, up to nearly 30% of patients with T2DM and nearly one in four (23%) patients with type 1 or T2DM have anemia, especially those with reduced kidney function.17 One of the proposed mechanisms for anemia in T2DM is the formation of abnormal erythrocyte cell membranes, which lead to reduced surface area-to-volume. A reduced surface-area-to-volume ratio might result in decreased deformability and thereby influence the splenic sequestration of erythrocytes, leading to increased destruction and anemia.9 T2DM represents a major public health challenge because of its continuously increasing prevalence. According to the International Federation of Diabetes (IDF), there was an increased by approximately 64% in the worldwide prevalence. It is estimated that approximately 151 million to 415 million patients were affected by T2DM from 2000 to 2015, respectively, and it is expected to surge from this point by 36% until 2040, reaching approximately 642 million.18 Additional data also show that worldwide, there is a projected increase in the prevalence of DM from 382 million (8.3%) in 2013 to 592 million (10.1%) in 2035. The prevalence of this phenomenon in developing countries is increasing, and its number is even more striking. This is especially true in areas where populations quickly embrace western lifestyles.19 The future looks concerning for developing countries, as they are projected to bear a staggering 77% of the global burden of the DM epidemic in the 21st century. This unfortunate reality can be attributed to factors such as population growth, unhealthy diet, obesity, and sedentary lifestyle.20 Moreover, in 2017, the projected national DM (20–79) prevalence in Ethiopia, estimated the IDF Atlas, was 5.2%.21 Although several studies in different countries have suggested an increase in EOF in T2DM patients, few studies have been conducted in the Ethiopian population. Therefore, the aim of this study was to assess EOF and its determinants and to compare hematological indices among T2DM patients on follow-up at the Jimma Medical Center (JMC), Jimma, Southwest Ethiopia.
Materials and Methods
Study Area and Study Period
The study was conducted at the diabetic clinic of the Jimma Medical Center (JMC). Geographically, it is located in Jimma City, 352 km southwest of Addis Ababa, the capital of Ethiopia. JMC is the only teaching hospital in southwest Ethiopia that provides services for approximately 15,000 inpatients, 160,000 outpatient attendants, 11,000 emergency cases, and 4500 deliveries annually, with a catchment population of approximately 15 million people. The study was conducted between September and November 2020.
Study Design and Populations
A hospital-based comparative cross-sectional study was conducted from September to November 2020, and the source population included all T2DM patients on follow-up at the JMC 2020. All T2DM patients on follow-up at the JMC, with age- and sex-matched healthy controls, were included as the study population. The inclusion criteria were as follows: all patients with T2DM aged greater than 18 years and who had follow-up for at least 3 years at the diabetic clinic were included in the study. Patients with known chronic renal disease, pregnant mothers, and those who were appointed for a second time during the study period were excluded from the study.
Sample Size Determination and Sampling Techniques
The study participants were assumed to be homogeneous. No significant differences were observed among the study participants. Considering these assumptions, a consecutive sampling technique was employed to select both groups, until the desired number of participants was achieved.
The double population mean formula was used to calculate the sample size using Open Epi version 2, open-source calculator by considering the following assumptions: 95% confidence interval (two-sided), 80% power, and the ratio of cases to control group was 1:1. The mean and standard deviation (SD) of the hematocrit (%) ratio for the T2DM and control groups in a study conducted in Italy9 were 39.7 and 5.5 for the T2DM group and 42 and 3.3 for the control group, respectively. The sample size was determined to be 62 for each group.
Data Collection Methods
Structured questionnaires were used to collect baseline data. Trained clinical nurses who provided healthcare at a chronic outpatient clinic collected blood samples. After obtaining consent from the participants, approximately 5 mL of venous blood was collected into EDTA tubes at the time of the clinic visit (follow-up). When taking blood, health workers wore well-fitting, non-sterile gloves, and hand hygiene was performed before and after each procedure. The EOF status was measured using spectrophotometry. To perform the fragility test of RBC, a series of a hypotonic solutions of NaCl were prepared with different strengths in 14 test tubes, numbered serially (0.0, 0.10, 0.20, 0.30, 0.35, 0.40, 0.45, 0.50, 0.55, 0.60, 0.65, 0.75, 0.85, and 0.9%), and kept in the test tube rack. One drop of anticoagulant-mixed blood was added to each test tube and mixed gently by inverting the test tubes. After waiting for about half an hour of hemolysis, the test tubes were centrifuged for approximately 5 min at 2500 rpm using Thermo Scientific (MR-23i, Germany). After centrifugation, the supernatant was transferred to a cuvette and the hemolysis stage was measured using a spectrophotometer and recorded in a datasheet. In addition to routine laboratory investigations, experienced laboratory professionals performed a complete blood count (CBC) using a Sysmex XT-1800i (Sysmex, Japan) and blood glucose status (FBG and PPBG). Other demographic and DM-related data, such as current age, sex, residence, diabetes duration, and age at onset of DM, will be gathered through face-to-face interviews in a separate room for privacy.
Data Processing and Analysis
The collected data were entered into Epi data version 3.1 and exported to SPSS version 23 for analysis. Crosschecking and cleaning were performed to avoid missing values, outliers, and inconsistencies before the analysis. A descriptive analysis was performed to determine the frequency of sociodemographic and other variables. The mean ± SD of all study groups was compared for statistical significance using an independent t-test. Pearson’s correlation test was used to identify the correlation between continuous variables, and logistic regression was used to compute the relationship between independent and dependent variables. The results of continuous data are presented as means and standard deviations. Statistical significance was set at P < 0.05.
Data Quality Control
Before data collection, the questionnaire was translated into Afan Oromo and Amharic, and back-translated into English to maintain consistency. Data collectors were trained, adequately oriented, and data collectors were supervised by the principal investigator. Data were collected using a questionnaire, and the information provided by the patients was crosschecked with the recorded data for consistency and completeness. The validity, accuracy, and precision of these tools were evaluated. To maintain the quality of the laboratory tests, standard operating procedures were followed for the collection of blood specimens for research. CBC analysis was performed according to the hospital protocol. After collection of the blood samples, labeling was performed on the sample and request paper with the same identification number. Data quality was maintained by daily on-site supervision during the data collection period.
Ethical Considerations
Ethical clearance for the study was obtained from the Jimma University Institute of Health Institutional Review Board. Written letter of permission for data collection was provided to the Jimma University Medical Center administrative office, endocrinology department, and the hospital’s laboratory unit. This study was conducted in accordance with the ethical principles of the declaration of Helsinki. Written informed consent was obtained from all the participants. Throughout this research, investigators, data collectors, and advisors carefully applied all preventive measures against COVID-19. Physical distance was intellectually maintained at any time during face-to-face contact. Sanitizers, gloves, and facemasks were made available. Laboratory equipment was sanitized before and after the procedure. All participant information was kept confidential via a coding system and no direct benefit was given to the participants. Experienced laboratory technicians performed venous blood collection as a routine, acceptable clinical practice, with no potential risk. Blood samples were collected from a dedicated location to ensure patient comfort and privacy. The laboratory test results and their implications were communicated to the patients and their care providers immediately during the next follow-up to assist them in improving diabetic care.
Results
Characteristics of Study Participants
A total of 124 participants (62 T2DM patients and 62 controls) were included in this study. Of the total T2DM patients, 36 (58.1%) were males and 26 (41.9%) were females. Similarly, among 124 healthy controls, 36 (58.1%) and 26 (41.9%) were males and females, respectively. The mean age (mean ± SD) was 50.71±12.8 and 48.29±8.1 years for T2DM patients and controls. The majority of the T2DM participants were farmers (32.3%) from rural (51.6%), and their age was >49 (54.8%) (Table 1).
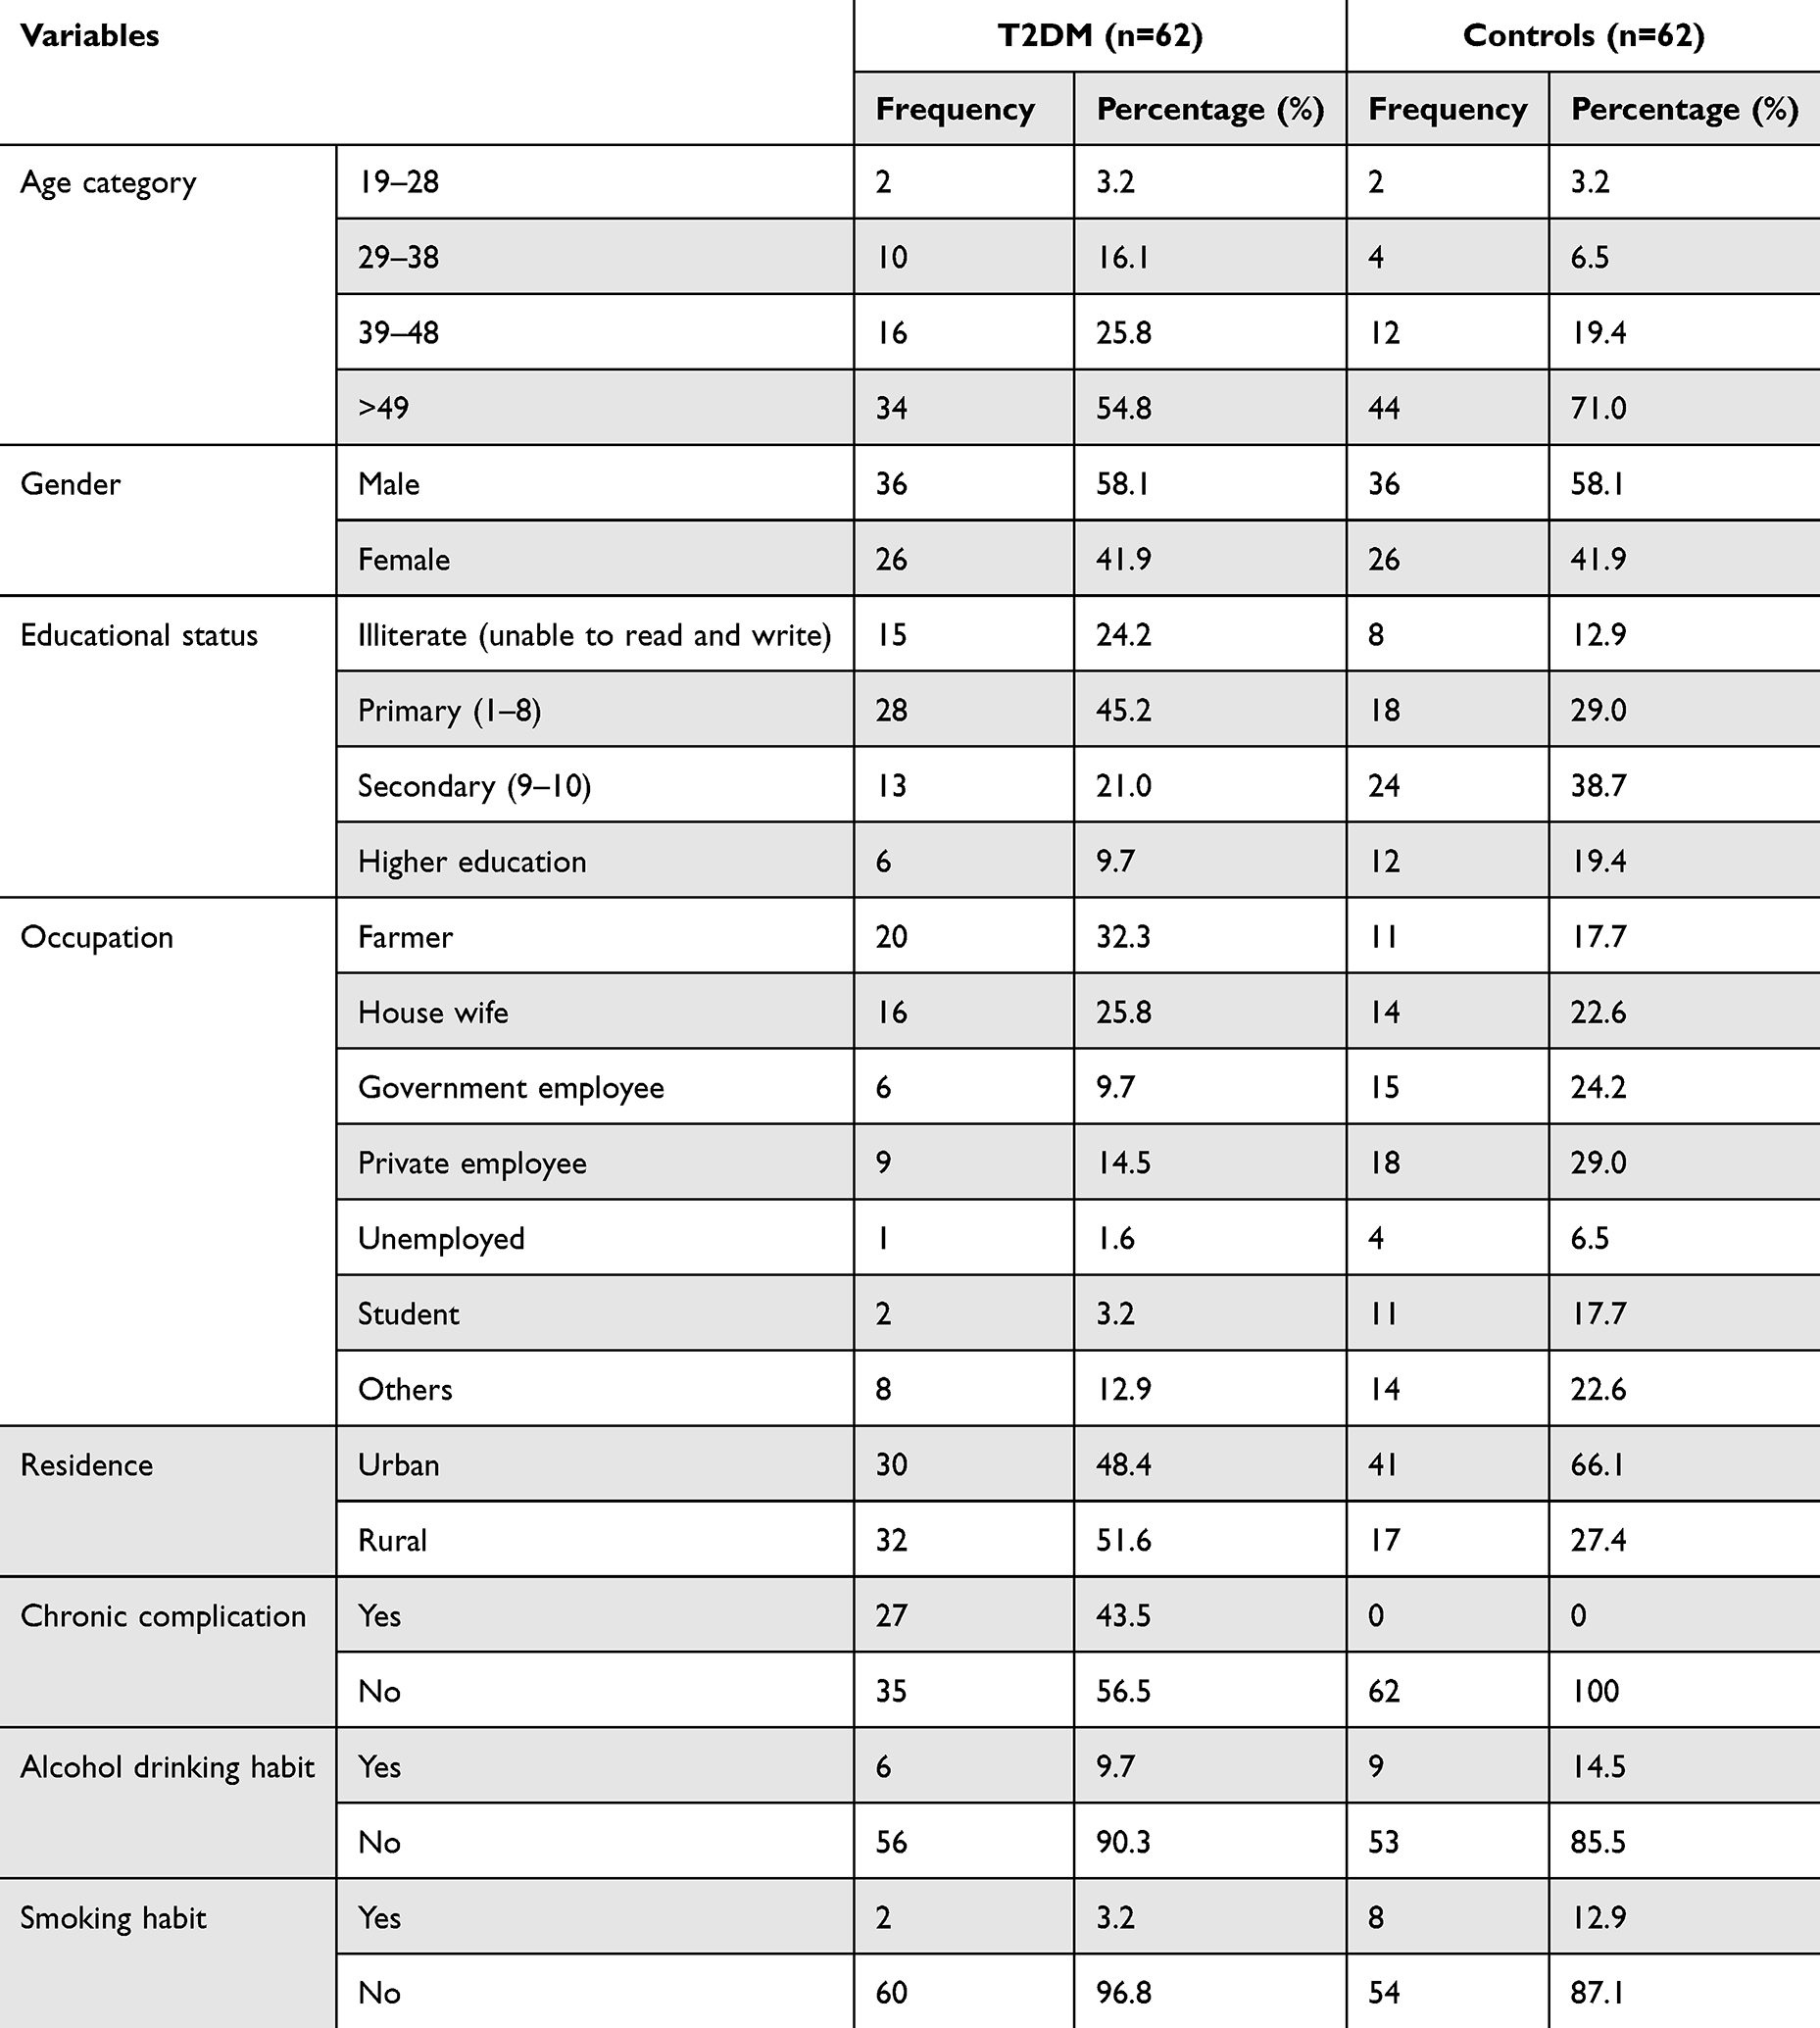 |
Table 1 Socio-Demographic Characteristics and Substance Use Behavior of the Study Participants at JMC, Southwest Ethiopia, 2020 (n=124) |
Comparison of Various Parameters of DM & EOF Among Study Participants
Mean (±SD) FBS was significantly higher (P<0.001) in T2DM (156.92 ±39.60) g/dl than the control group (93.34 ± 8.079). Mean (±SD) of PPBS was significantly higher (P<0.001) in T2DM (197.03 ± 9.46) g/dl than in the control group (116.77 ± 5.894). Regarding EOF, mean values of NaCl solution for initial, medial, and complete hemolysis were 0.540 ±0.055%, 0.455 ± 0.043%, and 0.382 ± 0.035% and 0.456 ± 0.023%, 0.40 ± 0.014%, and 0.345 ± 0.014% between cases and controls respectively (Figure 1). A significant difference (P<0.001) was found between the groups for all types of hemolysis (Table 2). Among study participants, 80.65% and 6.5% of T2DM and controls had abnormal hemolysis, respectively (Table 3).
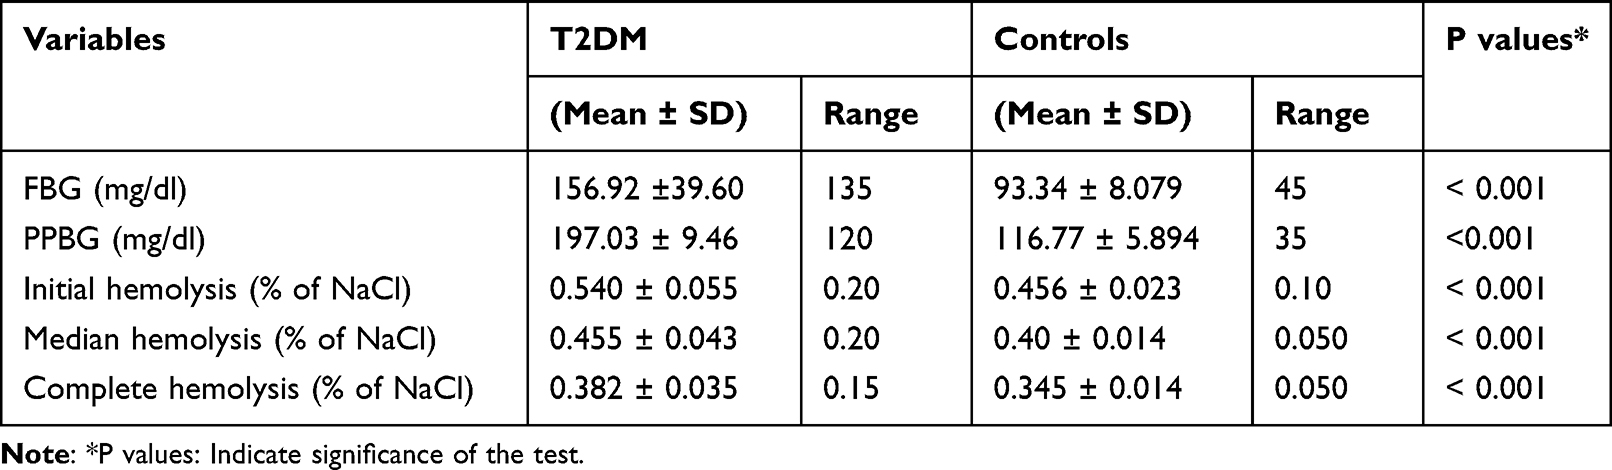 |
Table 2 Comparison of Various Parameters of Diabetes & Erythrocyte Fragility Among Test Group and Control Group of the Study Participants at JMC, Southwest Ethiopia, 2020 (n=124) |
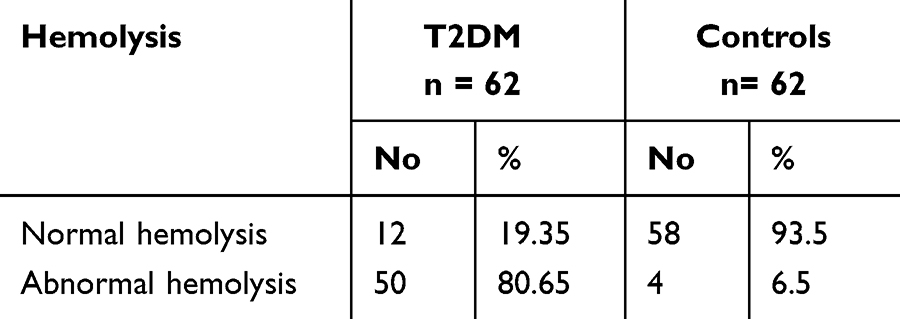 |
Table 3 Nature of Hemolysis in the Study Groups at JMC, Southwest Ethiopia, 2020 (n=124) |
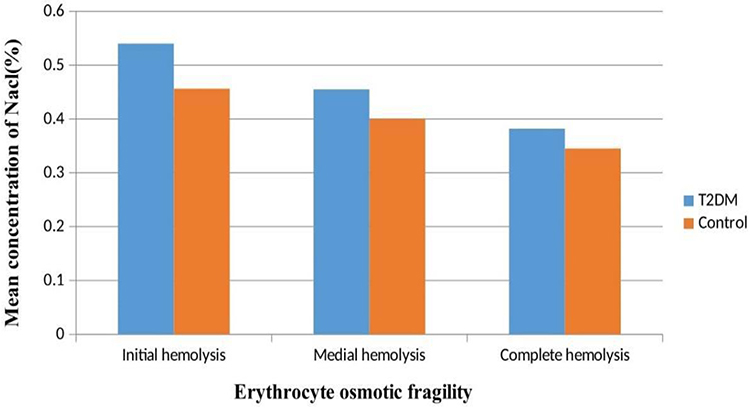 |
Figure 1 The mean concentration of NaCl of OFT in Diabetic and non-diabetic study participants at JMC, Southwest Ethiopia, 2020 (n=124). |
Comparison of Hematological Profile Among Study Participants
Regarding the white blood cell white blood cell (WBC) indices, a statistically significant increase in total WBC counts (P < 0.001) and absolute neutrophil count (P < 0.001) was observed in T2DM patients compared to the control group. Among the RBC indices, red blood cell distribution width (RDW) and mean corpuscular volume (MCV) showed statistically significant increases in T2DM (P < 0.001) patients. In addition, statistically significant increases in platelet counts (P < 0.001) were observed in T2DM patients compared with those in the control group (Table 4).
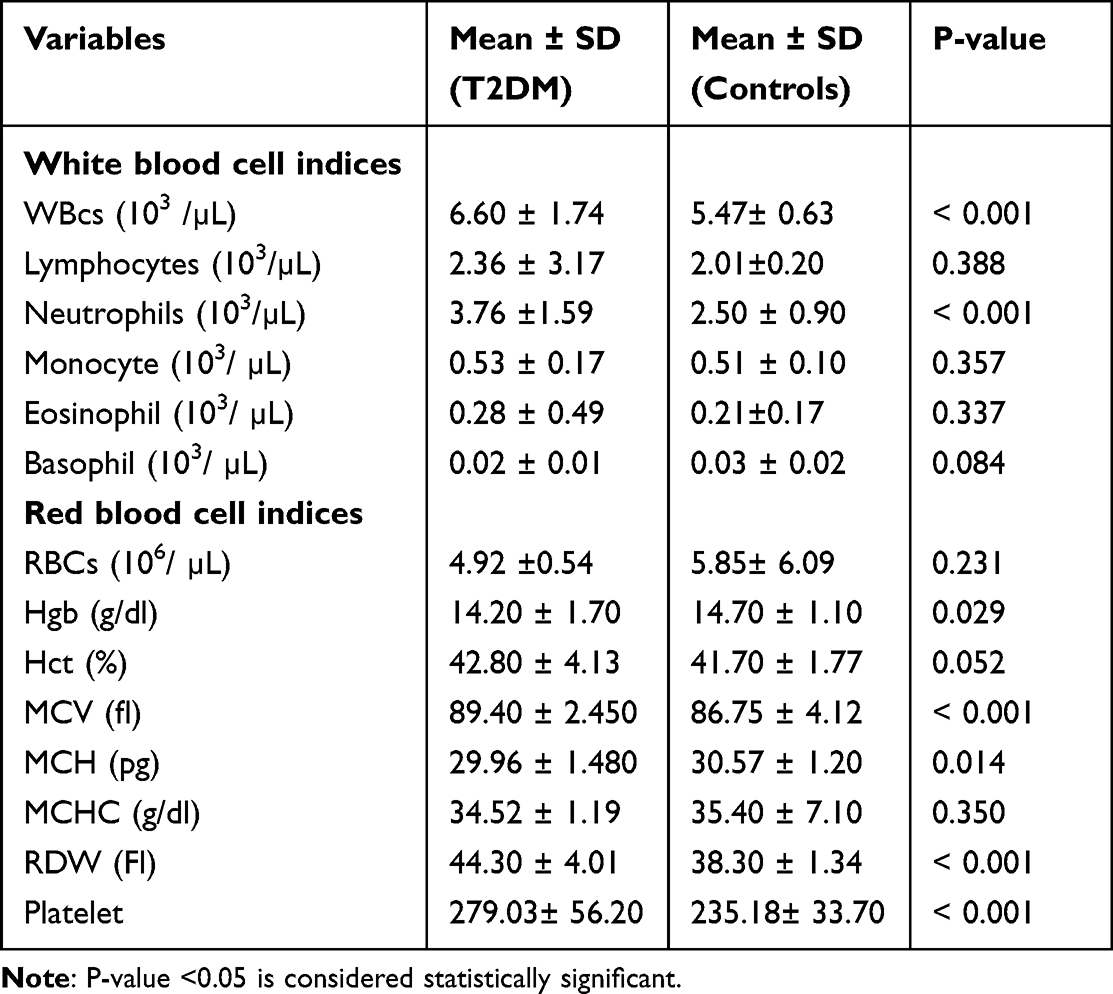 |
Table 4 Comparison of Hematological Indices of the Study Participants at JMC, Southwest Ethiopia, 2020 (n=124) |
Correlations of EOF Status with FBG and PPBG Among Study Participants
The correlation of FBS and PPBS with initial, medial, and complete hemolysis was significantly positive in the T2DM group (Table 5). Pearson’s correlation also indicated that the Hb level was significantly (P<0.001) negatively correlated with initial hemolysis (Figure 2).
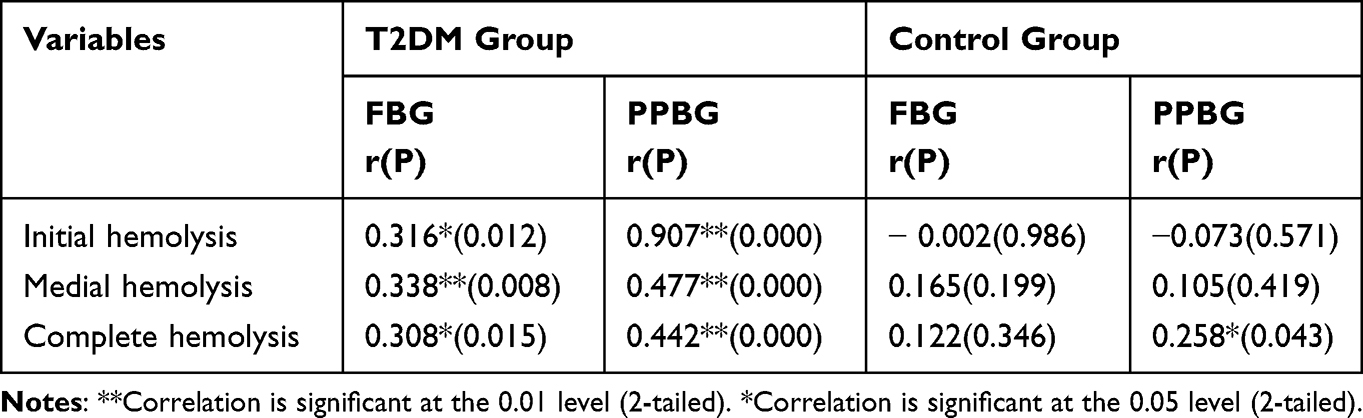 |
Table 5 Pearson’s Correlations (r) of EOF Status with FBG and PPBG Among T2DM Patients and Healthy Controls at JMC, Southwest Ethiopia, 2020 (n=124) |
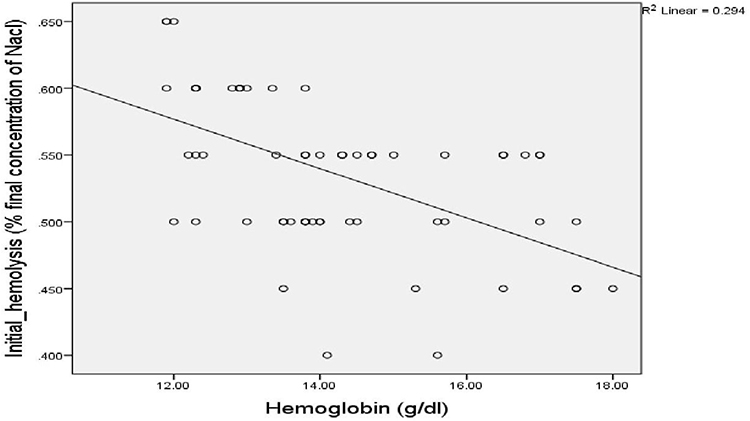 |
Figure 2 Correlation between Hb (g/dl) and initial hemolysis per percentage of NaCl concentration in samples of type 2 diabetic patients at JMC, Southwest Ethiopia, 2020 (r= - 0.542 P <0.001). |
Correlations of EOF Status with Hematological Parameters Among T2DM Patients
On Pearson correlation, some hematological parameters, such as RDW (fl), MCHC (g/dl), and Platelet (103/µL) in T2DM patients showed a strong positive correlation with abnormal hemolysis (Table 6).
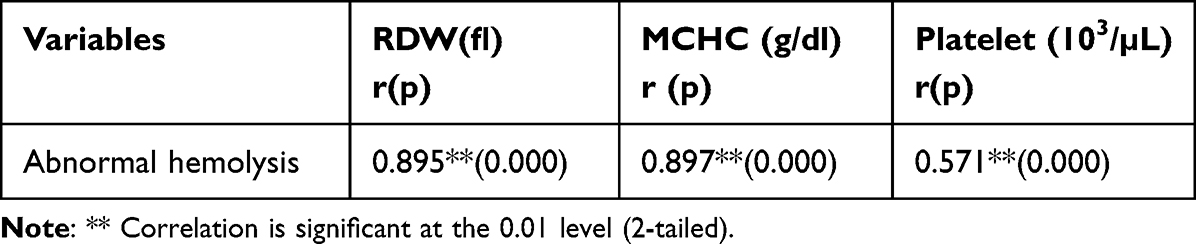 |
Table 6 Pearson’s Correlations (r) of EOF Status with Hematological Parameters Among T2DM Patients at JMC, Southwest Ethiopia, 2020 |
Factors Determine Erythrocyte Osmotic Fragility
To evaluate the association of each independent variable with the occurrence of EOF, binary logistic regression was performed between the occurrence of EOF (dependent variable) and selected factors (independent variable). To identify the most significant determinants of EOF, factors that showed a P-value ≤0.25 in the bivariate analysis, were candidates for the multivariate logistic regression model. Analyses revealed a statistically significant association between FBG (mg/dl), PPBG (mg/dl), RDW, and abnormal EOF. Accordingly, patients with FBG >126 mg/dl were approximately eight times more likely to have abnormal EOF than those with FBG <126mg/dl (AOR=7.741, 95% CI: 1.562–38.360). Similarly, those who have PPBG >200 mg/dl were approximately eight times more likely to have abnormal EOF than those with <200 mg/dl (AOR=7.576, 95% CI: 1.519–37.791). Additionally, patients who have RDW >40 FL were approximately five times more likely to have abnormal EOF than those with RDW <40 FL (AOR=4.558, 95% CI: 1.136–18.284) (Table 7).
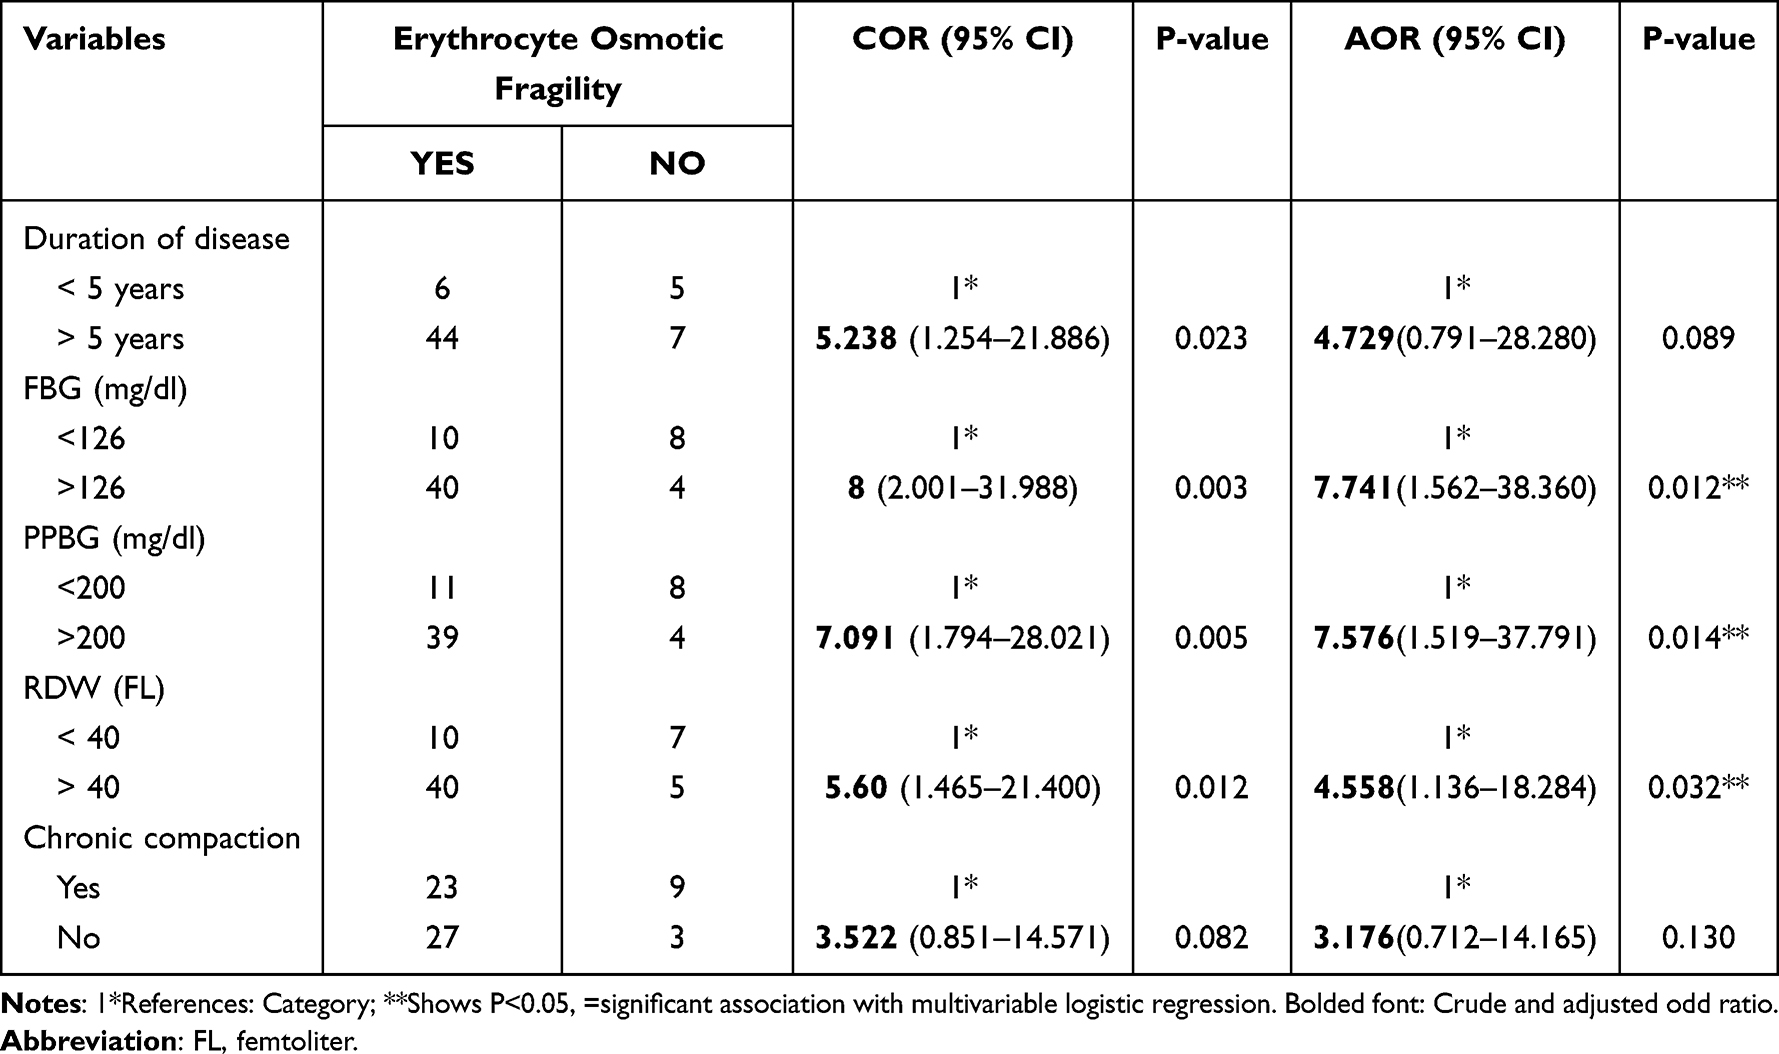 |
Table 7 Multi-Variable Logistic Regression of Variables Associated with EOF Among T2DM Patients at JMC, Southwest Ethiopia, 2020 (n=124) |
Discussion
This study was conducted to assess EOF and its determinants and to compare hematological indices among patients with T2DM. The findings of this study revealed significant differences in EOF between the T2DM and control groups. This study indicated 80.65% and 6.5% of T2DM and controls showed abnormal hemolysis, respectively.
The mean values of NaCl solution for initial, medial, and complete hemolysis in T2DM were 0.540 ±0.055, 0.455 ± 0.043, and 0.382 ± 0.035, respectively. In control group, it was 0.456 ± 0.023, 0.40 ± 0.014 and 0.345 ± 0.014. A significant difference (P<0.001) was observed between the two groups for all types of hemolysis. This study is in line with studies conducted in Nigeria and India, which confirmed that EOF increased in patients with diabetes.10,15,22
The results of this study indicate that EOF is negatively correlated with hemoglobin levels (Figure 2), which is consistent with the results of studies conducted in Southern India and Egypt.11,23 This finding implies that patients with T2DM are at risk of developing hemolytic anemia. A moderate-to-strong positive correlation was observed between all forms of EOF and blood glucose (FBG and PPBG) (Table 5), which was simulated in a study conducted in Italy.9 This finding emphasizes the importance of strong glycemic control in minimizing EOF and consequent problems in DMs.
Research evidence suggests that hematological indices are altered in patients with T2DM.24 In patients with DM, persistent hyperglycemia exposes RBCs to elevated glucose concentrations, resulting in glycation of hemoglobin, prothrombin, fibrinogen, and other proteins involved in clotting mechanisms.25 In this study, there was a significant reduction in hemoglobin levels compared to the control group (P<0.05). This finding is in line with those of studies conducted in the UK and Bangladesh, which indicated that patients with DM were anemic.26–28 Our study also revealed that, among other RBC indices, RDW and MCV values were significantly different between the T2DM and control groups (Table 4).29,30 A high RDW indicates impairment of erythropoiesis, reflecting chronic inflammation and increased levels of oxidative stress, both of which are significant signs of T2DM that result in variations in RBC size.31 This study also included a comparison of platelet counts between control and diabetic patients. The study showed a significant difference in platelet counts between the diabetic and control groups (p<0.001). Our findings are in line with those of a study conducted at Lagos State University Teaching Hospital, Nigeria, which revealed a higher mean platelet count in patients with diabetics than in non-diabetic controls.32
Insulin resistance appears to increase platelet activation, which is consistent with the increased platelet reactivity.33 However, in contrast to our findings, a study conducted at the University of Gondar indicated that despite the increase in platelet count in T2DM, the duration it was not significant.34 Duration of DM and other environmental factors may account for the variability of platelet count across studies. In the current study, it was observed that there was a significant increase in both white blood cell (WBC) and neutrophil counts in the T2DM group compared to the control group. A study conducted in Southern Taiwan also indicated that the WBC count is elevated in T2DM patients and may contribute to vascular complications.35 High WBC count may be associated with a decline in insulin sensitivity. These data indicate that inflammation plays a role in insulin resistance and the subsequent development of T2DM.36 Our study also suggested an increase in the absolute monocyte and eosinophil counts; however, no significant difference was found between the two groups. This finding is in agreement with previously published reports on the risk of atherosclerosis in a community and study conducted at the University of Gondar.34,37
Biological evidence suggests that inflammation may induce T2DM, and epidemiological studies have shown an association between a higher WBC count and T2DM.29,38 Surprisingly, RDW, MCHC, and Platelet count showed a strong positive correlation with abnormal hemolysis in the current study (Table 6). This finding suggests that red blood indices and platelet count alterations are one of the causes of EOF due to viscoelasticity, and that the shape of red blood cells is disturbed in T2DM.39
Our study also attempted to identify the factors that determine EOF. This study indicated that the odds of developing abnormal EOF among T2DM patients with FBG levels ≥126 mg/dl were eight times more likely than among those with FBG levels <126 mg/dl. This study also showed greater odds for the occurrence of abnormal EOF among T2DM patients with PPBG ≥ 200 mg/dl than among those with PPBG < 200 mg/dl. This finding is in line with those of studies conducted in Italy, Nigeria, and Sudan.9,10,40 This may be because the chronic increase in blood glucose levels causes oxidative modifications of membrane-bound proteins in RBCs, which affects the strength and functional properties of the membrane. Thus, the RBCs membrane weakens and cannot withstand mild hypotonic conditions, leading to increased EOF. In addition, our study suggested that patients with RDW > 40 FL were approximately five times more prone to develop abnormal EOF than those with RDW < 40fl.
Conclusion
The results of this study indicate that EOF is greater in T2DM participants than in non-diabetic controls and was determined by FBG, PPBG, and RDW. This study also demonstrated that hematological index alterations were higher in T2DM subjects than in non-diabetic controls and indicated a strong positive correlation between RDW, MCHC, platelets, and EOF.
Acknowledgments
The authors acknowledge Jimma University, Biomedical Science Department Unit of Physiology, and Jimma University Medical Center for their support throughout the study.
Disclosure
The authors declare no conflicts of interest regarding the publication of this paper.
References
1. Association AD. Standards of medical care in diabetes—2019 abridged for primary care providers. Clin Diabetes. 2019;37(1):11. doi:10.2337/cd18-0105
2. World Health Organization. World Health Organization Global Report on Diabetes. Geneva: World Health Organization; 2016.
3. Cho N, Shaw JE, Karuranga S, et al. IDF Diabetes Atlas: global estimates of diabetes prevalence for 2017 and projections for 2045. Diabet Res Clin Pract. 2018;138:271–281. doi:10.1016/j.diabres.2018.02.023
4. Akhter A, Fatema K, Ahmed SF, Afroz A, Ali L, Hussain A. Prevalence and associated risk indicators of retinopathy in a Rural Bangladeshi Population with and without Diabetes. Ophthalmic Epidemiol. 2013;20(4):220–227. doi:10.3109/09286586.2013.809770
5. Elalamy I, Chakroun T, Gerotziafas GT, et al. Circulating platelet-leukocyte aggregates: a marker of microvascular injury in diabetic patients. Thromb Res. 2008;121(6):843–848. doi:10.1016/j.thromres.2007.07.016
6. Schneider H, Shaw J, Zimmet P. Guidelines for the detection of diabetes mellitus--diagnostic criteria and rationale for screening. Clin Biochem Rev. 2003;24(3):77–80.
7. Cowie CC, Rust KF, Byrd-Holt DD, et al. Prevalence of diabetes and impaired fasting glucose in adults in the U.S. population: national Health and Nutrition Examination Survey 1999–2002. Diabetes Care. 2006;29(6):1263–1268. doi:10.2337/dc06-0062
8. Antwi-Bafour S, Hammond S, Adjei JK, Kyeremeh R, Martin-Odoom A, Ekem I. A case-control study of prevalence of anemia among patients with type 2 diabetes. J Med Case Rep. 2016;10(1):1–8. doi:10.1186/s13256-016-0889-4
9. Lippi G, Mercadanti M, Aloe R, Targher G. Erythrocyte mechanical fragility is increased in patients with type 2 diabetes. Eur J Intern Med. 2012;23(2):150–153. doi:10.1016/j.ejim.2011.11.004
10. Ibanga IA, Usoro CA, Nsonwu AC. Glycaemic control in type 2 diabetics and the mean corpuscular fragility. Niger J Med. 2005;14(3):304–306.
11. Priyadarshini KH, Latha PA, Pradnya S, Juhi A, Samatha P, Ratnam KM. Comparative study of erythrocyte fragility in diabetes mellitus and non diabetes mellitus. Int J Med Res Health Sci. 2015;4(1):183. doi:10.5958/2319-5886.2015.00029.6
12. Moussa S. Biophysical changes in red blood cells and hemoglobin components of diabetic patients. J Genet Eng Biotechnol. 2007;5(1–2):27–32.
13. Viskupicova J, Blaskovic D, Galiniak S, et al. Effect of high glucose concentrations on human erythrocytes in vitro. Redox Biol. 2015;5:381–387. doi:10.1016/j.redox.2015.06.011
14. Kung CM, Tseng ZL, Wang HL. Erythrocyte fragility increases with level of glycosylated hemoglobin in type 2 diabetic patients. Clin Hemorheol Microcirc. 2009;43(4):345–351. doi:10.3233/CH-2009-1245
15. Prakash A. Erythrocyte Fragility Increases With the Duration of Diabetes in Indian Population. Int J Basic Appl Med Sci. 2013;3(3):172–177.
16. Ehiaghe AF, Ehiaghe JI, Ifeanyichukwu OM, Isioma IA, Ize-Iyamu JA, Ize-Iyamu LO. Socio-economic status and hemoglobin concentration of type 2 diabetes mellitus patients attending diabetic clinic in Benin City, Nigeria. Open J Pathol. 2013;03(04):139–143. doi:10.4236/ojpathology.2013.34026
17. Almoznino-Sarafian D, Shteinshnaider M, Tzur I, et al. Anemia in diabetic patients at an internal medicine ward: clinical correlates and prognostic significance. Eur J Intern Med. 2010;21(2):91–96. doi:10.1016/j.ejim.2009.12.002
18. Whiting DR, Guariguata L, Weil C, Shaw J. IDF Diabetes Atlas: global estimates of the prevalence of diabetes for 2011 and 2030. Diabet Res Clin Pract. 2011;94(3):311–321. doi:10.1016/j.diabres.2011.10.029
19. Forouhi NG, Wareham NJ. Epidemiology of diabetes. Medicine. 2014;42(12):698–702. doi:10.1016/j.mpmed.2014.09.007
20. Nandeshwar S, Jamra V, Pal DK. Indian diabetes risk score for screening of undiagnosed diabetic subjects of Bhopal city. Natl J Commun Med. 2010;1(2):176–177.
21. Centers for Disease Control and Prevention. National Diabetes Statistics Report: estimates of diabetes and its burden in the United States. US Department of Health and Human Services; 2014.
22. Pape JA. When” tired blood” is slowing you down. Diabetes Self Manag. 2011;28(2):35.
23. Fayed HM, Elsaied ARA, Alsenbesy MA, Moubark IA. Proportion of anemia in type 2 diabetic patients in qena governorate case--control study: clinical correlates and prognostic significance. Int J Diabetes Res. 2013;2(4):64–75. doi:10.5923/j.diabetes.20130204.02
24. Alam MJ, Mallik SC, Nur-E-Taj M, et al. a comparative analysis of biochemical and hematological parameters in diabetic and non-diabetic adults. Adv Med Sci. 2015;2(21):1–9.
25. Selvin E, Steffes MW, Zhu H, et al. Glycated hemoglobin, diabetes, and cardiovascular risk in non-diabetic adults. N Engl J Med. 2010;362(9):800–811. doi:10.1056/NEJMoa0908359
26. Singh DK, Winocour P, Farrington K. Erythropoietic stress and anemia in diabetes mellitus. Nat Rev Endocrinol. 2009;5(4):204–210. doi:10.1038/nrendo.2009.17
27. Akter S, Rahman MM, Abe SK, Sultana P. Prevalence of diabetes and prediabetes and their risk factors among Bangladeshi adults: a nationwide survey. Bull World Health Organ. 2014;92(3):204–213A. doi:10.2471/blt.13.128371
28. Rownak N, Akhter S, Khatun M, et al. Study of osmotic fragility status of red blood cell in type II diabetes mellitus patients. Eur J EnvironPublic Health. 2017;1(2):1–7.
29. Chen LK, Lin MH, Chen ZJ, Hwang SJ, Chiou ST. Association of insulin resistance and hematologic parameters: study of a middle-aged and elderly Chinese population in Taiwan. J Chin Med Assoc. 2006;69(6):248–253. doi:10.1016/S1726-4901(09)70251-5
30. Malandrino N, Wu WC, Taveira TH, Whitlatch HB, Smith RJ. Association between red blood cell distribution width and macrovascular and microvascular complications in diabetes. Diabetologia. 2012;55(1):226–235. doi:10.1007/s00125-011-2331-1
31. Zhang D, Zhang S, Wang L, Pan T, Zhong X. The relationship between red blood cell distribution and islet β-cell function indexes in patients with type 2 diabetes. BMC Endocr Disord. 2021;21(1):185–189. doi:10.1186/s12902-020-00668-4
32. Akinsegun A, Olusola DA, Sarah JO, et al. Mean platelet volume and platelet counts in type 2 Diabetes: mellitus on treatment and non-diabetic mellitus controls in Lagos, Nigeria. Pan Afr Med J. 2014;18. doi:10.11604/pamj.2014.18.42.3651
33. Schneider DJ. Factors contributing to increased platelet reactivity in people with diabetes. Diabetes Care. 2009;32(4):525–527. doi:10.2337/dc08-1865
34. Biadgo B, Melku M, Abebe SM, Abebe M. Hematological indices and their correlation with fasting blood glucose level and anthropometric measurements in type 2 diabetes mellitus patients in Gondar, Northwest Ethiopia. Diabetes Metab Syndr Obes. 2016;9:91–99. doi:10.2147/DMSO.S97563
35. Chung F-M, Tsai JC-R, Chang D-M, Shin S-J, Lee Y-J. Peripheral total and differential leukocyte count in diabetic nephropathy: the relationship of plasma leptin to leukocytosis. Diabetes Care. 2005;28(7):1710–1717. doi:10.2337/diacare.28.7.1710
36. Vozarova B, Stefan N, Lindsay RS, et al. High alanine aminotransferase is associated with decreased hepatic insulin sensitivity and predicts the development of type 2 diabetes. Diabetes. 2002;51(6):1889–1895. doi:10.2337/diabetes.51.6.1889
37. Moradi S, Kerman SRJ, Rohani F, Salari F. Association between diabetes complications and leukocyte counts in Iranian patients. J Inflamm Res. 2012;5:7. doi:10.2147/JIR.S26917
38. Karthikeyan VJ, Lip GYH. White blood cell count and hypertension. J Hum Hypertens. 2006;20(5):310–312. doi:10.1038/sj.jhh.1001980
39. Renoux C, Faivre M, Bessaa A, et al. Impact of surface-area-to-volume ratio, internal viscosity and membrane viscoelasticity on red blood cell deformability measured in isotonic condition. Sci Rep. 2019;9(1):1–7. doi:10.1038/s41598-019-43200-y
40. Ahmed A, Hussein A, Haider S. Red blood cells fragility among Sudanese patients with type 2 diabetic mellitus. Progress Med Sci. 2020;5(1):1–4. doi:10.5455/pms.20201008
 © 2024 The Author(s). This work is published and licensed by Dove Medical Press Limited. The full terms of this license are available at https://www.dovepress.com/terms.php and incorporate the Creative Commons Attribution - Non Commercial (unported, v3.0) License.
By accessing the work you hereby accept the Terms. Non-commercial uses of the work are permitted without any further permission from Dove Medical Press Limited, provided the work is properly attributed. For permission for commercial use of this work, please see paragraphs 4.2 and 5 of our Terms.
© 2024 The Author(s). This work is published and licensed by Dove Medical Press Limited. The full terms of this license are available at https://www.dovepress.com/terms.php and incorporate the Creative Commons Attribution - Non Commercial (unported, v3.0) License.
By accessing the work you hereby accept the Terms. Non-commercial uses of the work are permitted without any further permission from Dove Medical Press Limited, provided the work is properly attributed. For permission for commercial use of this work, please see paragraphs 4.2 and 5 of our Terms.