")
Back to Journals » Journal of Blood Medicine » Volume 14
Assessment of Hematological Profiles and Prognostic Role of Hemogram-Derived Novel Markers for Diabetes Mellitus and Its Complications Among Type 2 Diabetes Mellitus Adult Patients Attending Bishoftu General Hospital, Central, Ethiopia: A Comparative Cross-Sectional Study
Authors Regassa DA , Kiya GT , Kebede RA, Beyene W
Received 15 August 2023
Accepted for publication 21 December 2023
Published 28 December 2023 Volume 2023:14 Pages 681—699
DOI https://doi.org/10.2147/JBM.S435452
Checked for plagiarism Yes
Review by Single anonymous peer review
Peer reviewer comments 2
Editor who approved publication: Dr Martin H Bluth
Dereje Abebe Regassa,1 Girum Tesfaye Kiya,2 Regassa Alemu Kebede,2 Woyesa Beyene3
1Department of Medical Laboratory Science, Wolkite University, Wolkite, Ethiopia; 2School of Medical Laboratory Sciences, Jimma University, Jimma, Ethiopia; 3Department of Medical Laboratory Science, Dire Dawa University, Dire Dawa, Ethiopia
Correspondence: Dereje Abebe Regassa, Department of Medical Laboratory Science, Wolkite University, PO.Box 07, Wolkite, Ethiopia, Tel +251933864800 ; +251903036210, Email [email protected]; [email protected]
Background: Diabetes is a chronic metabolic syndrome that is a global public health problem. Studies have used hematological parameters and hemogram-derived markers as predictors of poor glycemic and microvascular complications status in diabetics. However, the tendency to use these parameters is not fully evaluated in our context, and the evidence is inadequate. This study aimed to assess the hematological profiles and prognostic role of hemogram-derived novel markers in diabetes mellitus and its complications among DM patients at Bishoftu General Hospital, Ethiopia.
Methods: A comparative cross-sectional study was conducted among 261 participants from June 15 to August 12, 2022. A systematic random sampling technique was used to select participants. Data were collected using structured questionnaires, physical measurements, checklists, and laboratory tests. Hematological parameters and fasting blood glucose levels were determined from blood using Sysmex-XN550 and Cobas C311 analyzers, respectively. Blood smear was used to check Hematology analyzer output, and to screen participants for malaria parasites. Collected data were entered into Epi-data 3.1 and exported to SPSS-25. Data were analyzed by Chi-square, Mann–Whitney U-test, Kruskal–Wallis test, Post hoc test, and ROC curve. A P-value < 0.05 was considered statistically significant.
Results: Total WBC, neutrophils, Monocyte, NLR, MLR, MPVLR, and PLR were significantly higher in poor glycemic and complicated T2DM; meanwhile, measured RBC parameters, RBC indices values were significantly lower in poor glycemic and complicated T2DM. The NLR, MLR, MPVLR, PLR, and NLR, MLR, MPVLR, RPR values were identified as predictors of poor glycemic and complication status in diabetic patients, respectively.
Conclusion: Significant increment of some hematological parameters and hemogram-derived markers, and their role in predicting poor glycemic and microvascular complications were identified in diabetic patients. Routine screening of hematological parameters and use of hemogram-derived markers for monitoring of altered health status in DM is very important in the improvement of patient quality of life.
Keywords: hematological parameters, hemogram-derived markers, type 2 diabetes, Ethiopia
Introduction
Diabetes mellitus is a metabolic disorder that is chronic and progressive, caused by a variety of etiologies and characterized by persistent hyperglycemia.1 Diabetes mellitus is usually classified into type 1 and type 2 diabetes mellitus; gestational diabetes and other set types of diabetes.1–3
Type 2 diabetes is predominant, accountng for over 90% of cases worldwide.1,2 Globally, the prevalence of diabetes mellitus increased five-fold from 108 million in 1980 to 537 million in 2021.3,4 About 73 million people in the Middle East and North Africa and 24 million people in Sub-Saharan Africa have diabetes.4 According to IDF, the highest diabetes prevalence in 2021 was reported in Pakistan (30.8%), France (25.2%), Kuwait (24.9%), and Egypt 20.9%.4 Diabetes is also prevalent in Ethiopia, with a pooled prevalence of approximately 6.5%; about 3.3% of adults have diabetes.4,5
About 541 million people of working age are at risk of developing type 2 diabetes. Diabetes is more common in urban than rural areas, and its prevalence is expected to be higher in middle-income countries compared with high- or low-income nations from 2021 to 2045.4
Global health-care costs due to diabetes increased from US$232 billion in 2007 to US$966 in 2021.4 Expenditures in sub-Saharan Africa are estimated to be US$67.03 billion annually, and diabetes-related spending is estimated to be US$7 trillion by 2025.6 About 7,108,145 deaths were recorded as shown by the (WHO) Mortality Database from diabetes complications collected in 108 countries from 2000 to 2016.7
Hyperglycemia mediates the excessive production of reactive oxygen and nitrogen species; the imbalance of production and removal mechanism of these reactive species causes vascular dysfunction, and damage to cellular proteins, membrane lipids, and nucleic acids.8 These can lead to macrovascular problems such as heart disease, stroke, and peripheral artery disease, and microvascular complications such as neuropathy, nephropathy, and retinopathy.9 Comorbidities shared in type 2 diabetic patients are hypertension, obesity, hyperlipidemia cardiovascular disease, chronic renal disease, and hematological disorders.10 Among hematological disorders, anemia frequently coincides with blood disorders with diabetes mellitus. There are multifaceted factors that prime diabetic patients to be anemic.9,11
Chronic inflammation in diabetic mellitus patients causes WBC count to be elevated, which leads to diabetic macro- and microvascular complications.11 The platelet-to-lymphocyte ratio (PLR), monocyte-to-lymphocyte ratio (MLR), mean platelet volume to lymphocyte ratio, and neutrophil-to-lymphocyte ratio (NLR) are also identified as potential markers of inflammation in various conditions, including tumors, cardiovascular conditions,12,13 and other diseases.14
Diabetic vascular complications also result in the alteration of platelet morphology and functions.9,11 In response to hyperglycemia, the neutrophil-derived S100 calcium-binding protein interacts with (RAGE) receptors, causing an increased level of IL-6, which results in thrombocytosis.15 Early prophecy of DM-related hyperglycemia and complications risk is very important for the well-being of diabetes patients and for preventing cardiovascular disease, slowing disease progression, and reducing mortality and morbidity.3,4
Therefore, finding and using accessible, reliable, and inexpensive predictors from laboratory reports for early prevention and control of diabetes-related hyperglycemia and microvascular complications, especially in developing countries such as Ethiopia with constrained assets is very important. Hemogram indices such as mean corpuscular hemoglobin (MCH), mean corpuscular hemoglobin concentration (MCHC), Mean corpuscular volume (MCV), Red cell distribution width (RDW), Mean platelet volume (MPV), platelet distribution width (PDW), platelet crit (PCT), P-LCR (platelet larger cell ratio) are useful tools for monitoring diabetes mellitus and could be used as possible indicators of its complications.11
Besides, hemogram indices, hemogram-derived novel markers are conceived as tools in DM monitoring and as prospective forecasters of diabetes-related hyperglycemia and complications. Those hemogram-derived novel markers include Neutrophil-Lymphocyte ratio (NLR), Monocyte-Lymphocyte ratio (MLR), Red cell distribution width-platelet count ratio (RPR), Mean Platelet Volume to Lymphocyte Ratio (MPVLR), Platelet-Lymphocyte ratio (PLR), all of which can be used as predictive and prognostic markers in diabetes and its complications.12–14,16
To date, only limited articles have studied the association between diabetic microvascular complications and the PLR, NLR, and MLR.17–22 Besides, a study done in Turkey reporting on MPVLR states that it can predict diabetic complications.23 Even though studies were conducted on the relationship between some hemogram-derived and DM, their findings are inconsistent. The associations of the RPR and MPVLR with DM-related poor glycemic control and complications are under investigation worldwide.
Though determination of hematological profile status and assessment of hemogram-derived markers have greceived boundless attention in the monitoring of diabetic patients because they have a fast prognostic role for diabetic poor glycemic control status and vascular complications in a simple, rapid, and inexpensive manner, to the best of our knowledge, no published article deals with the role of hemogram-derived markers with DM-related hyperglycemia and microvascular complications in our perspective.
Therefore, this study aimed to assess the hematological profile and determine the prognostic role of hemogram-derived markers for the prediction of DM-related hyperglycemia and microvascular complication status in type 2 diabetic patients in comparison with healthy controls attending Bishoftu General Hospital, central Ethiopia.
Methods and Materials
Study Design, Area, and Period
A hospital-based comparative cross-sectional study was conducted at Bishoftu General Hospital from June 15 to August 12, 2022. Bishoftu General Hospital is one of the hospitals in Oromia Regional State (ORS) and is located in Bishoftu town, 47 kilometers to the southeast of Addis Ababa. The town lies at an altitude of 1950 meters above sea level, at 9°N latitude and 40°E longitude.24 There are two public hospitals, five health centers, two private hospitals, and ten private clinics, serving people in the catchment from preventive, basic curative to advanced medical services.
Bishoftu General Hospital was established in 1948 and currently serves approximately 1.2 million people with a variety of services.25 The hospital offers chronic care, emergency services, ART services, surgical, dental, medical services, ophthalmology, pediatrics, gynecology and obstetrics, radiology, physiotherapy, Pathology services, pharmacy, laboratory, and other services. This study was conducted in the central laboratory of Bishoftu General Hospital which provides hematology and immunohematology, parasitology, microbiology, clinical chemistry, and serology services.
Study Population, Inclusion, and Exclusion Criteria
All adult patients already diagnosed with type 2 diabetes mellitus and who are on follow-up at the chronic care clinic of Bishoftu General Hospital were included in this study. Besides, all age and sex-matched healthy non-diabetic individuals who came to Bishoftu General Hospital during the study period for medical checkups, patient attendants were also included as the control group in this study.
To alleviate the impact of the confounding factors, based on information acquired from a medical record, interview of study participants, and through physicians’ communication, the type 2 diabetic patients already diagnosed with chronic diseases such as renal failure, liver disease, hematological malignancy, patients with a history of infectious diseases such as HIV/AIDS, HBV, HCV, malarial infection, asthmatic, rheumatoid arthritis, patients who were severely ill, on anticoagulant therapy, on antiplatelet drugs, pregnant mothers, smokers, alcoholics, anemic patients, and those patients whose ages were below 15 and above 65 years old were not engaged in this study. In addition, the health condition of each control group was assessed, and individuals who had a history of malarial infection in the past two months, whose C-reactive Ab test was positive, smokers, and alcoholics were also excluded from this study.
Sample Size and Sampling Technique
The sample size was determined based on the two population mean formula using G-power software version 3.1. During sample size determination the 95% CI (2-tailed, α=0.05), 80% power, a ratio of the control to case 1:1, a computed effect size (d) of 0.45, and 10% of non-respondents rate was considered. The mean and standard deviation (X±SD) of MPV for DM patients and control groups were taken from a study,26 [10.4±1.1] for type 2 diabetes, and [9.9±1.1] for controls. To increase accuracy, the rule of thumb of Van Voorhis and Morgan27 was used, and the determined sample size for T2DM was 174 (about 87 were poor glycemic control group, and 87 were good glycemic control group), and about 87 were healthy control group, and we had a total of 261 participants for this study.
Study participants were selected using a systematic random sampling method based on the order of follow-up visits attended. The sampling interval (the kth value) was obtained by dividing the estimated total number of the source population by the sample size (approximately 7). The hospital report per quarter estimated the number of people with type 2 diabetes at follow-up was 1260, and the calculated sample size for the cases was 174. Then, the kth value was =1260/174=7, and the first participant was selected by lottery method by writing the medical record numbers of the first seven participants on a separate piece of paper, and thereby the individual who came on the second number was selected as the first participant. Subsequently, patients with type 2 diabetes mellitus were interviewed face-to-face in between the service at every seven intervals of the order of visit.
Data Collection Procedure and Laboratory Methods
A total of 261 study participants from two groups were recruited for this study. The first group included 174 T2DM patients and the second group was 87 non-diabetic healthy controls. Based on the ADA-201728 criteria, the 174 T2DM study subjects were sub-grouped into 87 poor glycemic control type 2 diabetes mellitus group (whose FBG level >130 mg/dl with the conjunction of their worse clinical history), and the remaining 87 were good glycemic control type 2 diabetic patients (whose FBG level was 80 mg/dl to 130 mg/dl and their clinical histories were also good).
Checklists were used to extract clinical characteristics such as duration of DM illness, presence or absence of microvascular complications, type of oral hypoglycemic drugs, and fasting blood glucose levels in the last 2 months from patients’ history on medical records (Supplementary Material 1). Diabetic patients fasting blood glucose readings for at least 3 months including the current reading were used for computing the average blood glucose level.
After the participants took a rest for more than 5 minutes, blood pressure (BP) measurement was taken from the upper arm of the left hand at the heart level by sphygmomanometer and stethoscope analogs twice simultaneously within 2-minute intervals, and reported by millimeter mercury (mmHg). For the participants whose BP difference was greater than 5 mmHg the BP measurement procedures were repeated. The stadiometer and weighing scale were used for the measurement of height (to the nearest 0.1 centimeters without shoes), weight (to the nearest 0.1 kg) without shoes, and wearing very light clothing; then BMI was computed by dividing the weight in kilograms by height in meters squared.
Waist circumference (WC) was measured with a non-stretchable tape at the midway between the least palpable inferior margin of the rib and the iliac crest in the participant’s normal exhaled state. The hip circumference (HC) was also measured using the same tape around the widest portion of the buttocks, and then the waist-to-hip ratio (WHR) was computed by dividing WC in centimeters by HC. All anthropometric measurements were performed by trained clinical nurses according to the WHO anthropometric protocol. Anthropometric and blood pressure measurements were performed twice and the mean values were used for analysis.
After an interview (see Supplementary Material 2 and Supplementary Material 3), record review, and anthropometric and blood pressure measurements taken by a trained clinical nurse, study subjects were sent to the central laboratory of Bishoftu Hospital, and then the vein of the antecubital fossa of the forearm was disinfected with 70% alcohol, and a tourniquet was applied as needed, then the required amount of blood was collected. A total of 5 mL venous blood sample was collected by vacutainer methods from each T2DM patient by a trained laboratory technologist in two different tubes; 3 mL of blood sample was taken into a K2-EDTA test tube for hematological parameters determination, blood smear preparation, and 2 mL into sodium fluoride test tube for glucose analysis.
The blood sample collected in a serum separator tube stayed for 15 minutes at room temperature; then serum was separated by centrifugation at 3600 rpm for 3 minutes using a Sorvall-ST-16 centrifuge, and the glucose level was determined. With the same procedure and precaution, 3 mL of venous blood was collected into a K2-EDTA test tube from each control participant for determination of hematological parameters, blood smear preparation, and C-reactive protein Ab test. A C-reactive protein test is a blood test used to measure the amount of CRP in the blood. This test was used to screen the inflammatory status of control groups and we use this test result as inclusion or exclusion criteria. We used the qualitative C-reactive protein test which is based on a latex agglutination principle that gives a positive or negative result.
Fasting blood glucose was determined from the serum sample prepared from an organ test tube by Cobas C311 (Roche system, Germany) following the photometric analysis principle, detecting glucose level in serum spectrophotometrically at 340 nm.29 A five differential automated hematological analyzer Sysmex XN550 (Sysmex, Germany) which works by the combination of hydrodynamically focused impedance measurement for RBC and platelet count, flow cytometer method for WBC differential count and photometric principle for hemoglobin determination was used.30
Thin blood film was prepared, labeled, air-dried, and then stained by Wright stain to recheck the hematological parameters output of the hematological analyzer and to evaluate the morphology of blood cells, and it was also used to screen participants for malarial agents. Fasting blood glucose level, smear preparation and diagnosis, and hematological parameters determination were done at the central laboratory of Bishoftu General Hospital, and the result of each study participant was printed and attached to the request paper and recorded using laboratory result registration format.
Data Quality Assurance and Management
To ensure the quality of data, questionnaires and informed consent forms written in English were translated into the local language Afaan Oromo and Amharic, and retranslated into English for accuracy and consistency. Before the actual data collection, questionnaires were pretested on 5% of the total sample size (13 subjects who met the eligibility criteria) at Mojo General Hospital, which is located in East Shewa, Mojo town. Half-day training was given for four data collectors (two clinical nurses and two laboratory technologists), on study objectives, data collection procedures, and confidentiality of collected information to reduce technical and observation bias.
To maintain the quality of the socio-demographic, anthropometric, and clinical data, daily completeness and consistency were checked by on-site supervision of the data collectors during the study period. A code was used to maintain the confidentiality of study participants’ test results, and records were kept in a secret, inaccessible place. Feedback and corrections were provided as needed based on the daily data collection process.
The manufacturers’ instructions and standard operating procedures were followed during specimen collection, CBC analysis, fasting blood glucose determination, and blood film preparation and examination to maintain the quality of laboratory data. Thus, to avoid post-collection hemolysis, the blood sample was dispensed to the walls of a K2-EDTA test tube, gently inverted 8–10 times to mix properly, and hematological parameters were determined. The RBC morphology was critically observed under a microscope by using Wright-stained thin blood film and morphological classification of anemia was done.
Acceptance criteria of samples such as non-hemolysis, non-clotting, adequate sample volume, and sample collection criteria were critically followed. To avoid mix-up after collection, labeling was done on the sample holder and the request paper with the same identification code. Based on the Hospital laboratory protocol, low, normal, and high control materials were used for the hematology analyzer. Normal and pathological control materials were performed for the Cobas C311 analyzer when measuring glucose. Background readings were obtained daily to reduce background carryover effects. Reagent expiration dates were checked before the analysis of patient samples. All laboratory assays were analyzed within 2 hours of sample collection, all laboratory test results were recorded and reported and samples were properly managed.
Statistical Data Analysis and Interpretations
Collected data were checked for completeness and consistency, entered into Epi-Data version 3.1 (Epi-Data Association, Denmark), and analyzed using Statistical Package for Social Sciences (SPSS) software version 25 (IBM SPSS Statistics, USA). Histograms and the Kolmogorov–Smirnov test were used to check the normality of the data distribution. Results for categorical variables were reported in frequency and percentage. For these categorical variables, statistical differences were checked by the chi-square test.
Continuous parameters were not normally distributed in the goodness-of-fit model test. Therefore, descriptive analyses were reported as median (interquartile range (IQR)). Mann–Whitney U-test and Kruskal–Wallis analysis were done to compare hematological parameters and hemogram-derived marker values between groups. The Kruskal–Wallis test comparison-wise and post-hoc were used to compare the values of hematological parameters and hemogram-derived markers between the three groups. The receiver operating characteristic curve (ROC) was constructed to determine the sensitivity, specificity, cutoff value, Area under the curve, PPV, and NPV of hemogram-derived new markers for distinguishing the poor glycemic control from good glycemic control status and the discrimination ability of these parameters for vascular complication from non-complication status in diabetic patients. A P-value <0.05 was considered statistically significant.
Results
Socio-Demographic Characteristics of the Study Participants
Sociodemographic data showed that type 2 diabetic patients with poor or good glycemic control and healthy control study groups did not differ significantly in terms of age, sex, residence, marital status, and monthly income (p>0.05). The median (IQR) of age in T2DM with poor glycemic control was 33,28–40 good glycemic control was 32 (27–37%) and in healthy controls was 3127–38 (p=0.82). Most of the study participants were males, about 70 (80.5%) were from type 2 diabetes mellitus with uncontrolled glycemic control group, 69 (99.3%) were type 2 diabetes mellitus with glycemic controlled T2DM, and 66 (75.9%) were from healthy control group. However, those groups were different regarding their educational status and occupational status (p<0.05) (Table 1).
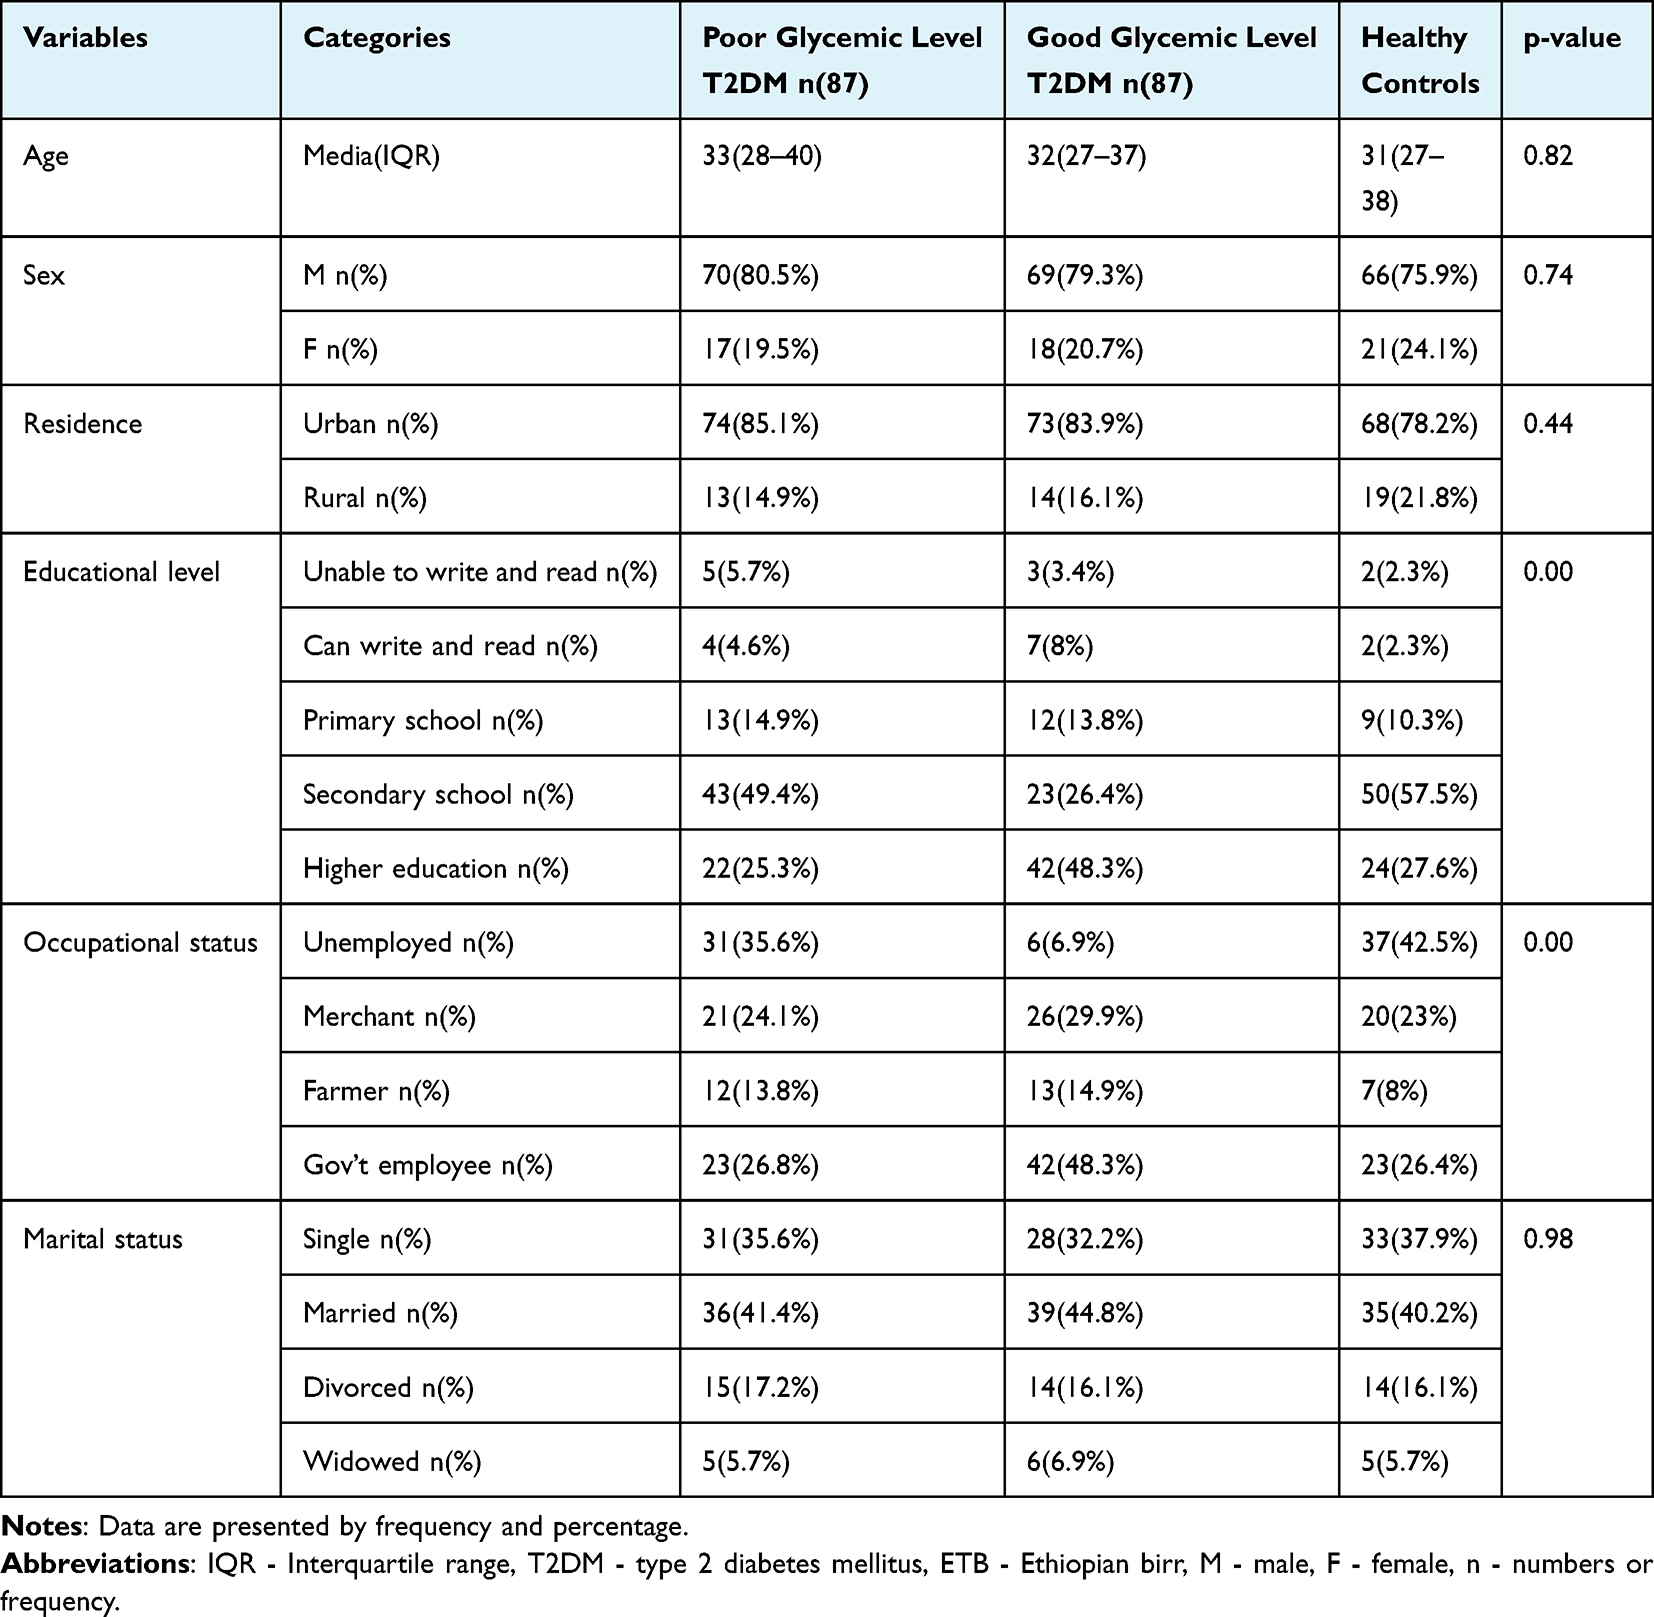 |
Table 1 Socio-Demographic Characteristics of Study Participants at Bishoftu General Hospital, Central Ethiopia, from June 15 to August 12, 2022 (n=261) |
The Anthropometric and Clinical Characteristics of Study Participants
Regarding the anthropometric and clinical characteristics of the study participants, there were statistically significant differences between groups concerning BMI, WHR, SBP, and DBP (p<0.001) and for WC (p=0.003). The FBG level in poor glycemic control was higher than in good glycemic-controlled T2DM patients (p<0.001). Among type 2 diabetic patients with uncontrolled glycemic levels, about 45 (51.7%) experienced at least one type of microvascular complication, and about 46 (52.9%) of diabetes patients with poor glucoregulation and 43 (49.4%) of diabetes patients with good glucoregulation had received oral metformin therapy (Table 2).
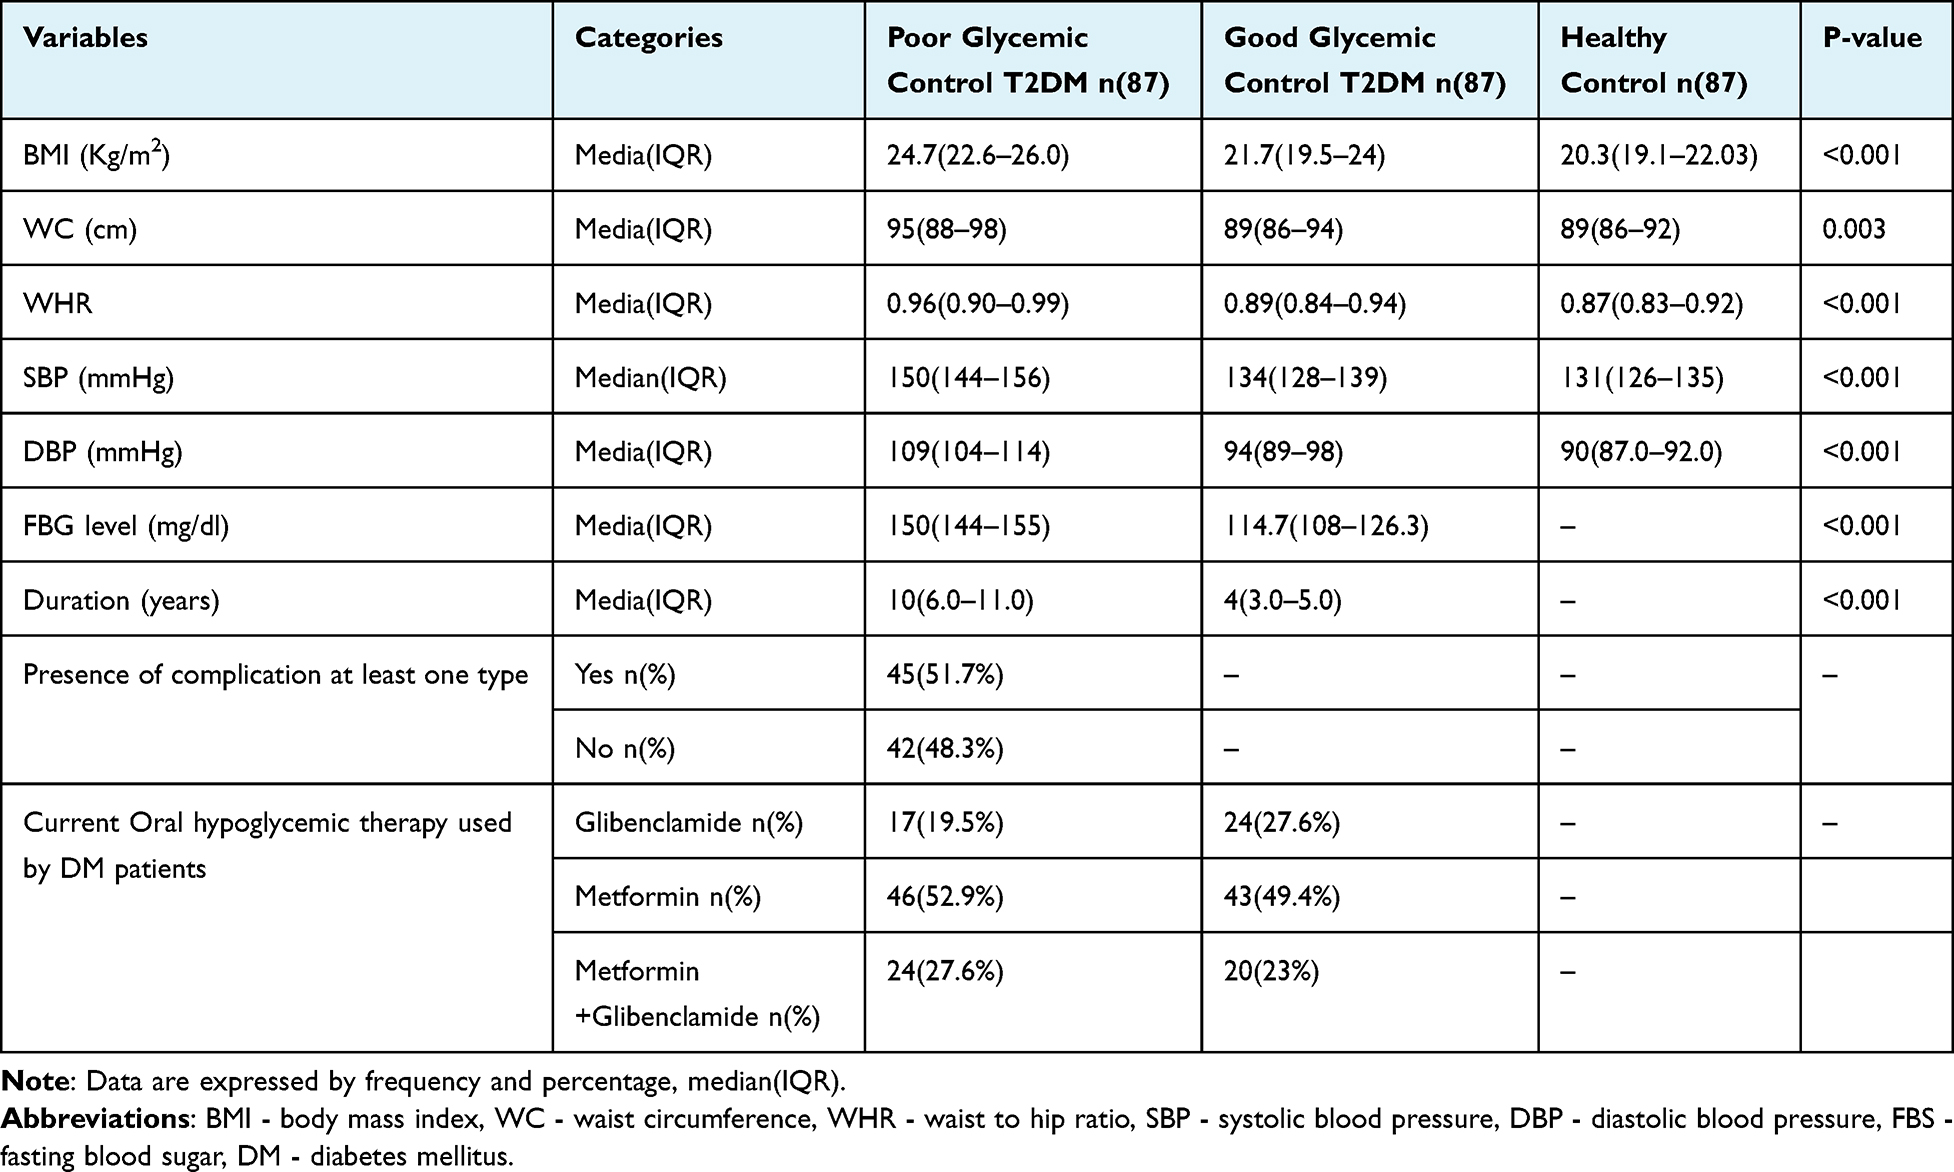 |
Table 2 Anthropometric and Clinical Characteristics Distribution of Study Participants at Bishoftu General Hospital, Central Ethiopia, from June 15 to August 12, 2022 (n=261) |
Distribution of Anemia Based on the Severity Among Type 2 Diabetic Patients Attending Bishoftu Hospital, Oromia, Central Ethiopia, from June 15 to August 12, 2022 (n=66)
The severity of anemia was assessed among poor and good glycemic control diabetic patients. Accordingly, among poor glycemic control about 60 patients were anemic of these 56.7%, 25.0% and 18.3% experienced moderate, mild, and severe anemia, respectively. Among good glycemic control, only 6 patients had anemia, of these about 50% and 50% experienced moderate and mild anemia, respectively (Figure 1).
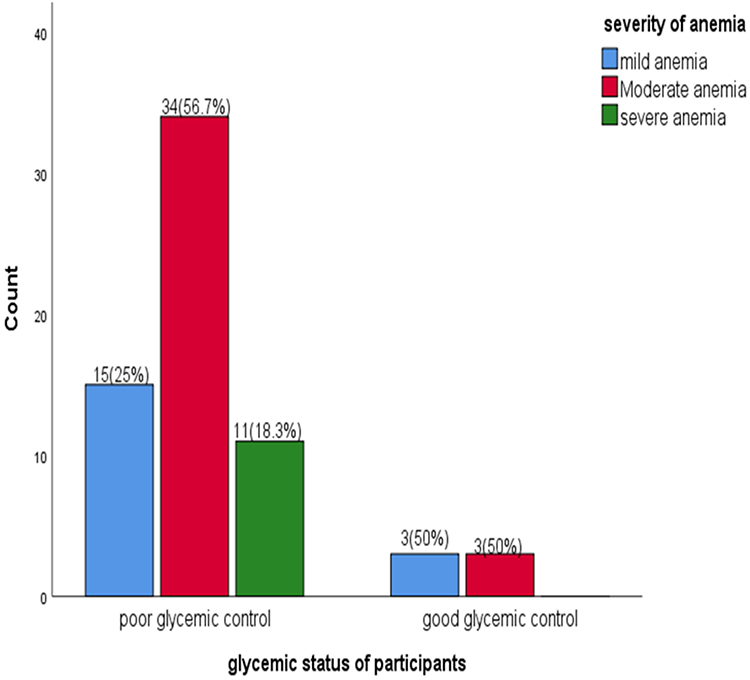 |
Figure 1 Distribution of anemia based on the severity among type 2 diabetic patients attending Bishoftu Hospital, Oromia, central Ethiopia, from June 15 to August 12, 2022. |
Distribution of Morphological Type of Anemia Among Type 2 Diabetic Patients Attending Bishoftu Hospital, Oromia, Central Ethiopia, from June 15 to August 12, 2022 (n=66)
The morphological classification of anemia was also assessed among poor and good glycemic control type 2 diabetic patients. In poor glycemic control about 60 patients were anemic with 31.7% normocytic normochromic and 68.3% microcytic hypochromic type of anemia, respectively. In good glycemic control type 2 diabetic patients about 83.3% and 16.7% of patients experienced normocytic normochromic and microcytic hypochromic morphological types of anemia, respectively (Figure 2).
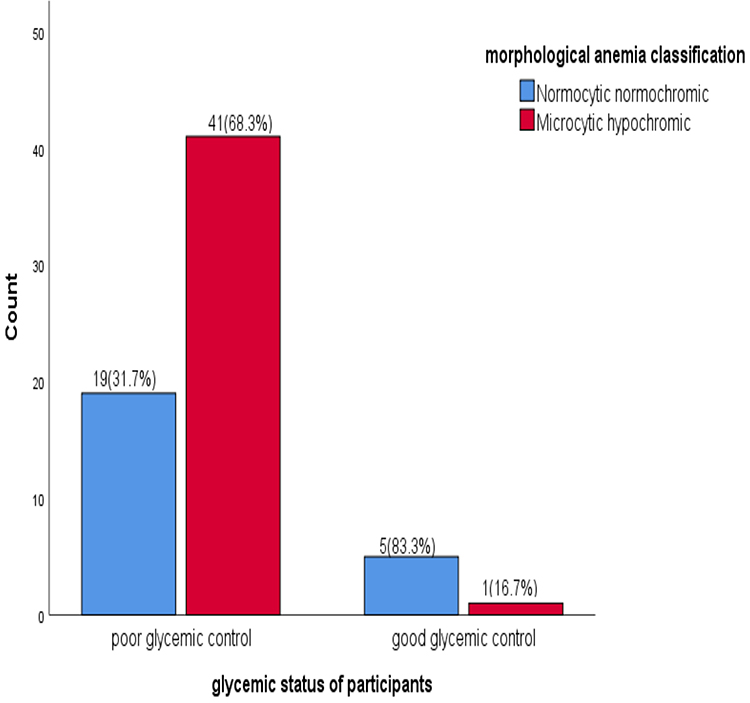 |
Figure 2 Distribution of morphological type of anemia among type 2 diabetic patients attending Bishoftu Hospital, Oromia, central Ethiopia, from June 15 to August 12, 2022. |
Determination of Hematological Parameters and Hemogram-Derived Novel Markers Among Participants
There was no significant difference between poor glucoregulation, good glucoregulation, and healthy control groups in terms of platelet count, red blood cell width standard deviation, absolute eosinophils count, absolute basophils count, Immunoglobulin levels, and red blood cell width to platelet count ratio according to the Kruskal–Wallis test (p>0.05).
The Kruskal–Wallis and post hoc comparison pairwise test also showed that the red blood cell width coefficient variation, total white blood cells, absolute neutrophils count, mean platelet volume, absolute monocyte, neutrophils to lymphocyte ratio, monocyte to lymphocyte ratio, mean platelet volume to lymphocyte ratio and platelet count to lymphocyte ratio values were significantly higher in poor glycemic controls in type 2 diabetic patients than good glycemic controlled T2DM (P<0.001) (Table 3). However, absolute lymphocyte count, red blood cells, hemoglobin, hematocrit, mean cell volume, mean cell hemoglobin, and mean cell hemoglobin concentration level were significantly lower in type 2 diabetic patients with poor glycemic control than good glycemic controlled T2DM and healthy controls (p<0.001) (Table 3).
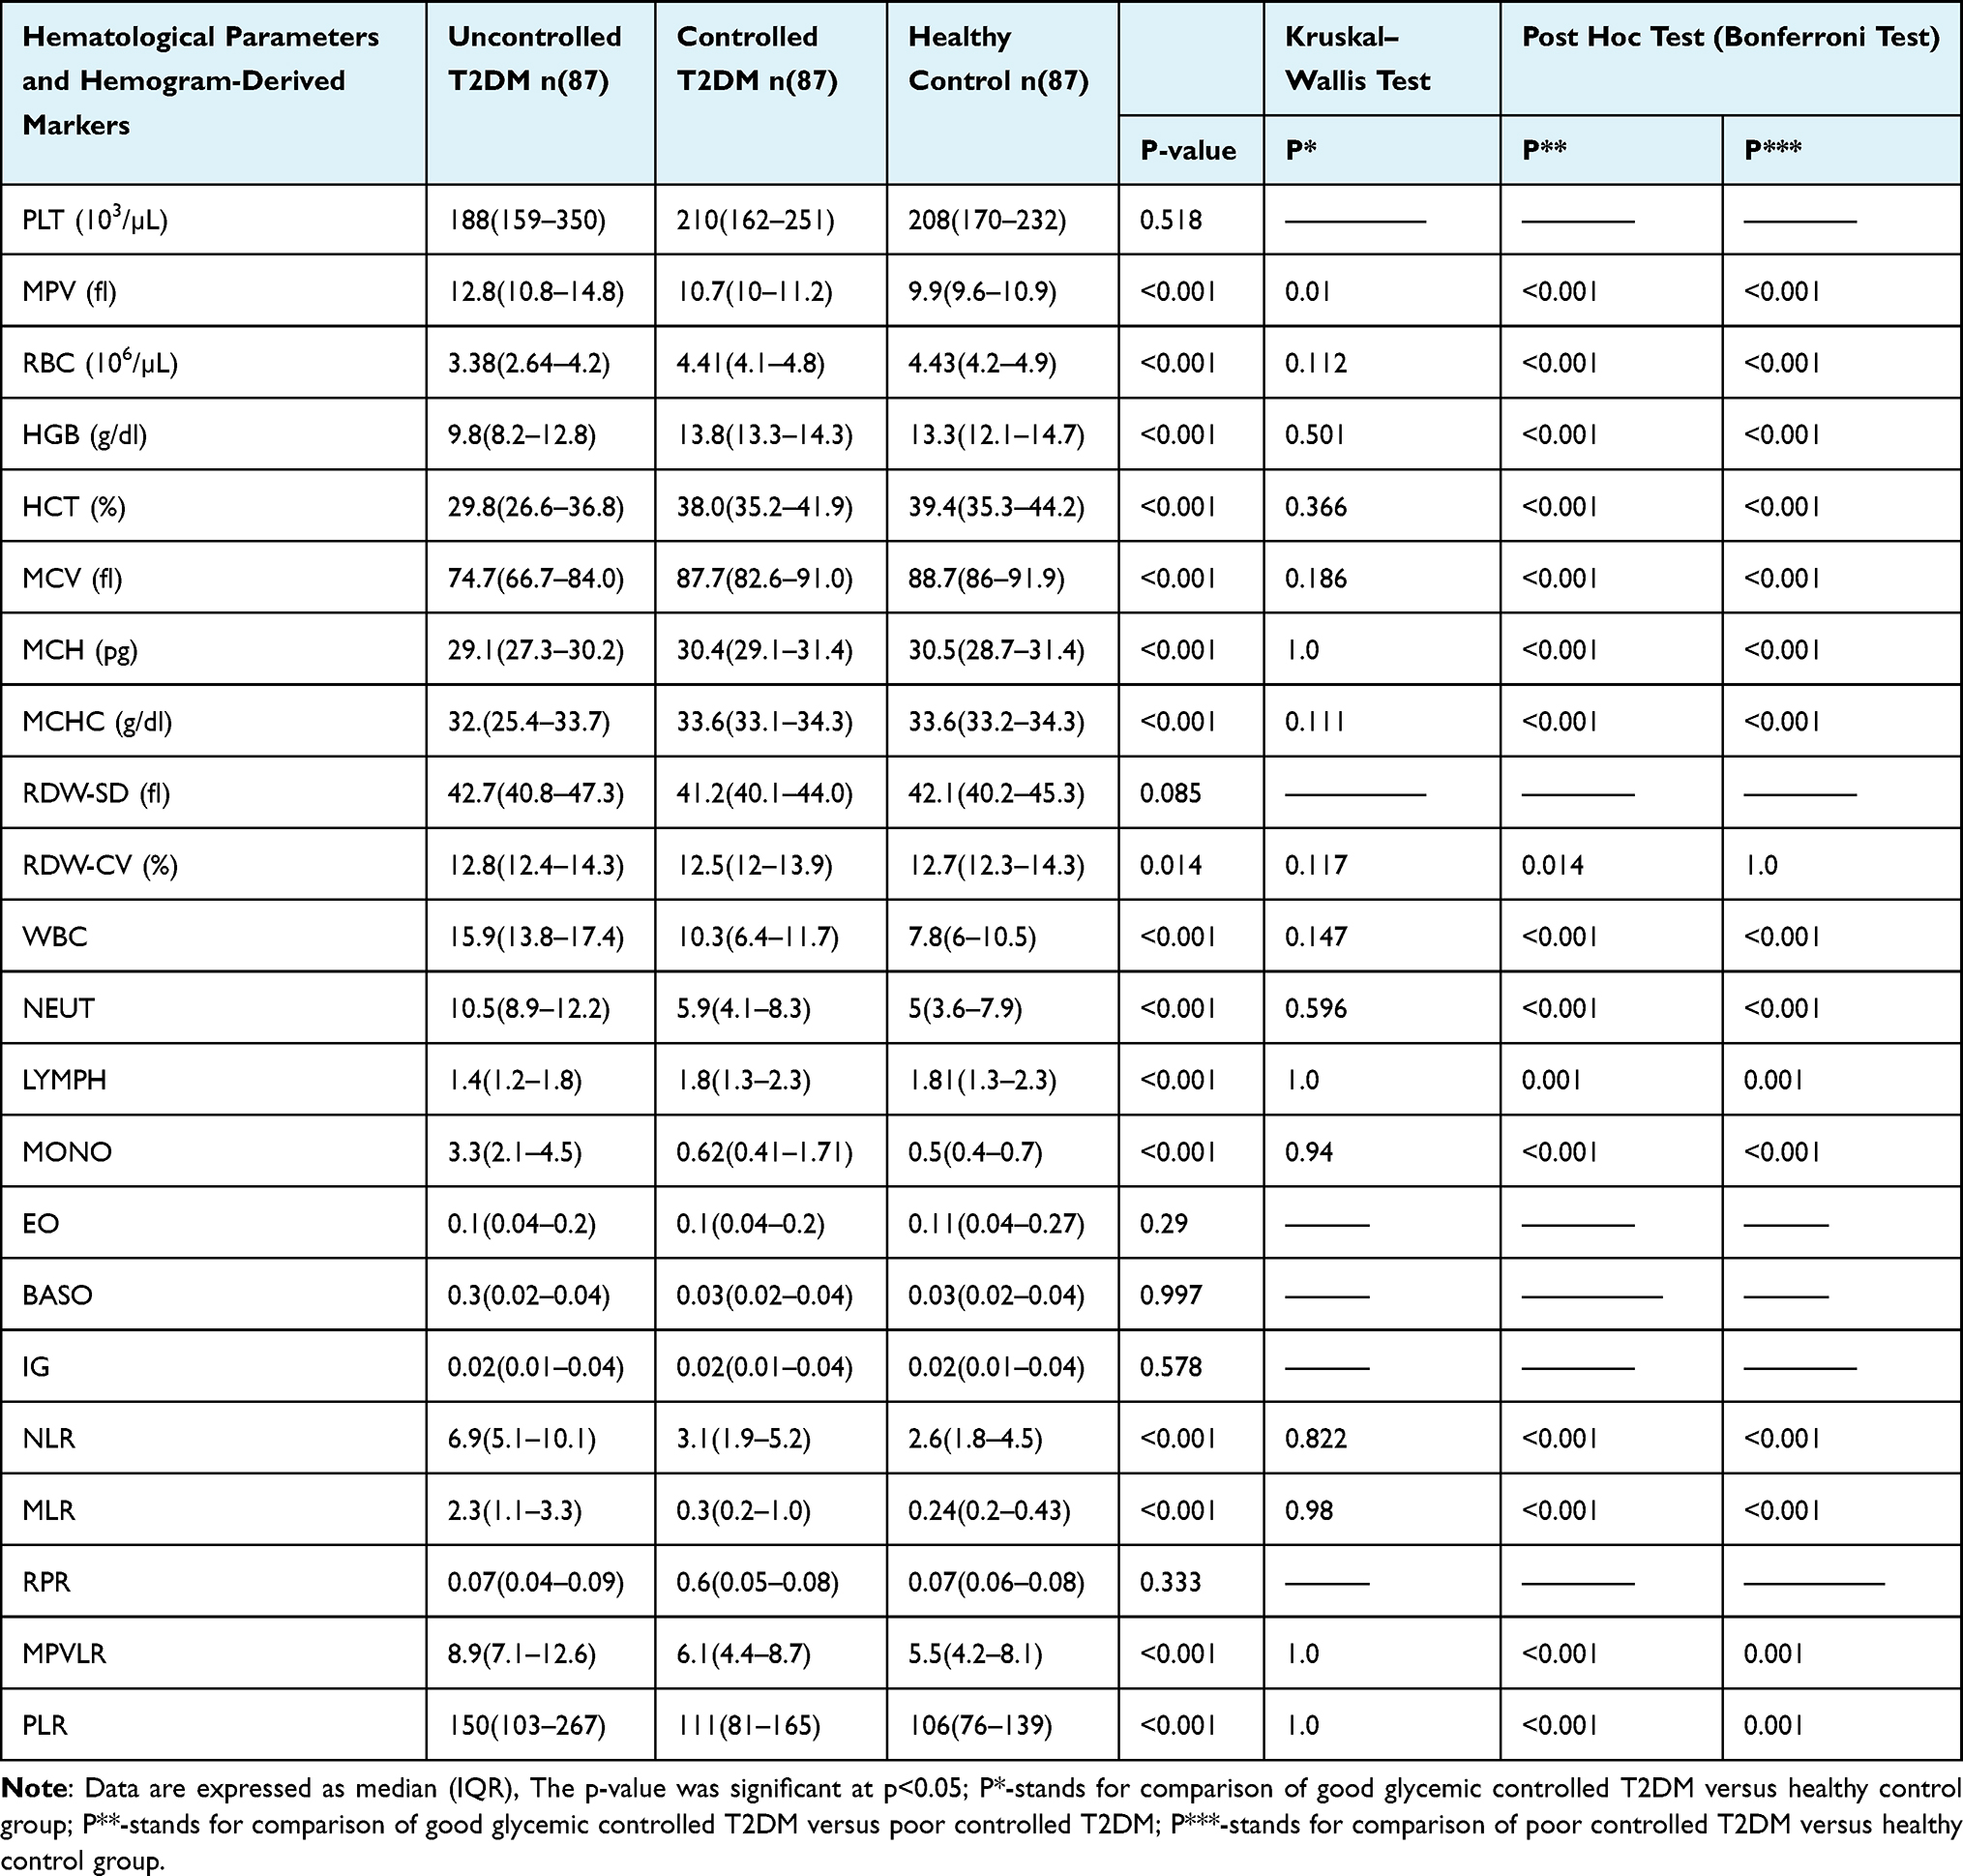 |
Table 3 Kruskal–Wallis and Post Hoc Pairwise Comparisons of Hematological Parameters and Hemogram Derived Novel Markers Between Poor Glycemic Controlled T2DM, Good Glycemic Controlled T2DM, and Healthy Controls at Bishoftu Hospital, Central Ethiopia, from June 15 to August 12, 2022 (n=261) |
Determination of Hematological Parameters and Hemogram-Derived Novel Markers Among T2DM with Microvascular Complication and T2DM Without Microvascular Complication Participants
The Mann–Whitney test showed that there was no significant difference between type 2 diabetics with microvascular complication and those without complication in diabetic patients in terms of red blood cells width standard deviation, absolute eosinophils count, absolute basophils count, Immunoglobulin levels and platelet count to lymphocyte count ratio (p>0.05) (Table 4).
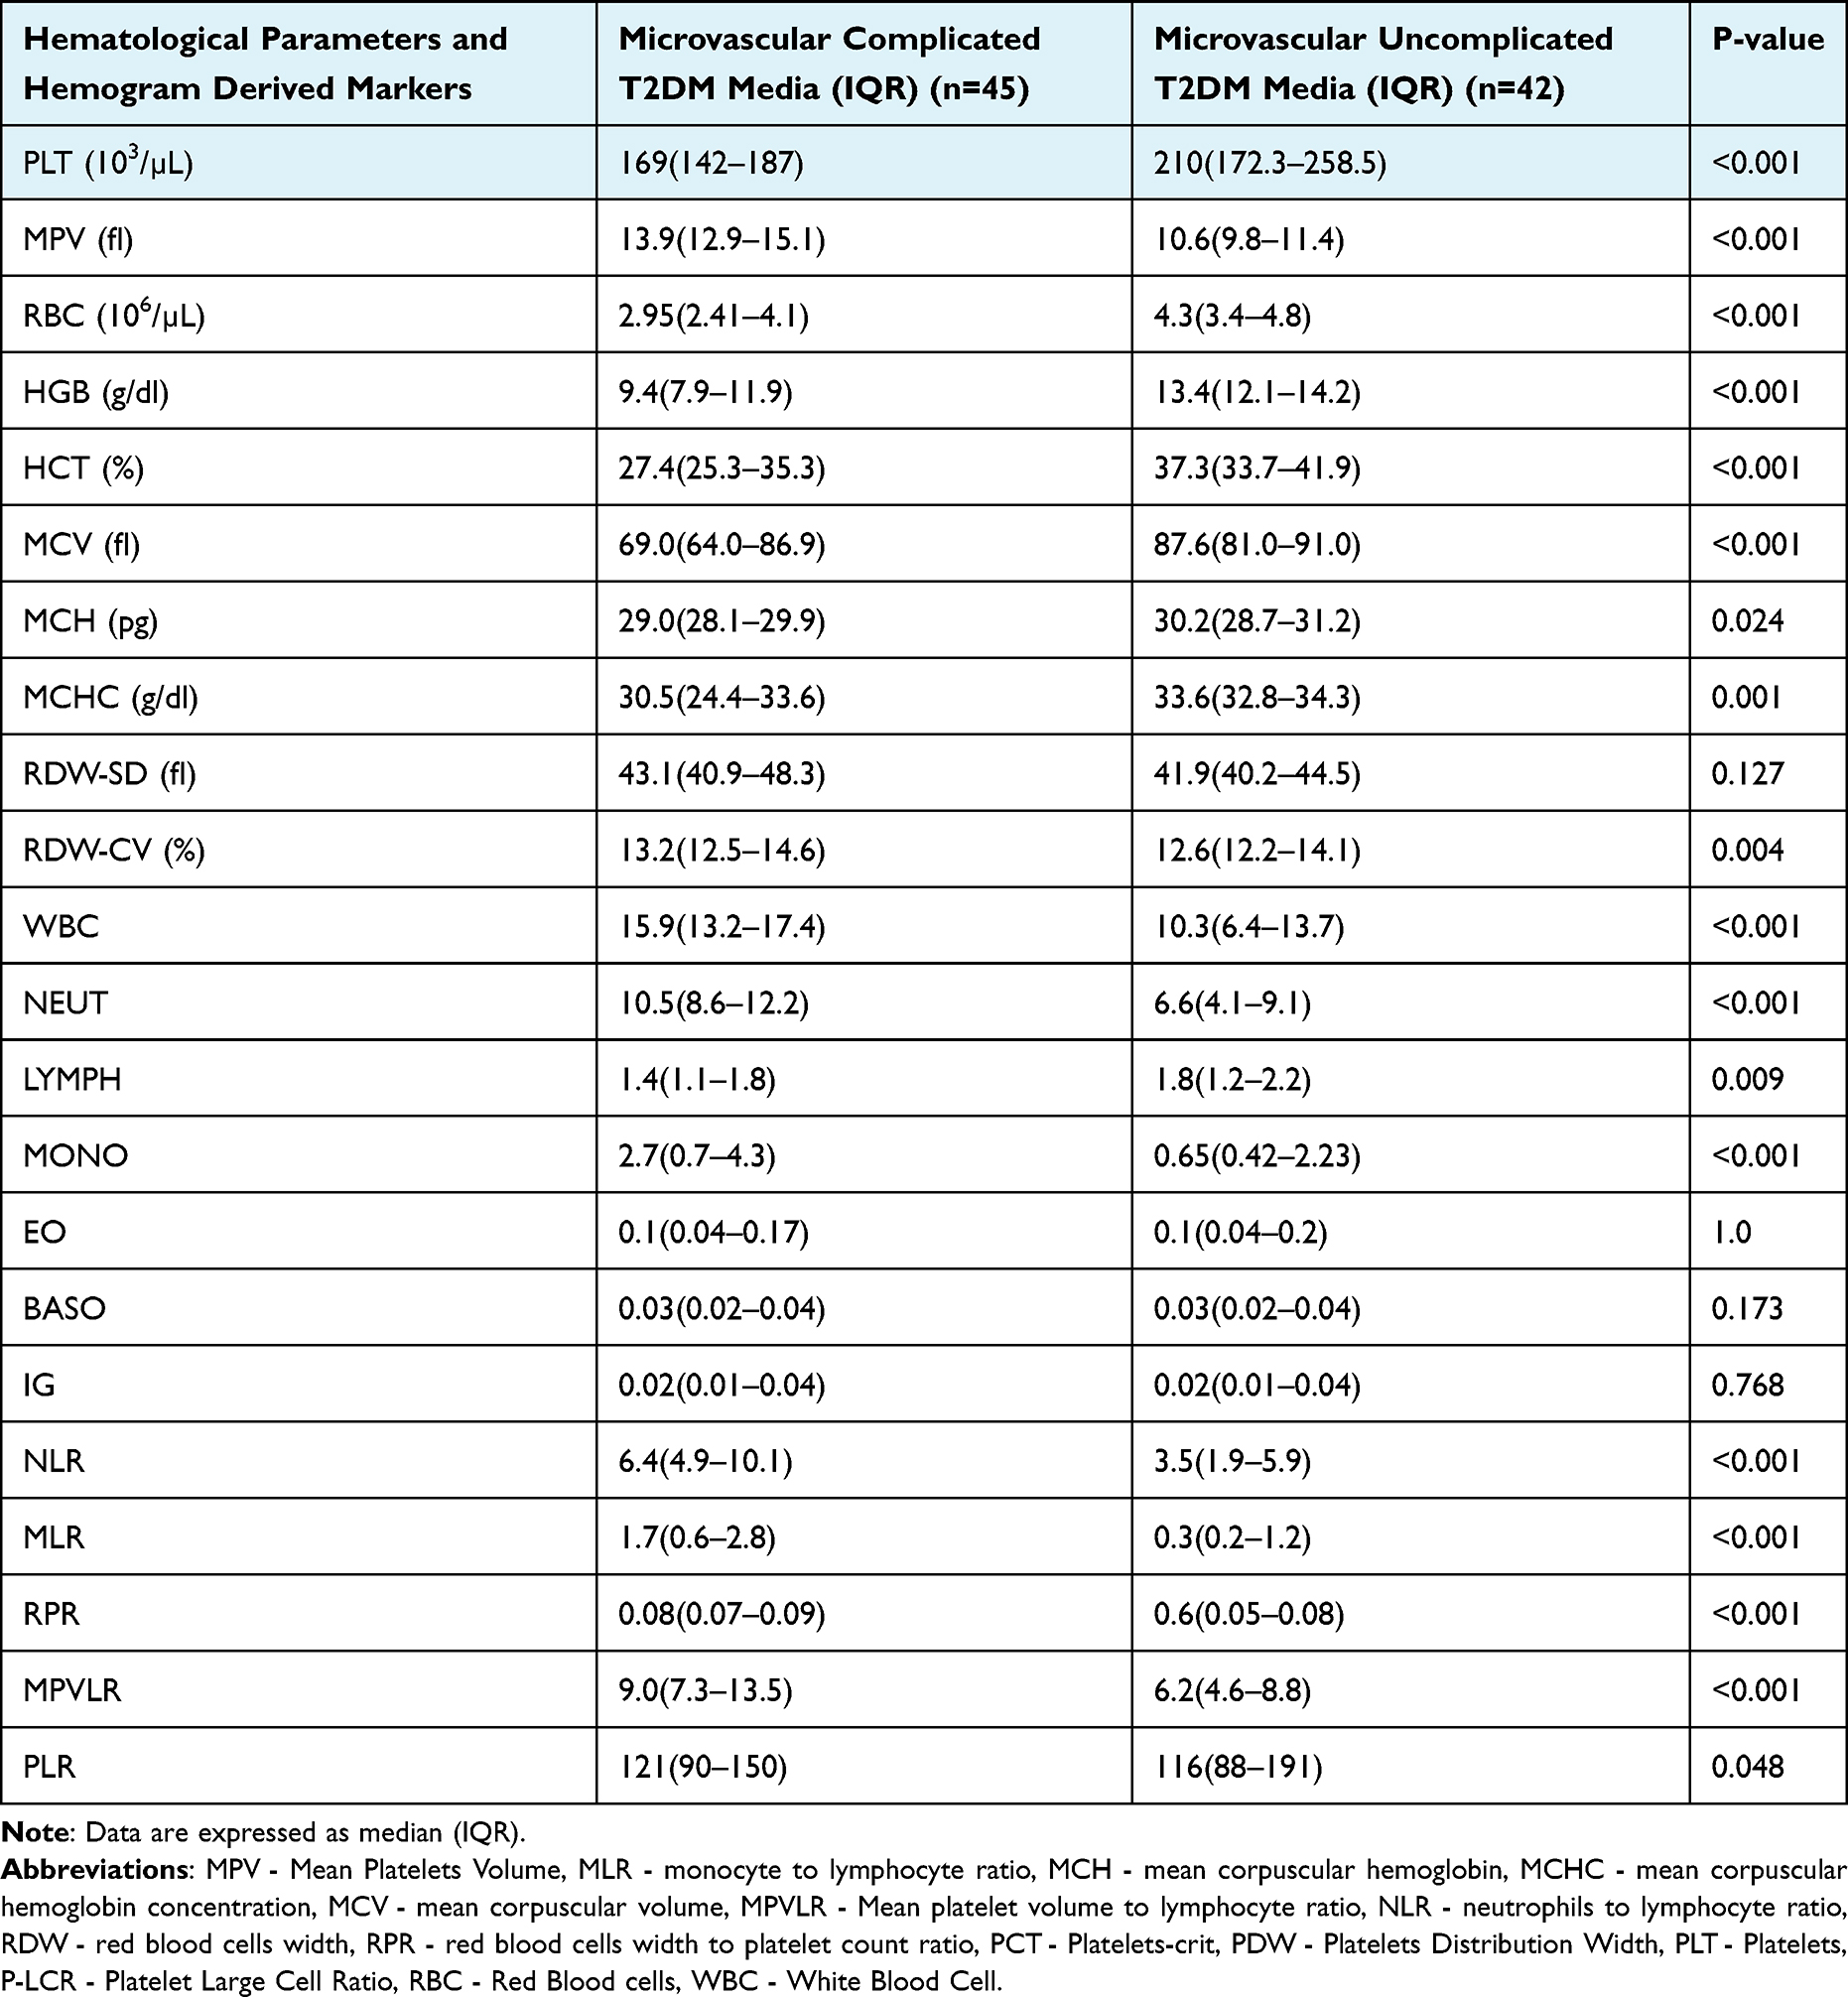 |
Table 4 Comparisons of Hematological Parameters and Hemogram Derived Novel Markers Between Type 2 Diabetic Patients with Complications and Without Complications Attending Bishoftu Hospital, Central Ethiopia, from June 15 to August12, 2022 (n=87) |
On the other hand, the Mann–Whitney comparison test also showed that the red blood cell width coefficient variation, total white blood cell count, absolute neutrophils count, mean platelet volume, absolute monocyte, neutrophils to lymphocyte ratio, monocyte to lymphocyte ratio, mean platelet volume to lymphocyte ratio values were significantly higher in microvascular complicated type 2 diabetic patients than in type 2 diabetes mellitus without complications (p<0.001) (Table 4).
In addition, platelet count, absolute lymphocyte count, red blood cells, hemoglobin, hematocrit, mean cell volume, mean cell hemoglobin, and mean cell hemoglobin concentration level were significantly lower in type 2 diabetic patients with complications than without complications (p<0.001) (Table 4).
Determination of Predictive Values of Hemogram-Derived Novel Markers as Indicators for Poor Glucoregulation in a Diabetic Patient by ROC Analysis
A ROC analysis was performed to determine the ability of the hemogram novel markers as predictors of poor glycemic control in type 2 diabetic patients. Neutrophils to lymphocyte ratio, Monocyte to lymphocyte ratio, Mean platelet volume to lymphocyte ratio, and Platelet count to lymphocyte ratio have been identified as novel markers for poor glycemic levels in type 2 diabetic patients. However, the Red blood cell width to platelet count ratio failed to discriminate the poor status of glucoregulation from the good status of glucoregulation in type 2 diabetic patients (Table 5 and Figure 3).
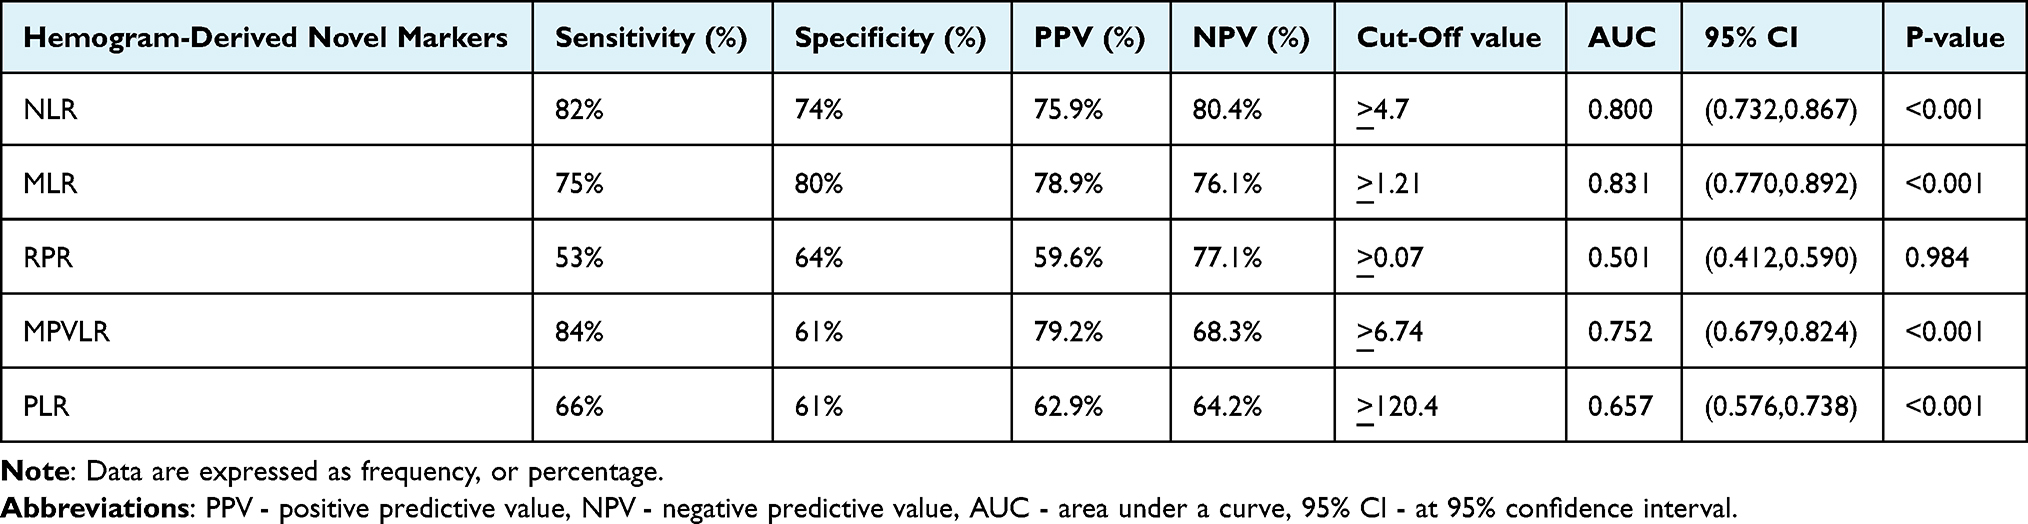 |
Table 5 Determination of Predictive Values of Hemogram-Derived Novel Markers for Poor Glucoregulation of T2DM Patients Attending Bishoftu Hospital, from June 15 to August 12, 2022 (n=174) |
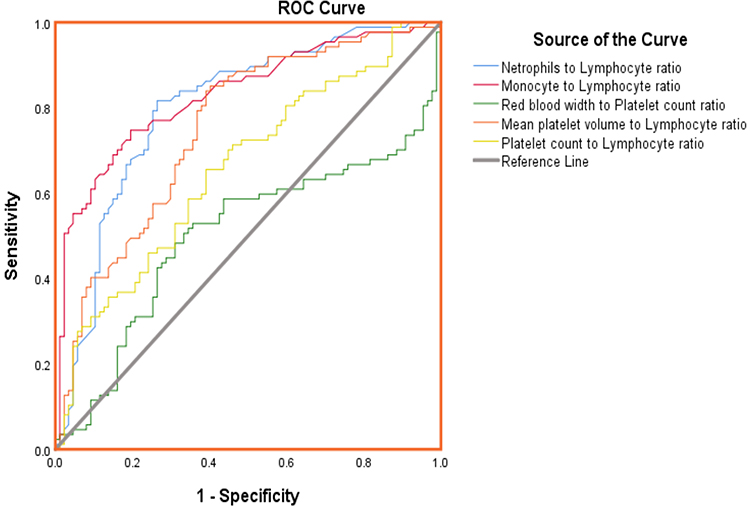 |
Figure 3 Graph of Receiver operating characteristic curve analysis for hemogram-derived novel markers as a predictor of poor glucoregulation in type 2 diabetic patients attending Bishoftu General Hospital, from June 15 to August 12, 2022. |
Determination of Prognostic Values of Hemogram-Derived Novel Markers as Indicators for Microvascular Complication in a Diabetic Patient by ROC Analysis
A ROC analysis was performed to determine the ability of the hemogram novel markers as forecasters of microvascular complications status in type 2 diabetic patients. Thus, Neutrophils to lymphocyte ratio, Monocyte to lymphocyte ratio, red blood cell width to platelet count ratio, and Mean platelet volume to lymphocyte ratio values were identified as new markers of microvascular complications in type 2 diabetic patients. Platelet counts to lymphocyte ratio failed to discriminate the microvascular complications status from non-complications status in type 2 diabetic patients (Table 6 and Figure 4).
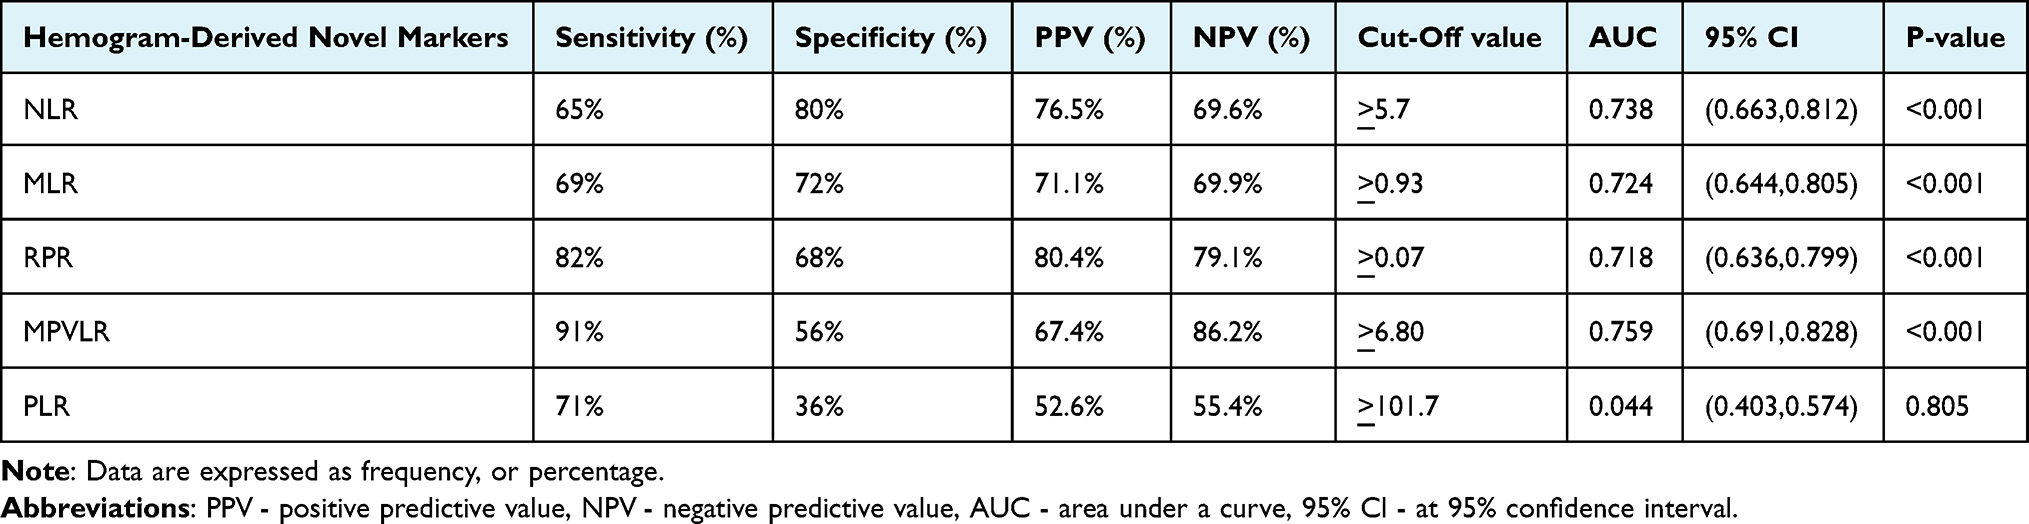 |
Table 6 Determination of Projecting Capabilities of Hemogram-Derived Novel Markers for Microvascular Complication in T2DM Patients Attending Bishoftu Hospital, from June 15 to August 12, 2022 (n=87) |
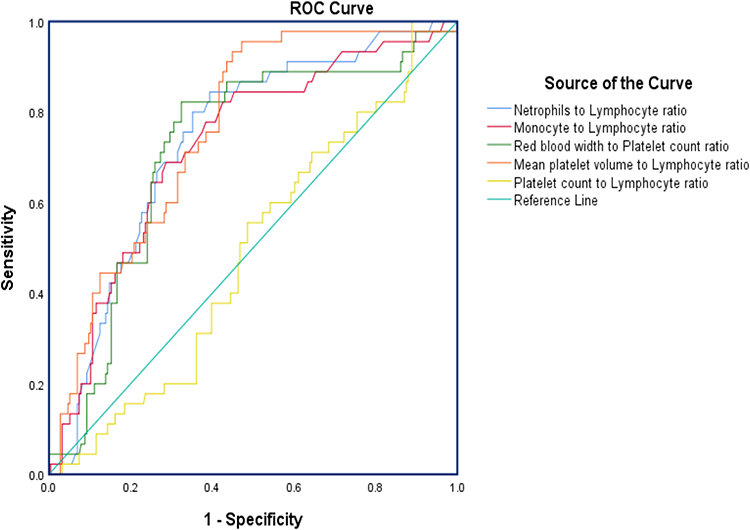 |
Figure 4 Graph of Receiver operating characteristic curve analysis for hemogram-derived novel markers as a predictor of microvascular complications in type 2 diabetic patients attending Bishoftu General Hospital, from June 15 to August 12, 2022. |
Discussion
Among hematological disorders, anemia is the most common blood disorder. Due to chronic inflammation, a leukocyte count increment plays a pivotal role in the development of diabetic macro- and microvascular complications. Other vascular complications cause the alteration of platelet morphology and functions.9,11 Determination of hematological parameters and hemogram-derived markers have received attention in the management of diabetic patients because they are used to ascertain diabetic poor glycemic and vascular complications status in a simple, rapid, and inexpensive manner.11,31–37
In our study about 37.9% of type 2 diabetic participants experienced anemia. In diabetic patients anemia is common due to oxidative stress; increased erythrocyte mechanical fragility; Impact of hypoglycemic drugs; relative erythropoietin (EPO) deficiency, shortened erythrocyte lifespan by the coexistence of micro- and macro-angiopathies.9,11
Our study showed lower anemia prevalence than the report of the study done in Karachi.38 This disagreement might be due to differences in the age of the current and previous study population. For example, in contrast to the current study which included adult participants between 18–65 years old, the study conducted in Karachi included those who were 18–85 years old. Reduced renal function, inflammation, bone marrow suppression, and malnutrition are more probable as people become older.39 Likewise, a study conducted in Karachi included 18.4% of participants with a history of blood loss and 5.4% of patients were strict vegetarians. Those two key factors might cause the difference in anemia prevalence. Our study revealed higher anemia proportion when compared with studies done in other parts of Ethiopia.40,41 This inconsistency might be attributed to variations in the sample size and behavioral characteristics of the study subjects. For instance, a study done in Eastern Ethiopia involved 325 and North-East Ethiopia involved 249 study participants. Our study involved only 174 participants to determine anemia prevalence; which might be statistically influenced and gave exaggerated anemia prevalence in the current study.
This study aimed to determine the conjoint morphological characteristics of anemia among T2DM participants. The normocytic normochromic and microcytic blood pictures were the most common morphological blood pictures. It is not surprising to see a normocytic normochromic blood picture of anemia in this study, as preceding studies conducted in Karachi38 and Iran,42 also had comparable findings. As the participants of this study were DM patients, anemia of chronic disease is predictable, which is normocytic normochromic in morphology. However, microcytic hypochromic anemia experienced by DM patients also might be due to nutritional deficiencies and poly-pharmacy frequently being used.43
This study result suggests that there was no significant difference in PLT count, red blood cell width, absolute eosinophil count, basophils count, immunoglobulin level, and red blood cell width to platelet count ratio between diabetics with and without poor glycemic control and healthy control groups. This was in line with the conclusions of studies conducted in Turkey.44–46 Furthermore, there was no significant difference in terms of absolute eosinophil count, absolute basophils count, immunoglobulin level, and red blood cell width standard deviation between type 2 diabetic patients with microvascular and without microvascular complications. The reports from studies conducted in India,47 Indonesia,32 and China21 are concordant with our study result.
The results of the current study revealed that elevated values of total WBC, absolute neutrophils count, absolute monocyte count, mean platelet volume, neutrophils to lymphocyte ratio, monocyte to lymphocyte ratio, mean platelet volume to lymphocyte ratio, and platelet count to lymphocyte ratio in poor glycemic control type 2 diabetic compared with good glycemic control and healthy control group. The inflammatory condition in type 2 diabetic patients leads to increased production of monocytes and neutrophils, which enhance the increase of their hemogram derivative.48 Our findings were consistent with studies conducted in Turkey.33,44 On the other hand, a study conducted in Indonesia49 found contradictory results of absolute Neutrophil count, Monocyte count, and lymphocyte count with our findings. This discrepancy may be due to several factors such as body mass index, lipid profile, blood pressure controlling mode, and duration of suffering by DM of current and previous study participants since not controlling these risk factors causes rise of WBC, monocyte, neutrophil and their derivative in diabetic patients.
In our study, the values of red blood cell count, hemoglobin, hematocrit, mean cell volume, mean cell hemoglobin, mean cell hemoglobin concentration and absolute lymphocyte count were lower among poor glycemic control type 2 diabetics than good glycemic control and healthy control group. Hyperglycemia has a direct relationship with the development of an inflammatory condition showed by the increased expression of proinflammatory cytokines such as IL-6, TNF-α, and NFκB. By increasing especially IL-6, an anti-erythropoietic effect occurs, since this cytokine changes the sensitivity of progenitors to erythropoietin and also increases apoptosis of immature erythrocytes initiating a decrease further in the number of erythrocytes and consequently causing a reduction of circulating hemoglobin.50 In T2DM patients, the lymphocyte is lower due to insufficiency of lymphocyte proliferation following decreased expression of interleukin-2 receptors (IL-2) because of Clusters of Differentiation Antigen 25 (CD25) deficiency.48 Studies conducted in India,51 Bangladesh,31 and Indonesia,52 also support our findings.
The values of mean platelet volume, red blood cells width coefficient of variation, total WBC count, absolute neutrophils count, absolute monocyte count, neutrophils to lymphocyte ratio, monocyte to lymphocyte ratio, mean platelet volume to lymphocyte ratio, and red blood cells width to lymphocyte ratio significantly increased among type 2 diabetics with microvascular complications compared with type 2 diabetics without complications. Reports similar to our findings come from studies conducted in Turkey,23,34 Syria,53 China,21,37,54,55 and Egypt.55 On the other hand, a study conducted in China21 found inconsistent results to our findings. The possible reason for this contradiction might be due to the differences in the diastolic and systolic blood pressure levels in the current study and the study done in China.21 Since these blood pressure parameters are increased in our study subjects could amplify the inflammation condition in the participants increasing inflammatory indicators parameters.
The values of platelet count, red blood cell count, hemoglobin, hematocrit, mean cell volume, mean cell hemoglobin, mean cell hemoglobin concentration and absolute lymphocyte count significantly decreased among type 2 diabetics with microvascular complications than type 2 diabetics without complications. The exact mechanisms of lower RBC parameters in patients with microvascular complications is not clear.56 However, the effect of DM on tissues responsible for the synthesis of erythropoietin reduces kidney response to hypoxia. Reduction in androgenic hormone levels in DM attenuates stem cells in the bone marrow and reduces erythropoietin synthesis in the kidney. Reticulocytes also develop resistance in their response to increased erythropoietin.57
Studies conducted in India,47,58 China,21,51 Syria,53 Iran,42 and Italy59 also support our findings. However, a study done in India58 revealed only Hgb, MCV, and MCHC values were significantly decreased in cases as compared with the control group; and a study done in Saudi Arabia32 came only with lower RBC count, Hgb, Hct values in cases compared with controls. The possible reason for inconsistency of our study findings with studies done in India and Saudi Arabia could be due to differences in the onset duration of complications. Since the longer duration of complication onset might cause decrement of RBC parameters.
According to our study, the results of the Receiver Operating Characteristic Curve (ROC) analysis showed that NLR, MLR, MPVLR, and PLR can distinguish poor glycemic control status from good control in type 2 diabetic patients. However, the RPR value failed to distinguish the poor glycemic status from the good glycemic status in diabetic patients. Based on their AUC values, the NLR and MLR were identified as excellent predictors of poor glycemic status; while MPVLR and PLR values were good forecasters of poor glycemic control in diabetic patients. The values of NLR, PLR, and MLR are potential inflammatory biomarkers for tumors, cardiovascular disease, ankylosing spondylitis, rheumatoid arthritis, and inflammatory bowel disease. Currently, there is evidence that connects them to the progression of DM and its complications.12–14,17–22
Regarding our study, the results of Receiver Operating Characteristic curve (ROC) analysis showed that the NLR, MLR, MPVLR, and RPR values were identified as novel markers of microvascular complications in type 2 diabetic patients. Although numerous tests are used, as a prognostic tool for diabetic-triggered microvascular complications, the complete blood count with differential is extensively used, either alone or in combination with other tests and hemogram-derived markers is endorsed. However, the PLR value failed to distinguish the microvascular complication status in diabetic patients. Based on their AUC values, the NLR, MLR, MPVLR, and RPR values were identified as good prognosticators of microvascular complication status in diabetic patients. The AUC, cutoff value, specificity, and sensitivity values of NLR were greater in our study than in studies done in China32 and in India.36 However, a study conducted in China51 reported a higher sensitivity value than ours. The possible reason for these contradictory values could be due to inadequate glycemic control despite the use of different treatment medicines in our study participants.
In our study, the AUC, cutoff value, and sensitivity values of MPVLR were greater compared with the result of a study done in Turkey,23 while the specificity value of MPVLR was lower in ours. This inconsistency may be due to the effects of confounding factors and differences in sample size. The sensitivity, specificity, and AUC values of MLR in our study were lower as compared with a study done in China.54 However, our study comes up with a greater cutoff value. In addition, the sensitivity, specificity, AUC, and cutoff values of MLR in our study were significantly higher when compared with the results of a study conducted in China.22 The disagreement may be due to the effects of confounding factors and differences in lifestyle of the previous and present study participants. Although lifestyle dynamics might be an unmeasured confounding factor for this connotation, sex hormones have many potential effects on several organs with cardiovascular and immune purposes.60
The RPR with a sensitivity of 82%, specificity of 68%, PPV of 80.4%, NPV of 79.1%, AUC 0.718, and cutoff values of 0.718 were identified as predictors of poor microvascular complications. In our study, the AUC, specificity, and NPV values were significantly lower than in a study done in Turkey.35 While, in our study PPV, cutoff values, and sensitivity values were significantly higher than a study done on Diagnostic Possibilities for Early Onset Neonatal Sepsis: Red Cell Distribution Width to Platelet Ratio study done in Turkey.35 In comparison to inflammatory cytokines, the calculation approaches for the NLR, PLR, MLR, MPVLR, and RPR are fairly straightforward, as they can be attained through peripheral blood examination, which is cheap, appropriate, and simple to explain.
The Strength of This Study
This study is a comprehensive study to evaluate nearly all hematological parameters in various conditions of type 2 diabetic patients and it can give clues on the purpose of hematological parameters in the management and control of diabetic patients. In addition, this study also assesses the level of different hemogram-derived novel markers in the different health statuses of type 2 diabetic patients and this may create an outline for other researchers. Also, a morphological study of blood cells was done for the morphological characterization of anemia and to check the hematological analyzer output of complete blood count.
Limitations of This Study
This study used a cross-sectional study design that limits the ability to identify causal relationships between variables. Also, it uses a small sample size and is conducted at a single hospital. In addition, an assessment of the coagulation profile was not done, and plasma glucose was used instead of HgbA1c due to limitations of the HgbA1c test and coagulation profile assessment set up in the hospital.
Conclusion
We conclude our study by saying that anemia is common in diabetes mellitus, particularly in patients with poor glycemic control and microvascular complications. The values of total WBC count, absolute neutrophils count, absolute monocyte count, NLR, MLR, MPVLR, and PLR values were significantly higher in poor glycemic control T2DM; and also NLR, MLR, MPVLR, and RPR values were significantly higher in DM patients with microvascular complications. On the other hand, RBC count, HGB, HCT, MCV, MCH, and MCHC levels and the absolute lymphocyte count values were significantly lower in T2DM with poor glycemic control and microvascular complications.
Correspondingly, the ROC analysis showed that NLR, MLR, MPVLR, and PLR were significantly identified as potential prognosticators for poor glycemic control. While, NLR, MLR, MPVLR, and RPR were significantly identified as possible forecasters for microvascular complication status in diabetic patients. These hemogram-derived markers are more useful than other cell parameters; because they have absolute value counts and show good constancy even when pathological, physiological, and physical factors of the WBC count fluctuate. Therefore, routine screening of hematological parameters, and calculation and use of hemogram-derived markers for monitoring and management of different altered health status of DM is very important in the improvement of patients’ quality of life.
Abbreviations
AIDS, Acquired Immune Deficiency Syndrome; ADA, American Diabetes Association; ART, Ant-retrovirus treatment; BP, Blood Pressure; BMI, Body Mass Index; CBC, Complete Blood Count; DM, Diabetes Mellitus, K2-EDTA, Dipotassium Ethylene-Diamine Tetra-acetic Acid; FBS, Fasting Blood Glucose; HC, Hip-Circumference; HIV, Human Immune Virus; HBV/C, Hepatitis virus B or C; IDF, International Diabetes Federation; IQR, Interquartile Range; MPV, Mean Platelets Volume; MLR, monocyte to lymphocyte ratio; MCH, mean corpuscular hemoglobin; MCHC, mean corpuscular hemoglobin concentration; MCV, mean corpuscular volume; MPVLR, Mean platelet volume to lymphocyte ratio; NLR, neutrophils to lymphocyte ratio; RDW, red blood cells width; RPR, red blood cells width to platelet count ratio; ORS, Oromia Regional State; PCT, Platelets crit; PDW, Platelets Distribution Width; PLT, Platelets; P, LCR-Platelet Large Cell Ratio; ROC, Receiver Operating Characteristic curve; RBC, Red Blood cells; SBP, Systolic Blood Pressure; SPSS, Statistical Package for Social Sciences, T2DM, Type 2 Diabetes Mellitus; US$, United State Dollar; WBC, White Blood Cell; WC, Waist Circumference; WHO, World Health Organization; WHR, Waist to Hip Ratio.
Data Sharing Statement
The datasets analyzed during the current study are available from the corresponding author upon reasonable request.
Ethics and Information Consent to Participate
The study was conducted following the Declaration of Helsinki and an approved ethical clearance was obtained from the Institutional Review Board of the Jimma University Institute of Health under Ref.No.IHPPGJ/84412 at date:30/05/2022. A supplementary letter, with Ref.No.BEFO10339/2022, was also obtained from the Oromia Regional Office, Department of Research Review Board, and submitted to the Bishoftu General Hospital administration office and was directed to the medical laboratory head and chronic clinic head offices. It was then sent to both headquarters along with a letter of support from the School of Medical Laboratory Sciences, Jimma University.
After obtaining permission from the Hospital administrator, the head of the Chronic Clinic care unit, and the head of the medical laboratory, a clear explanation of the study’s objectives, procedures, benefits, possible risks, and the participant’s right to voluntarily participate, written informed consent was obtained from each study subject. Codes were used instead of participants’ names to protect the confidentiality of obtained data, and unauthorized person access to the collected data was prohibited.
Acknowledgments
All authors would like to thank Jimma University, Bishoftu General Hospital staff members, all data collectors, supervisors, study participants, and questionnaire translators for their assistance in conducting this study.
Author Contributions
All authors made a significant contribution to the work reported in the conception, study design, execution, acquisition, analysis, and interpretation of data; took part in the drafting, revising, or critical reviewing of the article; gave final approval of the version to be published; have agreed on the journal to which the article has been submitted; and agreed to be accountable for all aspects of the work.
Funding
There is no funding to report.
Disclosure
The authors declare no conflicts of interest in this study.
References
1. World Health Organization. Geneva;Classification of Diabetes Mellitus. World Health Organization. 4–28. 2019.
2. American association Diabetes. Classification and diagnosis of diabetes: standards of medical care in diabetes. J Diabetes Care. 2019;42(1):13–28. doi:10.2337/dc19-S002
3. World Health Organization (WHO). Geneva:Diabetes Key Facts Overview. World Health Organization. 1–5. 2021.
4. International Diabetes Federation(IDF). IDF Diabetes Atlas.
5. Zeru M, Tesfa E, Mitiku A, et al. Prevalence and risk factors of type-2 diabetes mellitus in Ethiopia: systematic review and meta-analysis. Sci Rep. 2021;11(1):1–15. doi:10.1038/s41598-021-01256-9
6. Victoria H, Reimar W, Ole H, et al. Diabetes in Sub Saharan Africa: epidemiology and public health implications. BMC Public Health. 2011;11:1471–2458.
7. Ling W, Huang Y, Huang Y, et al. Global trend of diabetes mortality attributed to vascular complications, 2000–2016. J Cardiovasc Diabetol. 2020;19(182):2–12.
8. Bandeira Sde M, da Fonseca LJS, Guedes Gda S, et al. Oxidative stress as an underlying contributor in the development of chronic complications in diabetes mellitus. Int J Mol Sci. 2013;14(2):3265–3284. doi:10.3390/ijms14023265
9. Papatheodorou K, Banach M, Bekiari E, et al. Complications of diabetes. J Diabetes Res. 2018;30(8):61–67.
10. Iglay K, Hannachi H, Joseph Howie P, et al. Prevalence and co-prevalence of comorbidities among patients with type 2 diabetes mellitus. Curr Med Res Opin. 2016;32(7):1243–1252. doi:10.1185/03007995.2016.1168291
11. Skyler JS, Bakris GL, Bonifacio E, et al. Differentiation of diabetes by pathophysiology, natural history, and prognosis Diabetes. Am Diabetes Assoc Inc. 2017;66:1.
12. Orozco-Morales M, Soca-Chafre G, Barrios-Bernal P, et al. Interplay Cancer, between cellular and molecular inflammatory mediators in lung. Inflamm Mediat Journal. 2016;34(9):46–108.
13. Marchetti C, Romito A, Musella A, et al. Combined plasma fibrinogen and neutrophil lymphocyte ratio in ovarian cancer prognosis may play a role? Int J Gynecol Cancer. 2018;28(5):939–944. doi:10.1097/IGC.0000000000001233
14. Fei X, Xing M, Wo M, et al. Thyroid stimulating hormone and free triiodothyronine are valuable predictors for diabetic nephropathy in patient with type 2 diabetes. Ann Trans Med. 2018;6(15):30–35. doi:10.21037/atm.2018.07.07
15. Kraakman MJ, Lee MKS, Al-Sharea A, et al. Neutrophil-derived S100 calcium-binding proteins A8/A9 promote reticulated thrombocytosis and atherogenesis in diabetes. J Clin Invest. 2017;127(6):2133–2147. doi:10.1172/JCI92450
16. Ebrahim H, Fiseha T, Ebrahim Y, et al. Comparison of hematological parameters between type 2 diabetes mellitus patients and healthy controls at Dessie comprehensive specialized hospital, Northeast Ethiopia: comparative cross-sectional study. PLoS One. 2022;17(7):e0272145. doi:10.1371/journal.pone.0272145
17. Fu W, Fu H, Ye W, et al. Peripheral blood neutrophil-to-lymphocyte ratio in inflammatory bowel disease and disease activity: a meta-analysis. Int Immunopharmacol. 2021;101(10):82–85. doi:10.1016/j.intimp.2021.108235
18. Gemenetzis G, Bagante F, Griffin J, et al. Neutrophil-to-lymphocyte ratio is a predictive marker for invasive malignancy in intraductal papillary mucinous neoplasms of the pancreas:339–345. Ann Surg. 2017;266(2):339–345. doi:10.1097/SLA.0000000000001988
19. Patel A, Ravaud A, Motzer R, et al. Neutrophil-to-lymphocyte ratio as a prognostic factor of disease-free survival in postnephrectomy high-risk locoregional renal cell carcinoma: analysis of the S-TRAC trial. Clin Cancer Res. 2020;26(18):4863–4868. doi:10.1158/1078-0432.CCR-20-0704
20. Liang T, Chen J, Xu G, et al. Platelet-to-lymphocyte ratio as an independent factor was associated with the severity of ankylosing spondylitis. Front Immunol. 2021;12:214–276. doi:10.3389/fimmu.2021.760214
21. Zeng J, Min Chen QF, Feng Q, et al. The platelet-to-lymphocyte ratio predicts diabetic retinopathy in type 2 diabetes mellitus. Diabetes, Metab Syndr Obes Targets Ther. 2022;15:3617–3626. doi:10.2147/DMSO.S378284
22. Yue S, Zhang J, Wu J, et al. Use of the monocyte-to-lymphocyte ratio to predict diabetic retinopathy. Int J Environ Res Public Heal. 2015;12(8):10009–10019. doi:10.3390/ijerph120810009
23. Kocak MZ, Aktas G, Erkus E, et al. Mean platelet volume to lymphocyte ratio as a novel marker for diabetic nephropathy. J Coll Physicians Surg Pakistan. 2018;28(11):844–847. doi:10.29271/jcpsp.2018.11.844
24. Gebreegziabher E, Astawesegn F, Anjulo A, et al. Urban health extension services utilization in bishoftu Town, Oromia Regional State, Central Ethiopia. BMC Health Serv Res. 2017;17(1):1–10. doi:10.1186/s12913-016-1943-z
25. Gedamu S, Sendo E, Daba W, Talbott EO. Congenital anomalies and associated factors among newborns in Bishoftu General Hospital, Oromia, Ethiopia: a retrospective study. J Environ Public Health. 2021;2021:1–6. doi:10.1155/2021/2426891
26. Biadgo B, Melku M, Abebe S, et al. Hematological indices and their correlation with fasting blood glucose level and anthropometric measurements in type 2 diabetes mellitus patients in Gondar, Northwest Ethiopia. J Diabetes Metab Syndr Obes Targets Ther. 2016;9:91–99. doi:10.2147/DMSO.S97563
27. VanVoorhis CW, Morgan BL. Understanding power and rules of thumb for determining sample sizes. Tutor Quant Methods Psychol. 2007;3(2):
28. Ivanov TD. American Diabetes Association. Stand Med Care Diabetes-2017. 2017;6(1):47–63.
29. Centers for Disease Control and Prevention. Laboratory procedure manual for fasting glucose by roche cobas C311. 2017. Available from: https://wwwn.cdc.gov/nchs/data/nhanes/2015-2016/labmethods/GLU_I_MET_C311.pdf.
30. Grigg A Europe, Sysmex XN-550 complete blood count and parameters whole blood-standard operating procedure. 2019;1–25.
31. Jaman MS, Rahman MS, Swarna RR, et al. Diabetes and red blood cell parameters. Ann Clin Endocrinol Metab. 2018;2(1):1–9.
32. Alamri BN, Bahabri A, Aldereihim AA, et al. Hyperglycemia effect on red blood cells indices. Eur Rev Med Pharmacol Sci. 2019;23(5):2139–2150. doi:10.26355/eurrev_201903_17259
33. Sefil F, Ulutas KT, Dokuyucu R. Investigation of neutrophil lymphocyte ratio and blood glucose regulation in patients with type 2 diabetes mellitus. J Int Med Res. 2014;42(2):581–588. doi:10.1177/0300060513516944
34. Ulu SM, Dogan M, Ahsen A, et al. Neutrophil-to-lymphocyte ratio as a quick and reliable predictive marker to diagnose the severity of diabetic retinopathy. DIABETES Technol Ther. 2013;15(11):943–947. doi:10.1089/dia.2013.0097
35. Karabulut B, Arcagok BC. New diagnostic possibilities for early onset neonatal sepsis: red cell distribution width to platelet ratio. Fetal Pediatr Pathol. 2020;39(4):297–306. doi:10.1080/15513815.2019.1661051
36. Dutta S, Qureshi Z, Surana V, et al. Neutrophil‑lymphocyte Ratio is a Novel Reliable Predictor of Nephropathy, Retinopathy, and Coronary Artery Disease in Indians with Type‑2 Diabetes. Indian J Endocrinol Metab. 2017;21(6):865–869.
37. Wang JR, Chen KY, Chi C. Association between neutrophil‑to‑lymphocyte ratio, platelet‑to‑lymphocyte ratio, and diabetic retinopathy. Diabetol Metab Syndr. 2020;12:1–10. doi:10.1186/s13098-019-0485-z
38. Shams N, Osmani MH. Newly diagnosed anemia in admitted diabetics, frequency, etiology and associated factors. J Coll Physicians Surg Pakistan. 2015;25(4):242–246.
39. Trevest K, Treadway H, Hawkins-van DCG, Bailey AA, Abdelhafiz AH. Prevalence and determinants of anemia in older people with diabetes attending an outpatient clinic: a cross-sectional audit. Clin Diabetes. 2014;32(4):158. doi:10.2337/diaclin.32.4.158
40. Tujuba T, Ayele BH, Fage SG, et al. Anemia among adult diabetic patients attending a general hospital in Eastern Ethiopia: diabetes. Metab Syndr Obes. 2021;14:467–476. doi:10.2147/DMSO.S289298
41. Taderegew MM, Gebremariam T, Tareke AA, Woldeamanuel GG. Anemia and its associated factors among type 2 diabetes mellitus patients. J Blood Med. 2020;11:47–58. doi:10.2147/JBM.S243234
42. Hosseini MS, Rostami Z, Saadat A, et al. Anemia and microvascular complications in patients with type 2 diabetes mellitus. Nephro Urol Mon. 2014;6(4):e19976. doi:10.5812/numonthly.19976
43. Thambiah SC, Samsudin IN, George E, et al. Anaemia in type 2 diabetes mellitus (T2DM) patients in Hospital Putrajaya. Malaysian J Med Heal Sci. 2015;11(1):49–62.
44. Duman TT, Aktas G, Atak BM, et al. Neutrophil to lymphocyte ratio as an indicative of diabetic control level in type 2 diabetes mellitus. African Heal Sci. 2019;19(1):1602–1606. doi:10.4314/ahs.v19i1.35
45. Pujani M, Gahlawat H, Agarwal C, Chauhan V, Singh K, Lukhmana S. Can they serve as biomarkers of glycemic control or development of complications in evaluation of type 2 diabetes mellitus ? Iraqi J Hematol. 2018;7(2):72–78. doi:10.4103/ijh.ijh_8_18
46. Kadić HS. Mean platelet volume predicts the glycemic control deterioration in diabetes mellitus type 2 patients. J Med Glas. 2016;13(1):1–7.
47. Farooqui R, Afsar AI, Afroze IA. Role and significance of hematological parameters in diabetes mellitus. Ann Pathol Lab Med. 2019;6(3):159–162. doi:10.21276/apalm.2355
48. Nurlaelatiningsih SS. Correlation between neutrophil- lymphocyte ratio and cardiac autonomic neuropathy in diabetes mellitus type 2 patients. Int J Integr Heal Sci. 2017;5(1):15–20.
49. Adnyani PY, Mahartini NN, Herawati S, et al. Comparison of Neutrophil to Lymphocyte Ratio (NLR) and Lymphocyte to Monocyte Ratio (LMR) values in controlled and uncontrolled Type 2 Diabetes Mellitus (T2DM) patient. Bali Med J. 2021;10(2):2302–2914. doi:10.15562/bmj.v10i2.2501
50. Angelousi EL, Larger E. Anaemia, a common but often unrecognized risk in diabetic patients: a review. Diabetes Metab. 2015;41(1):18–27. doi:10.1016/j.diabet.2014.06.001
51. Xu T, Weng Z, Chu P, et al. The relationship between neutrophil-to-lymphocyte ratio and diabetic peripheral neuropathy in Type 2 diabetes mellitus. Medicine. 2017;96(45):1–6.
52. Sari NKP, WandeIN I, Ketut Suega IK, et al. The relationship between hepcidin and anemia in controlled and uncontrolled Type-2 Diabetes Mellitus (T2DM) patients. Indones J Biomed Sci. 2021;15(2):140–144. doi:10.15562/ijbs.v15i2.361
53. Jaaban M, Zetoune AB, Hesenow S, et al. Neutrophil-lymphocyte ratio and platelet-lymphocyte ratio as novel risk markers for diabetic nephropathy in patients with type 2 diabetes. Heliyon. 2021;7(7):e07564. doi:10.1016/j.heliyon.2021.e07564
54. Huang Q, Wu WM, Kumaran EAP, et al. Monocyte–lymphocyte ratio is a valuable predictor for diabetic nephropathy in patients with type 2 diabetes. Medicine. 2020;18(1):1–7. doi:10.1186/s12916-019-1443-1
55. Moursy EY, Megallaa MH, Mouftah RF, et al. Relationship Between Neutrophil-Lymphocyte Ratio and Microvascular Complications. Am J Intern Med. 2015;3(6):250–255.
56. King DE, Mainous A, Buchanan PW, Pearson WS. C-reactive protein and glycemic control in adults with diabetes. Diabetes Care. 2013;26(5):1535–1539. doi:10.2337/diacare.26.5.1535
57. Craig KJ, Williams JD, Riley SG, Smith H, Owens WD. Anemia and diabetes in the absence of nephropathy. Diabetes Care. 2015;28(5):1118–1123. doi:10.2337/diacare.28.5.1118
58. Samuel R, Tejaswi N, Kumar PN, et al. Clinical significance of screening for anaemia in diabetic patients. Int J Pharm Sci Rev Res. 2018;48(2):20–24.
59. Lippi G, Mercadanti M, Aloe R, et al. Erythrocyte mechanical fragility is increased in patients with type 2 diabetes. Eur J Intern Med. 2012;23(2):150–153. doi:10.1016/j.ejim.2011.11.004
60. Cohen J, Vincent J, Adhikari N, Machado F, Angus CT. Sepsis: a roadmap for future research. Lancet Infect Dis. 2018;10(2):8.
 © 2023 The Author(s). This work is published and licensed by Dove Medical Press Limited. The full terms of this license are available at https://www.dovepress.com/terms.php and incorporate the Creative Commons Attribution - Non Commercial (unported, v3.0) License.
By accessing the work you hereby accept the Terms. Non-commercial uses of the work are permitted without any further permission from Dove Medical Press Limited, provided the work is properly attributed. For permission for commercial use of this work, please see paragraphs 4.2 and 5 of our Terms.
© 2023 The Author(s). This work is published and licensed by Dove Medical Press Limited. The full terms of this license are available at https://www.dovepress.com/terms.php and incorporate the Creative Commons Attribution - Non Commercial (unported, v3.0) License.
By accessing the work you hereby accept the Terms. Non-commercial uses of the work are permitted without any further permission from Dove Medical Press Limited, provided the work is properly attributed. For permission for commercial use of this work, please see paragraphs 4.2 and 5 of our Terms.