")
Back to Journals » Nature and Science of Sleep » Volume 16
Causal Relationship of Obstructive Sleep Apnea with Bone Mineral Density and the Role of BMI
Authors Xu F, Zhang X, Zhang Y, Chen W , Liao Z
Received 28 October 2023
Accepted for publication 3 March 2024
Published 22 March 2024 Volume 2024:16 Pages 325—333
DOI https://doi.org/10.2147/NSS.S443557
Checked for plagiarism Yes
Review by Single anonymous peer review
Peer reviewer comments 2
Editor who approved publication: Prof. Dr. Ahmed BaHammam
Fei Xu,1 XiuRong Zhang,2 YinRong Zhang,1 WenHui Chen,3 ZiCong Liao1
1General Surgery Department, Zhongshan Boai Hospital, Zhongshan, Guangdong, 528400, People’s Republic of China; 2Breast Surgery Department, Zhongshan Boai Hospital, Zhongshan, Guangdong, 528400, People’s Republic of China; 3Department of Metabolic and Bariatric Surgery, The First Affiliated Hospital of Jinan University, Guangzhou, Guangdong, 510630, People’s Republic of China
Correspondence: ZiCong Liao, General Surgery Department, Zhongshan Boai Hospital affiliated to Southern Medical University, No. 6 Chenggui Road, East Street, Zhongshan, Guangdong, 528400, People’s Republic of China, Tel +86 76088776658, Email [email protected] WenHui Chen, Department of Metabolic and Bariatric Surgery, The First Affiliated Hospital of Jinan University, No. 613 Huangpu Avenue West, Guangzhou, Guangdong, 510630, People’s Republic of China, Tel +86 13129349492, Fax +86 20 38688608, Email [email protected]
Background: Observational studies have yielded conflicting evidence concerning the relationships between obstructive sleep apnea (OSA) and bone mineral density (BMD). As the exact causal inferences remain inconclusive, we conducted a two-sample Mendelian randomization (MR) to identify the causal associations between OSA and BMD.
Methods: Single-nucleotide polymorphisms associated with OSA were extracted from the FinnGen study. Summary statistics for 10 BMD measured at different age or skeletal sites were obtained from the publicly available IEU GWAS database. Inverse-variance weighted (IVW) method was chosen as the primary analysis, combined with several sensitivity analyses to evaluate the robustness of results. The study design included two-sample MR and network MR.
Results: Our primary MR analysis revealed that genetically predicted OSA was positively linked to increased forearm BMD (β = 0.24, 95% confidence interval [CI]: 0.06– 0.41, p = 0.009) and heel BMD (β=0.10, 95% CI = 0.02– 0.18, p = 0.018), while no significant causal relationships were observed between OSA and total body BMD, lumbar spine BMD, or femoral neck BMD (all p > 0.05). Network MR suggests that OSA might act as a mediating factor in the effect of BMI on forearm BMD and heel BMD, with a mediated portion estimated at 73% and 84%, respectively.
Conclusion: Our findings provide support for a causal relationship between genetically predicted OSA and increased forearm BMD and heel BMD. Furthermore, our results suggest that OSA may play a role in mediating the influence of BMI on BMD.
Keywords: obstructive sleep apnea, bone mineral density, BMI, Mendelian randomization
Introduction
Obstructive sleep apnea is a prevalent sleep-related breathing disease characterized by sleep fragmentation, recurrent apnea, and intermittent hypoxia (IH), affecting nearly 1 billion individuals worldwide.1,2 OSA-induced IH leads to oxidative stress, systemic inflammation, endothelial dysfunction, and elevated sympathetic activation, all of which contribute to the development of various diseases, such as metabolic disorders, cardiocerebrovascular diseases, and neurological dysfunction.3,4 Additionally, as a hallmark of OSA, IH also impacts bone metabolism via regulating the activity of mesenchymal stem cells, osteoblasts, and osteoclasts, ultimately resulting in a change in bone mineral density (BMD).5
Osteoporosis is a common chronic systemic skeletal disorder characterized by skeletal fragility and microarchitectural deterioration.6 The measurement of bone mineral density (BMD) using dual-energy X-ray absorptiometry (DXA) is the gold standard for diagnosing osteoporosis.7 The associations between OSA and BMD has been investigated by many observational cohort studies, but the results remain controversial. For example, a recent meta-analysis from 15 studies consisting of 113,082 patients demonstrated that a strong association between OSA and an increased risk of osteoporosis, along with decreased lumbar spine BMD;8 In contrast, an earlier meta-analysis including 7 studies with 113,558 subjects showed OSA increased the risk of osteoporosis in cohort studies but decreased the risk in cross-sectional studies.9 Additionally, a meta-analysis from 9 articles involving 113,137 participants revealed that OSA was not associated with the risk of osteoporosis.10 The discrepancy in these conflicting findings may be attributed to failure to sufficiently adjust for potential confounding variables. Accumulating evidence suggests that OSA is associated with osteoporosis and BMD, but the exact causality between OSA and BMD remains unclear. Furthermore, findings from conventional observational studies are susceptible to the influences of potential confounders and reverse causation. Therefore, it is imperative to perform further research to elucidate the confusing causal associations between OSA and BMD.
Conventional randomized controlled trials (RCTs) face challenges in effectively exploring these causal relationships due to their cost-intensive and time-consuming nature. Mendelian randomization (MR) offers an alternative and novel method to establish causal inferences by utilizing single nucleotide polymorphisms (SNPs) as genetic instruments from genome-wide association study (GWAS) datasets.11,12 MR designs leverage random allocation of genetic variants during meiosis and fertilization, making it well suited to address biases stemming from reverse causality and potential unmeasured residual confounders in observational studies.13 So far, MR studies have been employed to investigate the association between sleep traits and BMD.14 Still, the causal relationship of OSA with BMD has not been well established. Importantly. A better understanding of the causal relationship between OSA and BMD would be beneficial to prevent potential adverse consequences. Herein, we aimed to conduct a two-sample MR study to explore the causal relationship between OSA and BMD.
Methods
Study Design
In this study, MR analyses adhere to the statement of Strengthening the Reporting of Observational Studies in Epidemiology.15 Three basic assumptions should be followed in MR analysis: (1) genetic variants must exhibit a strong association with the exposure; (2) genetic variants must be independent of confounders; (3) genetic variants must solely influence outcomes through the selected exposure, without involvement in other pathways. All the included data were derived from previously published GWAS summary data, for which ethical approval and informed consent were found in original studies. The overall design of our study is illustrated in Figure 1.
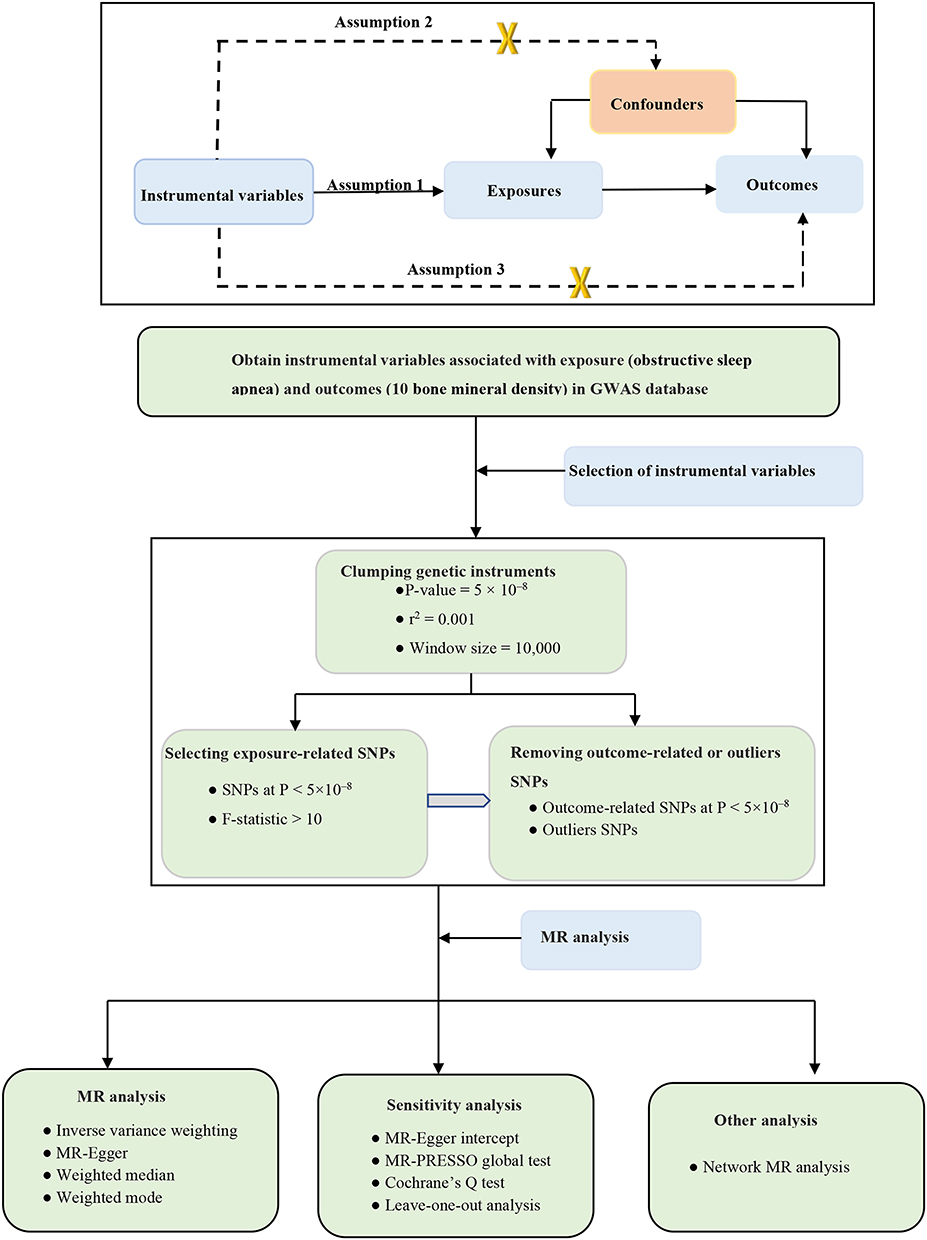 |
Figure 1 Overview and analysis process of our research. Assumption 1(the relevance assumption): genetic variants are strongly related to the exposure; Assumption 2(the Independence assumption): genetic variants are independent from confounding factors of the exposure–outcome; Assumption 3 (the exclusion assumption): genetic variants influence outcomes solely through the selected exposure. Abbreviations: MR, Mendelian randomization; GWAS, genome-wide association study; SNP, single-nucleotide polymorphism. |
Data Sources and Instrument Variables
GWAS for OSA
We obtained five single-nucleotide polymorphisms (SNPs) associated with OSA from the FinGen consortium in a published, large-scale GWAS study.16 The GWAS of OSA involved a substantial cohort of 16,761 OSA patients and 201,194 controls from the FinnGen research project (217, 955 subjects).16 OSA diagnosis relied on the International Statistical Classification of Diseases (ICD) codes (ICD-10: G47.3, R06.5; ICD-9:3472A), supplemented by subjective symptoms, clinical examination, and sleep monitors (AHI) ≥5/h or respiratory event index (RED) ≥5/h.
GWAS for Outcomes
To examine age-specific and site-specific Bone Mineral Density (BMD), we used summary-level data of BMD from different age-stages and skeletal sites. For the overall BMD, the total body BMD (TB-BMD) assessed by DXA was derived from a large meta-analysis of 30 GWAS studies (N = 66,628). This dataset covered five different age-stages: ≤15 years (N = 11,807), 15–30 years (N = 4180), 30–45 years (N = 10,062), 45–60 years (N = 18,805), ≥60 years (N = 22,504).17 For central BMD, femoral neck BMD (FN-BMD, N = 32,735) and lumbar spine BMD (LS-BMD, N = 28,498), assessed by DXA, were obtained from GEnetic Factors for OSteoporosis (GEFOS) Consortium.18 For peripheral BMD, summary statistics for forearm BMD (FA-BMD, N = 19,705) measured by single-energy X-ray absorptiometry (SXA) was derived from a Norwegian large-scale GWAS,19 while heel BMD (H-BMD, N = 142,487) dataset estimated by quantitative ultrasound was from the UK biobank cohort.20 More details about the datasets utilized in our study are presented in Table 1.
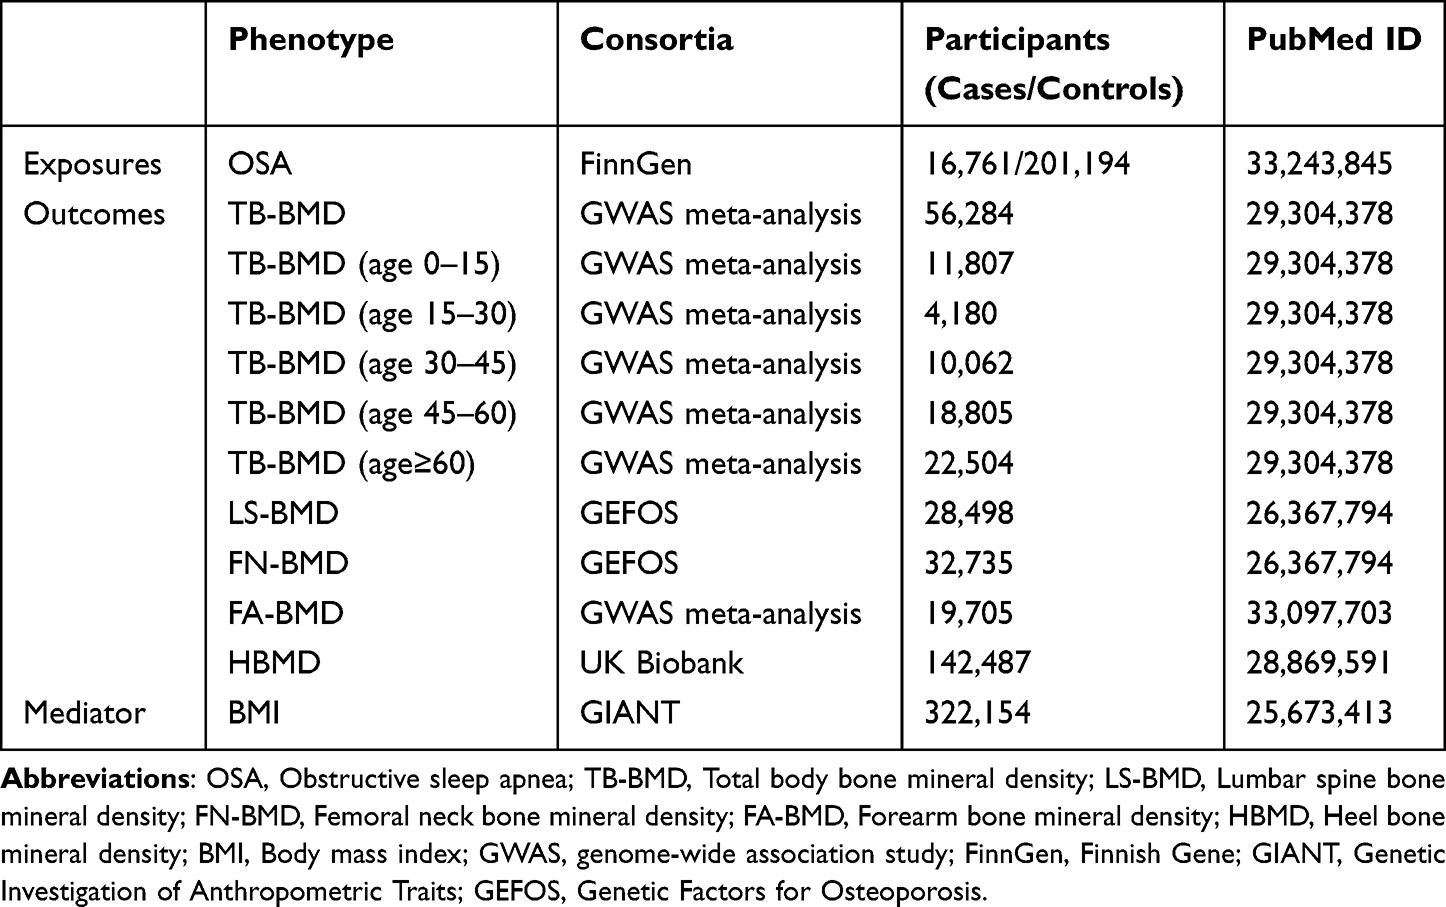 |
Table 1 Characteristics of GWAS Databases for Each Phenotype Used in Our Study |
GWAS for BMI
To investigate the mediation effect between BMI, OSA, and BMD, we obtained genetic instruments for BMI from publicly available GWAS summary statistics offered by the Genetic Investigation of Anthropometric Traits (GIANT) consortium.21 These statistics included 339,224 individuals of European ancestry. BMI was calculated by dividing total body weight [kg] by squared height [m2], with age, age squared, and other covariates taken into account.
Instrumental Variable Selection
To fulfill the three core MR assumptions, we initially identified genetic instruments with OSA at genome-wide significance (p < 5 × 10⁻⁸) and removed SNPs with linkage disequilibrium (r2 > 0.001 and clumping window <10,000 kb) based on the European 1000 Genomes as linkage disequilibrium (LD) reference panel. Furthermore, to evaluate the strength of the included genetic instruments, we calculated the F-statistics using the following formula: F = β2/σ2 (β: beta for SNP-exposure effect estimate, σ: standard deviation for variant).22 An F-statistic < 10 indicated a weak association instrument and excluded from subsequent MR analyses.
After harmonizing exposure and outcome data, we further filtered out palindromic SNPs with intermediate allele frequencies, and SNPs strongly associated with the outcome (P < 5 × 10⁻⁸).
Statistical Analysis
Main MR Analyses
The multiplicative random-effect inverse-variance weighted (IVW) models selected as the primary MR analyses were performed to explore the causal relationships of genetically predicted OSA with BMD. The method provides the most precise estimates, but may introduce bias in the presence of invalid SNPs and pleiotropy.23 Thus, we additionally conducted three complementary analyses, including MR-Egger regression,22 weighted median,24 and weighted mode.25 The MR-Egger regression can also provide accurate estimates allowing for the presence of directional pleiotropy.25 The weighted median method estimates causal effects when over 50% of instrumental variables are invalid.24 The weighted mode method can provide consistent estimates, even when most of the SNPs are invalid.23
Network MR Analyses
Given the interconnected relationships among BMI, OSA, and BMD,2,26 we performed network MR analysis. The network MR consists of three estimates:27 the total effect (c): reflecting MR analysis from exposure to mediator; the direct effect (a): representing MR analysis from exposure to mediator; the direct effect (b): signifying MR analysis from mediator to outcome; mediation effect: a*b. Consequently, the proportion of mediation effect equals the indirect effect (a*b) divided by the total effect (c).
Sensitivity Analyses
To ensure the robustness and validity of our MR results, we further conducted several sensitivity analyses. The MR-Pleiotropy Residual Sum and Outlier method (MR-PRESSO) was applied to identify and correct for horizontal pleiotropic outliers of SNPs, subsequently obtaining the corrected results after excluding possible outliers.28 MR-Egger regression was used to detect possible directional pleiotropy based on its intercept.25 To detect heterogeneity among estimates, we used Cochran’s Q value, with a p < 0.05 indicating the presence of heterogeneity.29 Additionally, we conducted a leave-one-out analysis to assess the individual SNP’s significant influence on the results.
Furthermore, we conducted a post hoc power analysis using the online tool (https://sb452.shinyapps.io/power/) to (Supplementary Table S1) to evaluate the statistical power of our MR analyses. All MR analyses were performed using “TwoSampleMR”, and “MR-PRESSO” in R software (version.4.2.0). A p value of < 0.05 was considered statistically significant.
Results
Causal Effects of OSA on BMD
After performing clumping and linkage disequilibrium, a total of 5 OSA-associated were identified. The F-statistics for these SNPs varied from 30 to 67, suggesting strong instruments. Detailed information about the IVs is available in Supplementary Table S2.
All results regarding the causal estimates for OSA on BMD are shown in Supplementary Table 2. The main MR analyses (IVW method) showed genetically predicted OSA was positively associated with an increase in both FA-BMD (β = 0.24, 95% CI: 0.06–0.41, p = 0.009) and HBMD (β=0.10, 95% CI = 0.02–0.18, p = 0.018). However, no significant causal relationships were observed between genetically predicted OSA and other BMD (all p > 0.05), including TB-BMD, LS-BMD, and FN-BMD (Figure 2 and Supplementary Table S3 and Figures S1)
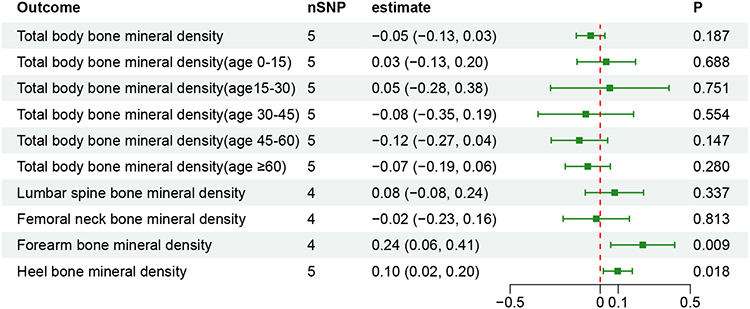 |
Figure 2 Mendelian randomization estimates for the associations of obstructive sleep apnea on bone mineral density. |
In sensitivity analyses, MR Egger intercept test provided no evidence of directional pleiotropy. The MR-PRESSO test did not detect any outliers or horizontal pleiotropy (all global P > 0.05). The Cochran Q-test detected that there may be some heterogeneity across the estimates of OSA on HBMD (Q test = 15.09, p = 0.005). Finally, leave-one-out analyses showed that the causal estimates remained stable after excluding any individual SNP (Supplementary Table S4 and Supplementary Figures S2).
Network MR Analyses
We conducted an analysis considering BMI as a mediator in the causal pathway from OSA to BMD (Figure 3). Genetically predicted BMI was positively associated with HBMD (IVW: β = 0.09, p = 0.007) and FA-BMD (IVW: β = 0.19, p = 0.005), but genetically predicted OSA was not associated with BMI (IVW: β= 0.04, p = 406). The total effect of OSA on HBMD was 0.10 and 0.24 for FA-BMD. Thus, the proportion of this effect mediated by BMI was 3.6% for the OSA-HBMD relationship and 3.2% for the OSA-FA-BMD relationship (Figure 3).
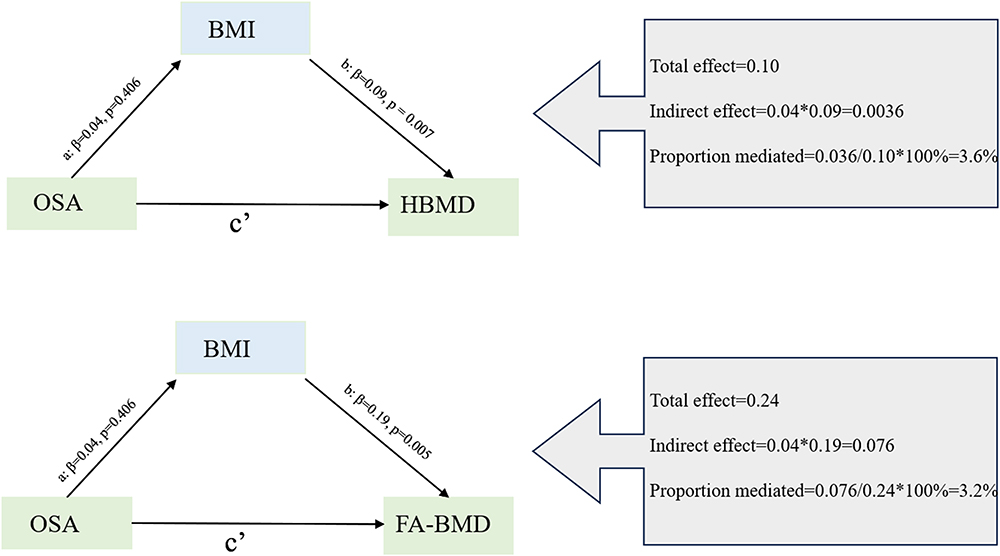 |
Figure 3 Network Mendelian randomization study regarding BMI is the mediator in the associations of OSA on FA-BMD and HBMD. Abbreviations: BMI, Body mass index; OSA, Obstructive sleep apnea; FA-BMD, Forearm bone mineral density; HBMD, Heel bone mineral density. |
We also examined OSA as a mediator in the causal pathway from BMI to BMD (Figure 4). Genetically predicted BMI was positively associated with OSA (IVW: β= 0.66, p < 0.001), HBMD (IVW: β= 0.09, p = 0.005), and FA-BMD (IVW: β= 0.19, p = 0.005). Thus, the proportion mediated by OSA was 73% and 84% for BMI and HBMD relationship and BMI and FA-BMD relationship, respectively.
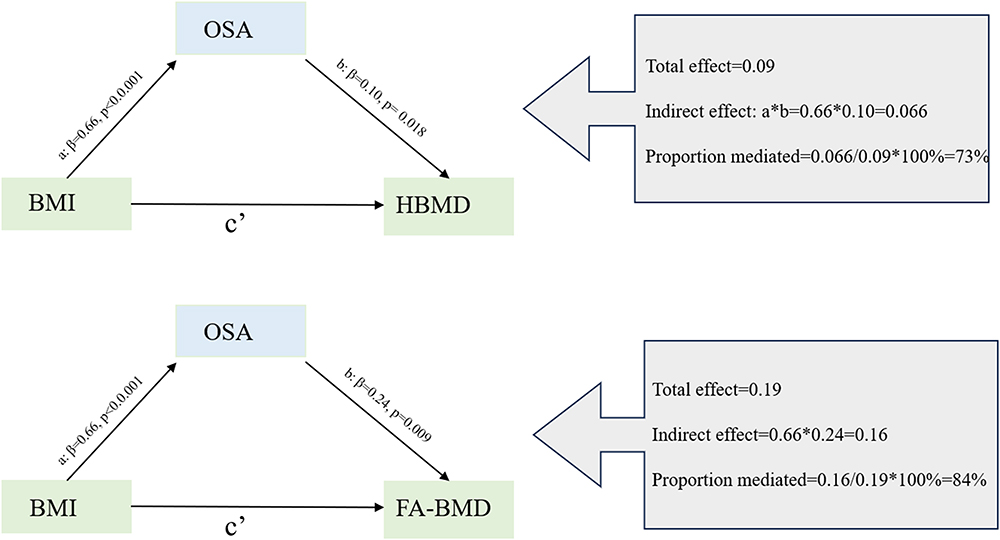 |
Figure 4 Network Mendelian randomization study regarding OSA is the mediator in the associations of BMI on FA-BMD and HBMD. Abbreviations: BMI, Body mass index; OSA, Obstructive sleep apnea; FA-BMD, Forearm bone mineral density; HBMD, Heel bone mineral density. |
Discussion
Previous observational studies have provided contradictory evidence concerning the relationship between OSA and BMD. Given that the exact causal associations of OSA with BMD have yet to be well established, we conducted an MR analysis to explore the causal relationships between OSA and BMD. Our findings showed that genetically predicted OSA was associated with a higher of FA-BMD and HBMD. To delve deeper into the role of BMI in these significant associations, we conducted a network MR analysis and found that OSA may act as a mediator in the relationship between BMI and BMD.
The association between OSA and BMI has long been a subject of interest. Some researchers have claimed that OSA was linked to reduced BMD,30,31 while others have not found any relationship between OSA and BMD.32 In contrast, a cross‑sectional study consisting of 85 subjects showed OSA patients had higher lumbar spine BMD compared to those without OSA.33 Another study including 833 elderly subjects revealed that OSA is associated with increased femoral and spinal BMD. Moreover, experimental studies showed that OSA-induced IH increased the BMD in a rat model.34 Consistent with these results, we also found that OSA was associated with elevated FA-BMD and HBMD. The conflicting results regarding associations between OSA and BMI may be due to confounding factors, such as study design, sample size, and skeletal differences in susceptibility to OSA. Therefore, our findings contribute to a clearer understanding of this relationship and may provide new clues for further research into the etiology of BMD.
Some possible mechanisms can explain the association between OSA and BMD. On the one hand, OSA can induce oxidative stress, sympathetic nervous system, and chronic inflammation, and then directly or indirectly promote osteoclast formation and alter its activity, disrupting the balance of bone metabolism.35,36 On the other hand, OSA-induced IH activated mesenchymal stem cells, upregulated hypoxia-inducible factor 1-alpha (HIF-1α), and stimulates the expression of vascular endothelial growth factor (VEGF). This results in alterations in the functions of both osteoblasts and osteoclasts, disturbing the balance between bone resorption and bone formation.5,37 Notably, the mechanisms through which OSA affects BMD are intricate and have not yet been fully understood. Therefore, further exploration is needed to unravel the specific biological pathways and mechanisms.
As widely recognized, BMI is a significant risk factor for OSA. Approximately 70% of patients with diagnosed OSA have a high BMI.38 BMI is closely considered to be associated with BMD. Epidemiological research has consistently shown there is a significant positive relationship between BMI and BMD.39,40 Recent MR study also supported a positive causal association between BMI and BMD.41 Another MR studies from Song et al reported BMI was causally associated with higher HBMD.26 Accordingly, OSA and BMD may share common risk factors. To clarify their interrelationship, we performed a network MR analysis, revealing that BMI may mediate the regulation of BMD by OSA. In fact, it is not confounding that OSA acts as a mediator when examining the relationship between BMI and BMD. Previous study has proven that high BMI can directly or indirectly lead to OSA through chronic inflammatory, fat deposition in the upper airway caused by obesity.2 We can speculate that high BMI induces OSA, which then plays a pivotal role in altering BMD via OSA-related IH. Herein, our findings may provide new insights to explore pathophysiological mechanisms connecting BMI and BMD.
Strengths and Limitations
To the best of our knowledge, this study represents the first comprehensive MR investigation into the causal impact of OSA on BMD, combining different methods used to obtain a robust result, and shedding new light on the etiology of BMD.
However, there are several limitations to our study that warrant attention. Firstly, to minimize potential biases stemming from different populations, our MR analysis was only based on the European population, so whether the findings can simply broaden generalizability to other ancestry requires further investigation. Secondly, limited to the lack of relevant GWAS summary data, we could not explore the effect of OSA stratification, gender stratification, or BMI stratification on BMD. Thirdly, it is preferable to minimize sample overlap between exposure and outcome databases. Unfortunately, we cannot estimate precisely the extent of sample overlap due to lack of detailed information on GWAS databases, which may introduce bias into our results. Finally, given the inherent limitations of MR studies, despite our efforts to detect pleiotropy and heterogeneity through sensitivity analyses, it remains impossible to entirely rule out potential pleiotropy that might bias our results. Given the limitations, further studies are essential to explore the potential mechanisms of these causal associations.
Conclusions
The present study provides evidence supporting that genetically predicted OSA was causally associated with higher forearm BMD and heel BMD. Moreover, network MR suggests that OSA might be a part of the mechanism through which BMI affects forearm BMD and heel BMD. However, deeper insights into the potential mechanisms behind these causal relationships still require further research.
Data Sharing Statement
All data are publicly available GWAS summary data. This data can be found at open GWAS (https://gwas.mrcieu.ac.uk/) and GEFOS Consortium (http://www.gefos.org/).
Ethics Declaration
All genome-wide association studies included in this study had been approved by a relevant review board, and participants had provided written informed consent. The study had also been approved by Zhongshan Boai hospital’s ethics committee.
Acknowledgments
The authors are grateful to the authors of the original studies for sharing the genome-wide association studies (GWASs) summary statistics in the present study.
Disclosure
The authors declared no conflict of interest.
References
1. Benjafield AV, Ayas NT. Estimation of the global prevalence and burden of obstructive sleep apnoea: a literature-based analysis. Lancet Respir Med. 2019;7(8):687–698. doi:10.1016/s2213-2600(19)30198-5
2. Lv R, Liu X. Pathophysiological mechanisms and therapeutic approaches in obstructive sleep apnea syndrome. Sig Transd Tar Ther. 2023;8(1):218. doi:10.1038/s41392-023-01496-3
3. Maniaci A, Iannella G. Oxidative stress and inflammation biomarker expression in obstructive sleep apnea patients. J Clin Med. 2021;10:2.
4. Bone HG, Wagman RB. 10 years of denosumab treatment in postmenopausal women with osteoporosis: results from the Phase 3 randomised FREEDOM trial and open-label extension. Lancet Diabetes Endocrinol. 2017;5(7):513–523. doi:10.1016/s2213-8587(17)30138-9
5. Vilovic M, Dogas Z. Bone metabolism parameters and inactive matrix Gla protein in patients with obstructive sleep apnea†. Sleep. 2020;43(3). doi:10.1093/sleep/zsz243
6. Eastell R, O’Neill TW. Postmenopausal osteoporosis. Nat Rev Dis Prim. 2016;2(16069). doi:10.1038/nrdp.2016.69
7. Haseltine KN, Chukir T. Bone mineral density: clinical relevance and quantitative assessment. J Nucl Med. 2021;62(4):446–454. doi:10.2967/jnumed.120.256180
8. Wang C, Zhang Z. Relationship between obstructive sleep apnea-hypopnea syndrome and osteoporosis adults: a systematic review and meta-analysis. Front Endocrinol. 2022;13(1013771). doi:10.3389/fendo.2022.1013771
9. Upala S, Sanguankeo A, Congrete S. Association between obstructive sleep apnea and osteoporosis: a systematic review and meta-analysis. Int J Endocrinol Metabol. 2016;14(3):e36317. doi:10.5812/ijem.36317
10. Upala S, Sanguankeo A, Congrete S. Obstructive sleep apnea is not associated with an increased risk of osteoporosis: a systematic review and meta-analysis. J Clin Sleep Med. 2015;11(9):1069–1070. doi:10.5664/jcsm.5032
11. Emdin CA, Khera AV, Kathiresan S. Mendelian Randomization. JAMA. 2017;318(19):1925–1926. doi:10.1001/jama.2017.17219
12. Lawlor DA, Harbord RM, Sterne JA, Timpson N. Mendelian randomization: using genes as instruments for making causal inferences in epidemiology. Statis Med. 2008;27(8):1133–1163. doi:10.1002/sim.3034
13. Davies NM, Holmes MV. Reading Mendelian randomisation studies: a guide, glossary, and checklist for clinicians. BMJ. 2018;362:k601. doi:10.1136/bmj.k601
14. Chen J, Zhang J. Association of sleep traits and heel bone mineral density: observational and Mendelian randomization studies. J Bone Miner Res. 2021;36(11):2184–2192. doi:10.1002/jbmr.4406
15. Skrivankova VW, Richmond RC. Strengthening the reporting of observational studies in epidemiology using Mendelian randomization: the STROBE-MR statement. JAMA. 2021;326(16):1614–1621. doi:10.1001/jama.2021.18236
16. Strausz S, Ruotsalainen S. Genetic analysis of obstructive sleep apnoea discovers a strong association with cardiometabolic health. Euro Respir J. 2021;57(5). doi:10.1183/13993003.03091-2020
17. Medina-Gomez C, Kemp JP. Life-course genome-wide association study meta-analysis of total body BMD and assessment of age-specific effects. Am J Human Gene. 2018;102(1):88–102. doi:10.1016/j.ajhg.2017.12.005
18. Zheng HF, Forgetta V. Whole-genome sequencing identifies EN1 as a determinant of bone density and fracture. Nature. 2015;526(7571):112–117. doi:10.1038/nature14878
19. Surakka I, Fritsche LG. MEPE loss-of-function variant associates with decreased bone mineral density and increased fracture risk. Nat Commun. 2020;11(1):4093. doi:10.1038/s41467-020-17315-0
20. Morris JA, Kemp JP. An atlas of genetic influences on osteoporosis in humans and mice. Nat Gene. 2019;51(2):258–266. doi:10.1038/s41588-018-0302-x
21. Locke AE, Kahali B. Genetic studies of body mass index yield new insights for obesity biology. Nature. 2015;518(7538):197–206. doi:10.1038/nature14177
22. Bowden J, Del Greco MF, Minelli C. Assessing the suitability of summary data for two-sample Mendelian randomization analyses using MR-Egger regression: the role of the I2 statistic. Int J Epidemiol. 2016;45(6):1961–1974. doi:10.1093/ije/dyw220
23. Burgess S, Butterworth A, Thompson SG. Mendelian randomization analysis with multiple genetic variants using summarized data. Gene Epidemiol. 2013;37(7):658–665. doi:10.1002/gepi.21758
24. Burgess S, Bowden J, Fall T, Ingelsson E, Thompson SG. Sensitivity analyses for robust causal inference from Mendelian randomization analyses with multiple genetic variants. Epidemiology. 2017;28(1):30–42. doi:10.1097/ede.0000000000000559
25. Bowden J, Davey Smith G, Burgess S. Mendelian randomization with invalid instruments: effect estimation and bias detection through Egger regression. Int J Epidemiol. 2015;44(2):512–525. doi:10.1093/ije/dyv080
26. Song J, Zhang R, Lv L, et al. The relationship between body mass index and bone mineral density: a Mendelian randomization study. Calcif Tissue Int. 2020;107(5):440–445. doi:10.1007/s00223-020-00736-w
27. Carter AR, Sanderson E, Hammerton G. Mendelian randomisation for mediation analysis: current methods and challenges for implementation. Euro J Epidemiol. 2021;36(5):465–478. doi:10.1007/s10654-021-00757-1
28. Verbanck M, Chen CY, Neale B, Do R. Detection of widespread horizontal pleiotropy in causal relationships inferred from Mendelian randomization between complex traits and diseases. Nat Gene. 2018;50(5):693–698. doi:10.1038/s41588-018-0099-7
29. Bowden J, Davey Smith G, Haycock PC, Burgess S. Consistent estimation in Mendelian randomization with some invalid instruments using a weighted median estimator. Gene Epidemiol. 2016;40(4):304–314. doi:10.1002/gepi.21965
30. Terzi R, Yılmaz Z. Bone mineral density and changes in bone metabolism in patients with obstructive sleep apnea syndrome. J Bone Mineral Metabol. 2016;34(4):475–481. doi:10.1007/s00774-015-0691-1
31. Uzkeser H, Yildirim K, Aktan B. Bone mineral density in patients with obstructive sleep apnea syndrome. Sleep Breath. 2013;17(1):339–342. doi:10.1007/s11325-012-0698-y
32. Mariani S, Fiore D, Varone L. Obstructive sleep apnea and bone mineral density in obese patients. Diabetes Metabol Synd Obesity. 2012;5:395–401. doi:10.2147/dmso.S37761
33. Zhao JM, Wang BY, Huang JF. Assessment of bone mineral density and bone metabolism in young men with obstructive sleep apnea: a cross-sectional study. BMC Musculoskel Disorders. 2022;23(1):682. doi:10.1186/s12891-022-05644-8
34. Oishi S, Shimizu Y, Hosomichi J. Intermittent hypoxia induces disturbances in craniofacial growth and defects in craniofacial morphology. Arch Oral Biol. 2016;61:115–124. doi:10.1016/j.archoralbio.2015.10.017
35. Bai XC, Lu D. Oxidative stress inhibits osteoblastic differentiation of bone cells by ERK and NF-kappaB. Biochem Biophys Res Commun. 2004;314(1):197–207. doi:10.1016/j.bbrc.2003.12.073
36. Swanson CM, Shea SA, Stone KL. Obstructive sleep apnea and metabolic bone disease: insights into the relationship between bone and sleep. J Bone Mineral Res. 2015;30(2):199–211. doi:10.1002/jbmr.2446
37. Guner I, Uzun DD, Yaman MO. The effect of chronic long-term intermittent hypobaric hypoxia on bone mineral density in rats: role of nitric oxide. Biol Trace Element Res. 2013;154(2):262–267. doi:10.1007/s12011-013-9722-8
38. Chen W, Feng J, Wang Y, Wang C, Dong Z. Development and validation of a nomogram for predicting obstructive sleep apnea in bariatric surgery candidates. Nat Sci Sleep. 2021;13:1013–1023. doi:10.2147/nss.S316674
39. Ouyang Y, Quan Y, Guo C. Saturation effect of body mass index on bone mineral density in adolescents of different ages: a population-based study. Front Endocrinol. 2022;13(922903). doi:10.3389/fendo.2022.922903
40. Gkastaris K, Goulis DG, Potoupnis M, Anastasilakis AD. Obesity, osteoporosis and bone metabolism. J Musculoskel Neuronal Interact. 2020;20(3):372–381.
41. Ma W, Zhou X, Huang X, Xiong Y. Causal relationship between body mass index, type 2 diabetes and bone mineral density: Mendelian randomization. PLoS One. 2023;18(10):e0290530. doi:10.1371/journal.pone.0290530
 © 2024 The Author(s). This work is published and licensed by Dove Medical Press Limited. The full terms of this license are available at https://www.dovepress.com/terms.php and incorporate the Creative Commons Attribution - Non Commercial (unported, v3.0) License.
By accessing the work you hereby accept the Terms. Non-commercial uses of the work are permitted without any further permission from Dove Medical Press Limited, provided the work is properly attributed. For permission for commercial use of this work, please see paragraphs 4.2 and 5 of our Terms.
© 2024 The Author(s). This work is published and licensed by Dove Medical Press Limited. The full terms of this license are available at https://www.dovepress.com/terms.php and incorporate the Creative Commons Attribution - Non Commercial (unported, v3.0) License.
By accessing the work you hereby accept the Terms. Non-commercial uses of the work are permitted without any further permission from Dove Medical Press Limited, provided the work is properly attributed. For permission for commercial use of this work, please see paragraphs 4.2 and 5 of our Terms.