")
Back to Journals » International Journal of Women's Health » Volume 14
Characteristics of the Gut Microbiota in Japanese Patients with Premenstrual Syndrome
Authors Okuma K , Kono K , Otaka M , Ebara A , Odachi A , Tokuno H , Masuyama H
Received 1 June 2022
Accepted for publication 8 September 2022
Published 29 September 2022 Volume 2022:14 Pages 1435—1445
DOI https://doi.org/10.2147/IJWH.S377066
Checked for plagiarism Yes
Review by Single anonymous peer review
Peer reviewer comments 3
Editor who approved publication: Professor Elie Al-Chaer
Kana Okuma, Kanako Kono, Machiko Otaka, Aya Ebara, Ayano Odachi, Hidetaka Tokuno, Hiroaki Masuyama
Research and Development Division, Symbiosis Solutions Inc, Chiyoda-ku, Tokyo, 101-0064, Japan
Correspondence: Hiroaki Masuyama, Research and Development Division, Symbiosis Solutions Inc, 3F, VORT Suidobashi III Bldg, 2-8-11 Kandasarugakucho, Chiyoda-ku, Tokyo, 101-0064, Japan, Tel +81-3-6275-0878, Fax +81-3-6275-0879, Email [email protected]
Purpose: The present study aimed to characterize the gut microbiota of individuals with premenstrual syndrome.
Patients and Methods: The gut microbiota of 24 Japanese women with PMS (PMS group) and 144 healthy Japanese women (control group) were compared. Analysis of the α- and β-diversities and the gut microbial composition at the genus level were performed using 16S rRNA gene sequence data obtained from stool samples.
Results: A significant difference in age was observed between the PMS and control groups; however, no significant difference was observed in BMI. The α-diversity measured using the Simpson index was significantly higher in the PMS group than the control group. Visualization of the β-diversity using non-metric multidimensional scaling and permutational multivariate analysis of variance (PERMANOVA) showed that the distance of the gut microbiota between the PMS and control groups is significantly different. Furthermore, a significant difference in the composition of the gut microbiota was observed between the PMS and control groups. At the genus level, the abundances of Collinsella, Bifidobacterium, and Blautia were significantly higher in the PMS group than in the control group. In particular, the abundance of Collinsella in the PMS group was approximately 4.5 times higher than that in the control group. To rule out the confounding effect of age in the abundances of Bifidobacterium, Blautia, and Collinsella, the gut microbiota of the PMS and control groups were compared by age group. Results showed that Collinsella had the highest effect size in participants of 30– 40 years of age (mean age: 36.39 ± 4.68 years).
Conclusion: These results suggest that the PMS group possesses a characteristic gut microbiota. In particular, Collinsella was strongly associated with PMS. Since Collinsella has been reported to be associated with diet, dietary interventions such as prebiotics targeting Collinsella may be effective in preventing, improving, and alleviating PMS.
Keywords: gut microbiota, 16S rRNA, premenstrual syndrome, Collinsella
Introduction
Premenstrual syndrome (PMS) is a condition that occurs 3–10 days before menstruation and may continue for several months, with the disorder disappearing with the onset of menstruation, causing depression, outbursts of anger, irritability, anxiety, confusion, and social withdrawal.1 Physical symptoms include tenderness or swelling of the breast, abdominal distension, headache, joint pain or muscle pain, weight gain, and swelling or edema of limbs.1 PMS is thought to be caused by the changes in female hormones,2 abnormalities in neurotransmitters such as serotonin,3 and eating habits;4,5 however, the exact cause is unknown.6
In Japan, diuretics are used as symptomatic treatments for edema and tenderness of the breast, analgesics for pain such as headache and joint pain, and Kampo medicines (traditional Japanese medicine) for various symptoms. Furthermore, counseling, diet therapy, lifestyle-related improvement, and exercise therapy are also performed as non-drug treatment method. Therapy with low-dose oral hormone preparations has been reported to improve physical symptoms; however, their effectiveness to psychological symptoms may not be confirmed depending on the types of combination tablets. On the other hand, combination tablets improve premenstrual dysphoric disorder, but the effect is unclear.7 Selective serotonin reuptake inhibitors may be prescribed for patients with PMS, with severe psychological symptoms.8,9
In recent years, the relationship between the gut microbiota and various diseases has attracted scientific attention, and studies in this field have been actively performed. Studies have reported that the gut microbiota of patients with gastrointestinal inflammatory diseases,10 allergies,11–13 autoimmune diseases,14,15 lifestyle-related diseases such as obesity and diabetes,16–18 liver diseases,19–22 heart diseases,23,24 cancer,25,26 and neurological/mental illness27–29 are characteristically different from that of healthy people. Studies have also clarified that the characteristics of the human gut microbiota are influenced by several factors, such as age, sex, and dietary habits of the hosts.30–32 Polycystic ovarian syndrome (PCOS), a gynecological disease like PMS, has been reported to be associated with Bifidobacterium,33 and uterine fibroids with Pseudomonas stutzeri and Prevotella amnii.34 This led us to consider that PMS, which is thought to be caused by female hormones35 and diet36–38 may also be associated with the gut microbiota, like other diseases.
Since research on the relationship between PMS and gut microbiota has not progressed, we aimed to characterize of the gut microbiota of individuals with PMS. We believe that showing the relationship between PMS and the gut microbiota will elucidate the mechanism underlying PMS and propose treatment methods.
Materials and Methods
Study Population
Among the subjects selected using the gut microbiota examination and analysis services by Symbiosis Solutions Inc. (Tokyo, Japan), we used the data of 63 women aged 24 to 49 years living in Japan who were diagnosed with PMS by a doctor (database 1). Written informed consent was obtained from all subjects. All experimental procedures complied with the principles of the Declaration of Helsinki and were approved by the Institutional Review Board of Shiba Palace Clinic (Tokyo, Japan) (Approval No.: 145968_rn-29,327). Stool samples were obtained from the subjects from February 2021 to November 2021. At the same time, background information, including age, gender, height, weight, pregnancy and nursing status, use of antibiotics and enemas, and disease status, was collected by subject’s self-reported information using a questionnaire. Furthermore, we also utilized the data collected by the former Benno Laboratory, RIKEN Cluster for Science, Technology and Innovation Hub (Wako, Saitama, Japan) and analyzed by the Japan Agricultural Frontier Development Organization (Tokyo, Japan) (database 2). The use of all datasets has been authorized by the above-mentioned organizations. The subjects for analysis were determined from both databases according to the following screening criteria. The inclusion criteria were women between the ages of 24 and 49, in line with the age range of PMS patients in database 1. Sixty-three subjects in database 1 and 4197 subjects in database 2 met the inclusion criteria. Those who did not consent to the study, had insufficient gut microbiota data, are currently pregnant or nursing, recently took antibiotics (≤1 week), are non-Japanese, with enema stool, or were suspected to have a non-PMS disease were excluded from this study. Of the subjects that passed the criteria, those with PMS were labeled as the PMS group, and those without PMS were labeled as the control group.
Stool Sample Collection, DNA Extraction, and Sequencing
The participants provided their own stool specimens collected immediately after defecation using a stool collection kit (TechnoSuruga Labs, Inc., Shizuoka, Japan). Stool specimens (approximately 4 mg) were suspended in guanidine thiocyanate (GTC) solution (100 mM Tris-HCL (pH 8.0), 40 mM Tris-EDTA (pH 9.0), 4 M guanidine thiocyanate, 0.001% bromothymol blue), and then the samples were transported at room temperature (22–25 °C). Then, 400 mg of glass beads, 100 µL of 10% SDS, and 600 µL of TE saturated phenol/chloroform solution (phenol:chloroform = 1:1) were added to the sample, crushed at 2500 rpm for 2 min using a bead crusher (PMT Corporation, Fukuoka, Japan), and incubated at 70 °C for 10 min. After repeating this procedure twice, the supernatant was separated via centrifugation at 12,000 rpm for 10 min. Then, 700 μL of isopropanol and 70 μL of 3 M sodium acetate solution were added to the supernatant. The mixture was stirred, centrifuged at 12,000 rpm for 10 min, and then the supernatant was removed. The precipitated DNA pellet was washed twice with 700 μL of 70% ethanol solution. Finally, the dried DNA pellet was dissolved in 100 µL of TE buffer.
The V1–V3 region of the bacterial 16S rRNA gene was sequenced. Briefly, the 16S rRNA gene sequence metagenomic library was prepared according to the Illumina 16S tag library preparation protocol (Illumina, San Diego, CA, USA). A fastq file was created using bcl2fastq ver. 2.20.0.422 (Illumina). Using the created fastq file, a demultiplexed fastq file was created using clsplitseq-0.2.2019.05.10 (https://github.com/astanabe/Claident), and the primer sequences were removed. Subsequently, DADA2 ver. 1.16 was used to filter reads, remove chimera, bind reads, and identify amplicon sequence variant (ASV) for each read. Each ASV was given a bacterial genus name using rdp_train_set_18 (https://zenodo.org/record/4310151#.Yg8oWOjP1PY). Coverage-based rarefying was performed using the rareslope and rrarefy functions implemented in the package vegan ver. 2.5.7 of R ver. 4.0.3.
Statistical Analysis
Continuous data was presented as mean and standard deviation (SD), and categorical data were presented as frequencies and percentages. The Welch t-test and Wilcoxon rank sum test were used to compare the data depending on data distribution. Data were analyzed using the statistical software R ver. 4.1.0. The Wilcoxon rank sum test was performed with correct = FALSE using the Wilcoxon test function of the statistical software R. The α-diversity of the gut microbiota was assessed using the Simpson index.
To compare the structural similarity of the gut microbiota of the two groups, we used non-metric multidimensional scaling (NMDS) based on the Bray-Curtis index to visualize the similarity between samples and used PERMANOVA analysis for the dispersion test.39,40 For NMDS, we used the metaMDS function from the R ver. 4.1.0 vegan ver. 2.5–7 package. For PERMANOVA, we used the vegan 2.5–7 adonis function with permutations = 9999. The ANOVA function of PERMANOVA was performed using the betadisper function of vegan 2.5–7 and the ANOVA function of the stats package.
Comparison of the gut microbiota at the genus level was performed using the R package ALDEx2 ver. 1.26.0. For this comparison, the abundance count data converted into a concentric logarithmic ratio (clr conversion) was used. For clr conversion, the aldex.clr function of ALDEx2 was used, with mc.samples = 128 and denom = “all” set as arguments. The Wilcoxon rank sum test was performed using the aldex. t-test function of ALDEx2. The effect size was calculated using the aldex.effect function of ALDEx2. The statistical significance was set to a p-value of 0.05.
Results
Selection of the Study Population
This is a case-control study comparing PMS-affected patients (PMS group) with non-PMS-affected patients (control group). Subjects were determined according to screening criteria shown in Figure 1. As a result of the screening, 4092 subjects were excluded, and the data from 168 people (24 patients with PMS and 144 subjects in control group) were analyzed.
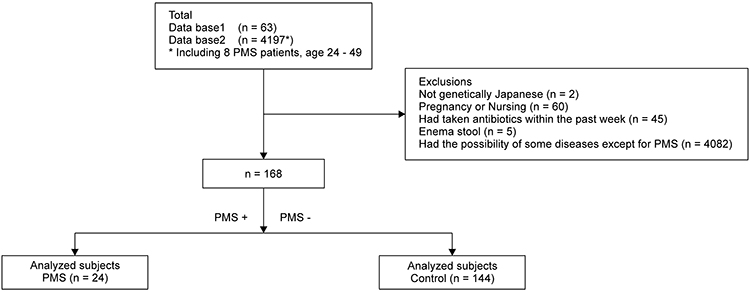 |
Figure 1 Subject screening (flow chart for target group selection). Database 1: Women aged 24 to 49 years living in Japan who suffer from PMS among the subjects selected by the gut microbiota examination and analysis services offered by Symbiosis Solutions. Database 2: Women aged 24 to 49 years in the same age range as those with PMS among the data analyzed by the Japan Agricultural Frontier Development Organization. |
A significant difference was observed in age between the PMS and control groups; however, no significant difference was observed in BMI (Table 1). Because the characteristics of the gut microbiota vary with age, analyses were performed for all subjects as well as by age groups (Supplementary Table 1).
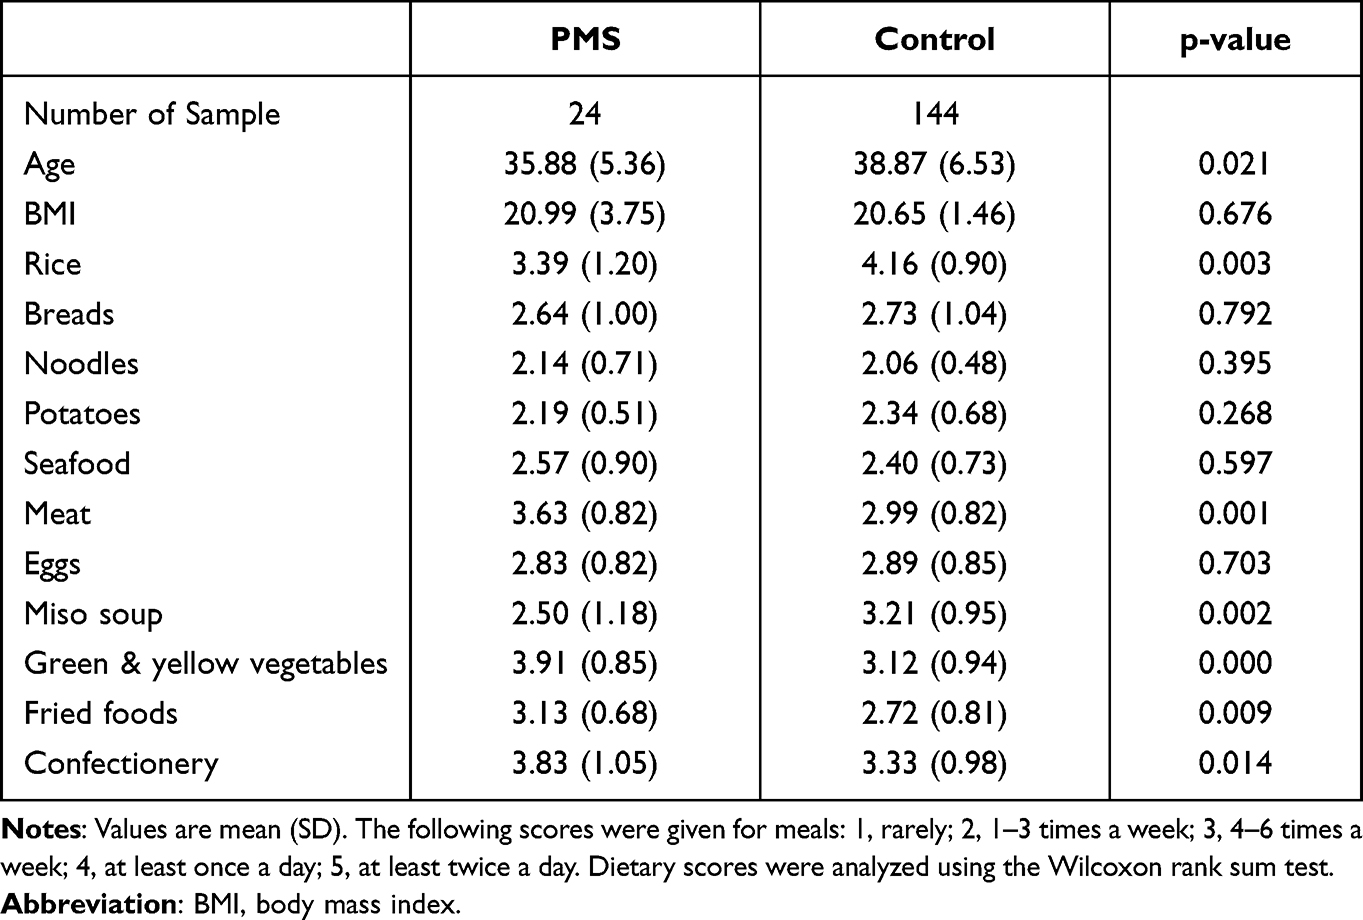 |
Table 1 Overview of Analysis Target Groups |
Comparison of the Gut Microbiota Between PMS and Control Groups
The composition of the gut microbiota between the two groups were analyzed using next-generation sequencing. The α- and β-diversities of each sample were analyzed. Results showed that at the genus level, the α-diversity measured using Simpson index was significantly higher in the PMS group than the control group (number of genera: p=0.002, Simpson index: p=0.028, Figure 2). However, Pielou’s index showed no significant difference (p=0.474 Figure 2).
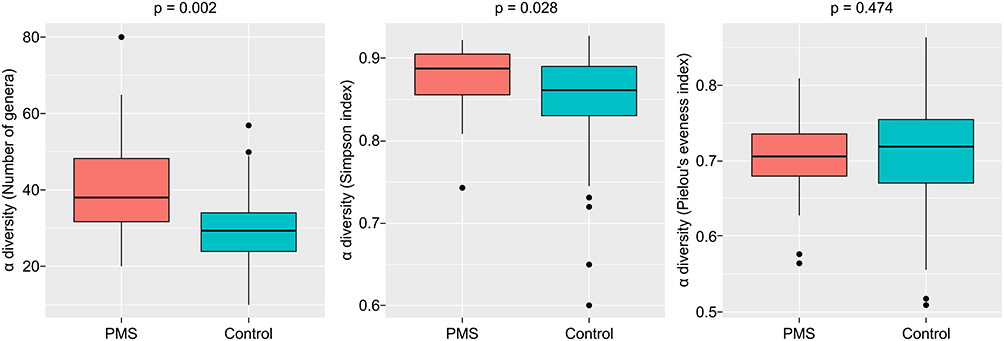 |
Figure 2 Comparison between the α-diversity of the PMS and control groups. Boxplot calculated using the Simpson indices of the two groups. Each plot shows outliers. A significant difference was observed between the groups at p <0.05. |
Visualization of β-diversity using NMDS showed that most of the PMS group was distributed in the low-density part (lower area) of the control group (Figure 3). Meanwhile, PERMANOVA showed a significant difference in the distance of the gut microbiota between the PMS and control groups (p <0.001, dispersion = 0.537, stress = 0.240). PerMANOVA is an analysis that produces unstable results when there is a difference in the number of samples in the two groups being compared and when the dispersion is different. Therefore, we performed the analysis with the numbers of PMS and control groups matched and found significant differences. (Supplementary Figure 1, p<0.0099, dispersion = 0.838, stress = 0.210).
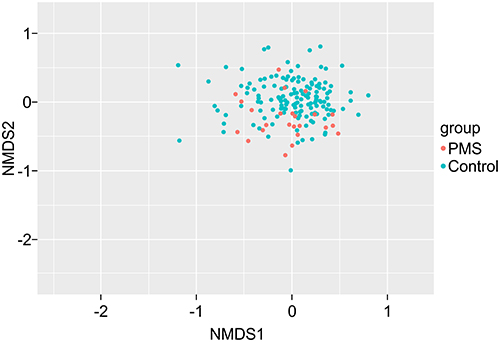 |
Figure 3 Comparison between the β-diversity of the PMS and control groups. The distance of the gut microbiota between the two groups was visualized using the NMDS method (stress = 0.240). Distances between samples were calculated using the Bray-Curtis index. A significant difference was observed between the groups at p <0.001 (dispersion=0.537). |
The composition of the gut microbiota at the genus level was compared between the two groups (Table 2, Supplementary Table 2. Results showed significant differences in the abundance of Bifidobacterium, Blautia, and Collinsella (Table 2). These genera were abundant in the PMS group, and the effect size was high (Figure 4). In particular, the relative abundance of Collinsella was approximately 4.5 times higher in the PMS group (3.96%) than that in the control group (0.88%) (Figure 5).
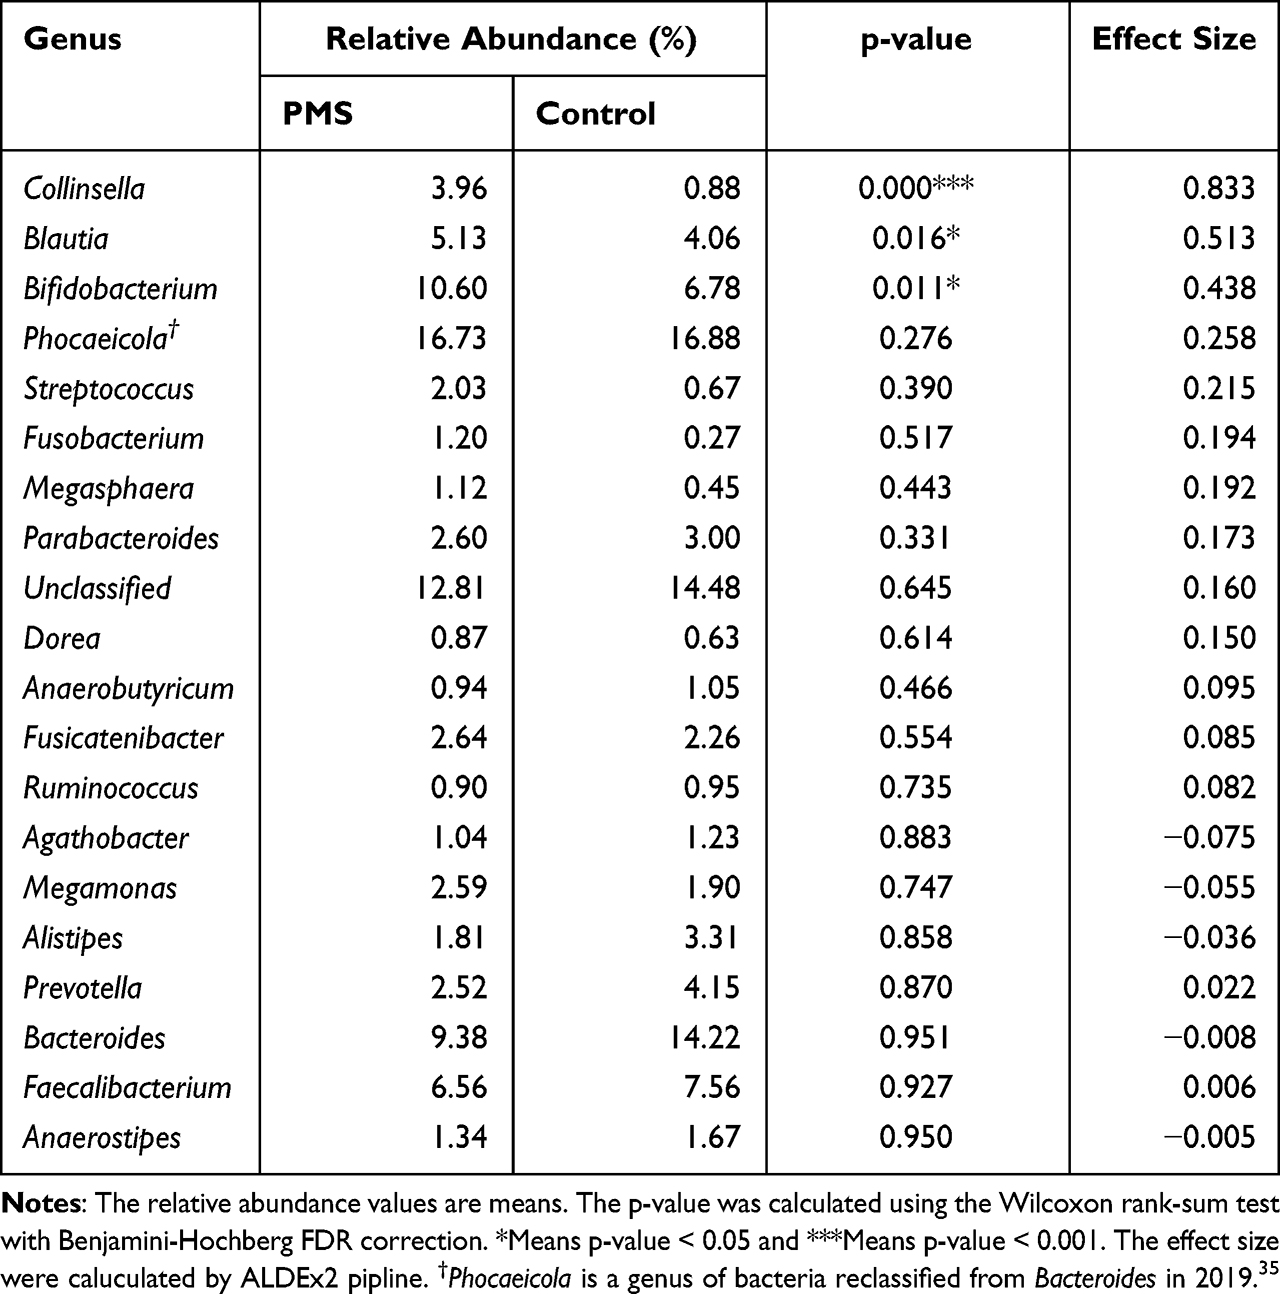 |
Table 2 Comparison of the Top 20 Bacteria Based on the Relative Abundance in the PMS and Control Groups |
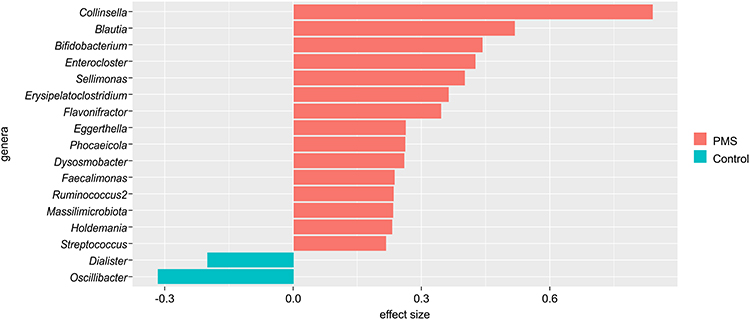 |
Figure 4 Significant differences in the gut microbial abundance at the genus level between the PMS and control groups. Genera whose absolute value of effect size calculated using the ALDEx2 pipeline was 0.2 or higher. The positive and negative effect sizes are the genera with high abundance in the PMS and control groups, respectively. |
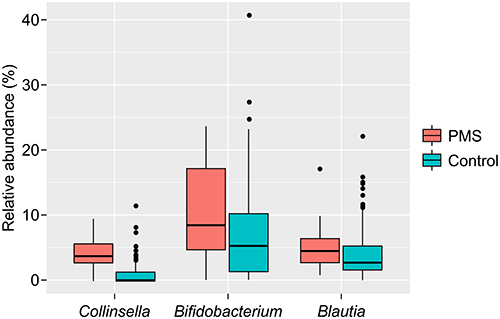 |
Figure 5 Box plot showing the genera with significant differences in abundance between the PMS and the control groups. The vertical axis shows the relative abundance, and each plot shows the outliers. |
To rule out the confounding effect of age in the abundances of Bifidobacterium, Blautia, and Collinsella, the gut microbiota of the PMS and control groups were compared by age groups (20s, 30s, and 40s) at the genus level. Since only one subject in the PMS group was in her 20s, analysis at this age group was not feasible (Supplementary Table 1). Meanwhile, results showed that Collinsella had the highest effect size in both 30s and 40s using the ALDEx2 pipeline (Supplementary Table 3).
Discussion
In this study, we found that, at the genus level, Bifidobacterium, Blautia, and Collinsella were characteristic intestinal bacteria in patients with PMS (Table 2). We also showed that the composition of the intestinal microbiota of patients with PMS differed from that of healthy subjects (Supplementary Table 2).
The composition of the gut microbiota of the PMS group had different characteristics from that of the control group. A significant difference in the α-diversity was observed, in which the PMS group had a higher α-diversity (Figure 2). Previous studies have reported lower α-diversity in patients with irritable bowel syndrome and nonalcoholic steatohepatitis;42,43 however, some studies reported high alpha diversity in irritable bowel syndrome.44 Thus, to understand the relationship between PMS and the gut microbiota, it is important to look not only at the results of α-diversity but also at the composition of the gut microbiota.
When PERMANOVA was used to compare the β-diversity between the PMS and control groups, the intergroup difference was significantly higher than the intragroup difference (Figure 3). This result indicates a significant difference in the composition of the gut microbiota between the two target groups. Furthermore, using the results visualized using NMDS, there was an area where both the PMS group and the control group were distributed. This indicates that there are subjects in the control group who have a similar gut microbiota composition with the PMS group. Although these subjects may not have developed PMS, they may be moving away from a healthy state.
At the genus level, Bifidobacterium, Blautia, and Collinsella were significantly different between the two groups and were significantly higher in the PMS group (Table 2). In addition, Collinsella in the PMS group was approximately 4.5 times higher than that in the control group. Furthermore, Collinsella had the highest effect size in both 30s and 40s (Supplementary Table 3), suggesting that it is a PMS-related gut bacteria regardless of age. Collinsella has been reported to be more abundant in patients with arteriosclerosis,45 more common in patients with hyperlipidemia/hypertension/type II diabetes patients,46 and is associated with non-alcoholic steatohepatitis.43
Recent studies have revealed that the composition of the gut microbiota is associated with various diseases; however, no association with PMS has been reported. This study not only suggested a link between PMS and the gut microbiota but also revealed that the gut microbiota may characterize individuals with PMS.
We believe that one of the causes of the exacerbation of emotional symptoms in PMS is a rapid change in the blood glucose level. Sugar temporarily raises blood sugar levels to calm an individual’s mood, but the subsequent steep decrease in blood sugar causes an unstable mood, which includes fatigue and depression.47 Bifidobacterium, Blautia, and Collinsella are all known to break down sugar to produce lactic acid. Therefore, these genera may be affected by changes in blood sugar.
Bifidobacterium, Blautia, and Collinsella are remarkably abundant in Japanese.48 A survey of Japanese women between the ages of 15 and 49 reported that 13,462 of 18,174 (74%) enstruating women had problems associated with menstruating symptoms.49 This survey used the Japanese version of the modified Menstrual Distress Questionnaire (mMDQ). The mMDQ includes questions for the six areas of PMS symptoms: pain, concentration, behavioral changes, autonomic nervous response, water retention, and negative emotions. On the other hand, in a study of Chinese women aged 18–45 years, 21.1% of the participants were concluded to have PMS.50 According to a report by Nishijima et al48 who investigated the gut microbiome of healthy individuals from 12 countries including Japan, Japanese had a higher abundances of Bifidobacterium, Blautia, Collinsella, and Streptococcus (17.93%, 16.69%, 3.01%, and 2.22%, respectively) than Chinese (0.54%, 2.18%, 0.06%, and 0.49%, respectively. It is unknown what percentage of the 74% of Japanese women with menstrual problems have PMS; however, given the higher prevalence of Bifidobacterium, Blautia, and Collinsella, which were suggested to be associated with PMS in this study, the percentage of PMS patients may also be higher than that in China (21.1%).
Further research is needed to clarify the relationship between PMS, gut microbiota, and diet. However, studies investigating the relationship between Collinsella and diet reported that animal proteins, such as lean meat and low dietary fiber diet, are associated with an increase in Collinsella.51,52 In recent years, intervention tests using plant-derived polyphenols in beverages have been actively conducted. Among them, a study in which red wine was ingested by patients with ischemic heart disease reported that the abundance of Collinsella after the intervention significantly decreased compared to pre-intervention.53 Moreover, in a study wherein mice ingested a high-fat/high-sucrose diet supplemented with polyphenols extracted from green tea or black tea, a decrease in Collinsella in the cecum in the diet group was observed compared to the group that ingested a polyphenol-free diet.54 An intervention study was conducted where individuals with PMS ingested dark chocolate.55 The study reported that dark chocolate, which contains complex carbohydrates, antioxidants, vitamin B6, unsaturated fatty acids, and minerals, reduced anxiety, malaise, and stomach cramps,- decreased lower back pain, and improved concentration and memory.55 Polyphenol is a general term for food components containing a plurality of phenol groups and has an antioxidant effect. It is abundant in plants, vegetables, fruits, and nuts, and has more than 8000 kinds. Polyphenols have antioxidant and anti-inflammatory effects, improve angiogenesis and vascular endothelial function, inhibit platelet aggregation, and reduce insulin resistance. Several studies have reported its use in preventing and treating cancer, hypertension, cardiovascular disease, type II diabetes, etc.56–59
As mentioned above, 74% of Japanese women have problems with menstrual symptoms, making PMS a major problem for modern women. The total annual economic loss due to menstrual symptoms was estimated to be 682.8 billion yen, based on outpatient costs (hospital, clinic, pharmacy, etc.) obtained by combining retail price data of over-The-counter drugs and work cost unit price data, over-The-counter drug usage, work productivity loss data and the Japanese female population.43 Furthermore, work productivity loss accounted for 71.9% of the economic loss.43 This indicates that many women suffer not only physical and mental burden but also financial loss due to menstrual symptoms, including PMS.
In addition, a study by Takeda et al on premenstrual disorders (PMDs) indicates that decreased levels of Butyricicoccus, Extibacter, Megasphaera, and Parabacteroides are associated with PMDs.60 This report was not consistent with the results of the present study, which showed that PMDs were associated with PMS, as well as with the symptoms that occur with non-ovulatory ovarian activity and are iatrogenically generated following hormone therapy.8 These differences in symptoms may account for the differences between the present study and the study by Takeda et al.
The present study suggests that Japanese women with PMS may have a characteristic gut microbiota. The development of prebiotics that can regulate gut microbiota and prevent, improve, or alleviate PMS will not only improve the quality of life of women but also reduce economic losses and support the advancement of society.
This study had limitations. Although we found that Bifidobacterium, Blautia, and Collinsella were associated with PMS, it was not possible to assess exactly how the physiological functions of the intestinal bacteria affect PMS. To support our hypothesis that rapid changes in blood glucose levels are one of the causes of worsening emotional symptoms of PMS, it is necessary to measure blood glucose levels. These three intestinal bacteria break down sugar to produce lactic acid. Therefore, it is possible that sugar metabolism and increased lactic acid production may be the cause of PMS. However, to determine whether these intestinal bacteria present in in the PMS group actually produce lactic acid, it is necessary to predict whether they have genes that produce lactic acid using PICRUSt or measure the amount of lactic acid produced using liquid-liquid chromatography-mass spectrometry (LC-MS). Analyzing metabolic pathways using the KEGG database is also important for metabolomics studies and prebiotic discovery.
Bifidobacterium produces acetic acid, folic acid, and gamma-aminobutyric acid, in addition to lactic acid. Blautia produces acetic acid, succinate, ethanol, and hydrogen, and Collinsella produces ethanol, formic acid, and hydrogen. Although these products other than lactate may be related to PMS, we did not include them in our discussion because our study focused on finding the gut bacteria associated with PMS. The PICRUSt, LC-MS, and KEGG databases could be used to identify the causes of PMS.
In addition, we were unable to fully consider the dietary associations of Bifidobacterium and Blautia compared to Collinsella. New discoveries may be made by conducting species-level analyses. Furthermore, Bifidobacterium and Blautia may be associated with significantly different diets in the PMS and control groups, as shown in Table 1. Whether the significantly different diets in Table 1 are altering the intestinal bacteria, resulting in the development or worsening of PMS, should be elucidated. It may be possible to conduct tests in subjects with controlled diets or measure markers that are influenced by diet, eg, blood pressure, cholesterol levels, and other bodily information and products of intestinal bacteria.
In addition, Collinsella and Bifidobacterium have been reported to be associated with PCOS.33 PCOS has been reported to be caused by increased secretion of androgens,61 suggesting that Collinsella and Bifidobacterium may be involved in the secretion of hormones.
The gut microbiota is reported to be affected by proton pump inhibitors and oral medications.62,63 In this study, we investigated the antibiotic medication history within the past week; however, we were unable to collect information on medication status prior to that time. It cannot be said that the results of this study completely rule out the effects of antibiotics, as it has been reported that it took 1.5 months to recover to pre-treatment gut bacterial composition after taking an antibiotic cocktail.64 It is also important to collect information on the history of secondary medications other than antibiotics, as PMS subjects are expected to use more analgesics and NSAIDs than the general population.
Changes in stools, such as constipation and diarrhea, may be observed around menstruation.65 These changes in stools are thought to be dependent on the menstrual cycle and hormone levels. Whether this is related to intestinal bacteria is unknown, but obtaining menstrual cycle and Bristol Scale would provide a deeper analysis. Other information on women aged 20–49 years who suffer from PMS may experience, such as pregnancy and childbirth, physical and social stress, alcohol consumption and smoking, caffeine intake, poor sleep quality, and change in physical activity, may help us to understand the relationship between PMS and life circumstances.
Conclusion
This study suggests a characteristic gut microbiota for individuals with PMS. In particular, Collinsella was strongly associated with PMS. Since Collinsella has also been reported to be associated with diet, dietary interventions such as prebiotics targeting Collinsella may be effective in preventing, improving, or alleviating PMS.
In this study, some patients in the PMS group had the same abundance of Collinsella as the control group. For such subjects, gut bacteria except for Collinsella, such as Bifidobacterium and Blautia, may be a factor in PMS.
Furthermore, subjects who do not have PMS but may be far from healthy has been suggested, we believe that analysis of individual gut microbiota and the understanding its composition and characteristics will lead to the prevention of PMS.
Data Sharing Statement
The data that support the findings of this study are available from Symbiosis Solutions Inc. but restrictions apply to the availability of these data, which were used under license for the current study, and so are not publicly available. Data are however available from the authors upon reasonable request and with permission of Symbiosis Solutions Inc.
Acknowledgments
We would like to express our sincere gratitude to the members of the former Benno Laboratory, RIKEN Cluster for Science, Technology and Innovation Hub, the Japan Agricultural Frontier Development Organization, and the Paradise International Co., Ltd., as well as the subjects who cooperated in the survey. The English proofreading was done by Editage.
Disclosure
The authors report no conflicts of interest in this work.
References
1. Japan Society of Obstetrics and Gynecology. Revised 4th Edition of Obstetrics and Gynecology Glossary. Japan Society of Obstetrics and Gynecology; 2011.
2. Rubinow DR, Schmidt PJ. Gonadal steroid regulation of mood: the lessons of premenstrual syndrome. Front Neuroendocrinol. 2006;27(2):210–216. doi:10.1016/j.yfrne.2006.02.003
3. Rapkin AJ, Edelmuth E, Chang LC, Reading AE, McGuire MT, Su TP. Whole-blood serotonin in premenstrual syndrome. Obstet Gynecol. 1987;70(4):533–537.
4. Nagata C, Hirokawa K, Shimizu N, Shimizu H. Soy, fat and other dietary factors in relation to premenstrual symptoms in Japanese women. BJOG. 2004;111(6):594–599. doi:10.1111/j.1471-0528.2004.00130.x
5. Farasati N, Siassi F, Koohdani F, Qorbani M, Abashzadeh K, Sotoudeh G. Western dietary pattern is related to premenstrual syndrome: a case–control study. Br J Nutr. 2015;114(12):2016–2021. doi:10.1017/S0007114515003943
6. Royal College of Obstetricians & Gynaecologists. Management of Premenstrual Syndrome: green-top Guideline No. 48. BJOG. 2017;124(3):e73–e105. doi:10.1111/1471-0528.14260
7. Japan Society of Obstetrics and Gynecology. Obstetrics and gynecology practice guidelines-gynecology outpatient edition 2020; 2020. Available from: https://www.jsog.or.jp/modules/about/index.php?content_id=16.
8. Dimmock PW, Wyatt KM, Jones PW, O’Brien PS. Efficacy of selective serotonin-reuptake inhibitors in premenstrual syndrome: a systematic review. Lancet. 2000;356(9236):1131–1136. doi:10.1016/S0140-6736(00)02754-9
9. Yonkers KA, Simoni MK. Premenstrual disorders. Am J Obstet Gynecol. 2018;218(1):68–74. doi:10.1016/j.ajog.2017.05.045
10. Larabi A, Barnich N, Nguyen HTT. New insights into the interplay between autophagy, gut microbiota and inflammatory responses in IBD. Autophagy. 2020;16(1):38–51. doi:10.1080/15548627.2019.1635384
11. Harata G, Kumar H, He F, et al. Probiotics modulate gut microbiota and health status in Japanese cedar pollinosis patients during the pollen season. Eur J Nutr. 2017;56:2245–2253. doi:10.1007/s00394-016-1264-3
12. Nomura A, Matsubara A, Goto S, et al. Relationship between gut microbiota composition and sensitization to inhaled allergens. Allergol Int. 2020;69(3):437–442. doi:10.1016/j.alit.2019.12.010
13. Harata G, Miyazawa K, Yoda K, Yamazaki K, He F, Hiramatsu M. Probiotics and Allergy. Arerugi. 2018;67(3):197–201. doi:10.15036/arerugi.67.197
14. De Luca F, Shoenfeld Y. The microbiome in autoimmune diseases. Clin Exp Immunol. 2019;195(1):74–85. doi:10.1111/cei.13158
15. Xu H, Liu M, Cao J, et al. The dynamic interplay between the gut microbiota and autoimmune diseases. J Immunol Res. 2019;2019:7546047. doi:10.1155/2019/7546047
16. Patterson E, Ryan PM, Cryan JF, et al. Gut microbiota, obesity and diabetes. Postgrad Med J. 2016;92(1087):286–300. doi:10.1136/postgradmedj-2015-133285
17. Gurung M, Li Z, You H, et al. Role of gut microbiota in type 2 diabetes pathophysiology. EBioMedicine. 2020;51:102590. doi:10.1016/j.ebiom.2019.11.051
18. Gérard P. Gut microbiota and obesity. Cell Mol Life Sci. 2016;73(1):147–162. doi:10.1007/s00018-015-2061-5
19. Albhaisi SAM, Bajaj JS, Sanyal AJ. Role of gut microbiota in liver disease. Am J Physiol Gastrointest Liver Physiol. 2020;318(1):G84–G98. doi:10.1152/ajpgi.00118.2019
20. Bajaj JS. Alcohol, liver disease and the gut microbiota. Nat Rev Gastroenterol Hepatol. 2019;16(4):235–246. doi:10.1038/s41575-018-0099-1
21. Safari Z, Gérard P. The links between the gut microbiome and non-alcoholic fatty liver disease (NAFLD). Cell Mol Life Sci. 2019;76(8):1541–1558. doi:10.1007/s00018-019-03011-w
22. Yang YJ, Ni YH. Gut microbiota and pediatric obesity/non-alcoholic fatty liver disease. J Formos Med Assoc. 2019;118(Suppl 1):S55–S61. doi:10.1016/j.jfma.2018.11.006
23. Jonsson AL, Bäckhed F. Role of gut microbiota in atherosclerosis. Nat Rev Cardiol. 2017;14(2):79–87. doi:10.1038/nrcardio.2016.183
24. Nagatomo Y, Tang WHW. Intersections between microbiome and heart failure: revisiting the gut hypothesis. J Card Fail. 2015;21(12):973–980. doi:10.1016/j.cardfail.2015.09.017
25. Garrett WS. Cancer and the microbiota. Science. 2015;348(6230):80–86. doi:10.1126/science.aaa4972
26. Dai Z, Zhang J, Wu Q, et al. The role of microbiota in the development of colorectal cancer. Int J Cancer. 2019;145(8):2032–2041. doi:10.1002/ijc.32017
27. Cenit MC, Sanz Y, Codoñer-Franch P. Influence of gut microbiota on neuropsychiatric disorders. World J Gastroenterol. 2017;23(30):5486–5498. doi:10.3748/wjg.v23.i30.5486
28. Naseribafrouei A, Hestad K, Avershina E, et al. Correlation between the human fecal microbiota and depression. Neurogastroenterol Motil. 2014;26(8):1155–1162. doi:10.1111/nmo.12378
29. Sun MF, Shen YQ. Dysbiosis of gut microbiota and microbial metabolites in Parkinson’s Disease. Ageing Res Rev. 2019;45:53–61. doi:10.1016/j.arr.2018.04.004
30. Odamaki T, Kato K, Sugahara H, et al. Age-related changes in gut microbiota composition from newborn to centenarian: a cross-sectional study. BMC Microbiol. 2016;16:90. doi:10.1186/s12866-016-0708-5
31. Zhang J, Guo Z, Lim AAQ, et al. Mongolians core gut microbiota and its correlation with seasonal dietary changes. Sci Rep. 2014;4:5001. doi:10.1038/srep05001
32. Markle JGM, Frank DN, Mortin-Toth S, et al. Sex Differences in the gut microbiome drive hormone-dependent regulation of autoimmunity. Science. 2013;339(6123):1084–1088. doi:10.1126/science.1233521
33. Hassan S, Kaakinen MA, Draisma H, et al. Bifidobacterium is enriched in gut microbiome of Kashmiri women with polycystic ovary syndrome. Genes. 2022;13(2):379. doi:10.3390/genes13020379
34. Mao X, Peng X, Pan Q, et al. Uterine fibroid patients reveal alterations in the gut microbiome. Front Cell Infect Microbiol. 2022;12:863594. doi:10.3389/fcimb.2022.863594
35. Long J, Wang Y, Liu L, et al. The prominent role of the temporal lobe in premenstrual syndrome and premenstrual dysphoric disorder: evidence from multimodal neuroimaging. Front Psychiatry. 2022;13:954211. doi:10.3389/fpsyt.2022.954211
36. Barnard ND, Scialli AR, Hurlock D, et al. Diet and sex-hormone binding globulin, dysmenorrhea, and premenstrual symptoms. Obstet Gynecol. 2000;95(2):6. doi:10.1016/s0029-7844(99)00534-7
37. Hashim MS, Obaideen AA, Jahrami HA, et al. Premenstrual syndrome is associated with dietary and lifestyle behaviors among university students: a cross-sectional study from Sharjah, UAE. Nutrients. 2019;11(8):E1939. doi:10.3390/nu11081939
38. MoradiFili B, Ghiasvand R, Pourmasoumi M, et al. Dietary patterns are associated with premenstrual syndrome: evidence from a case-control study. Public Health Nutr. 2020;23(5):833–842. doi:10.1017/S1368980019002192
39. Kruskal JB. Multidimensional scaling by optimizing goodness of fit to a nonmetric hypothesis. Psychometrika. 1964;29:1–27. doi:10.1007/BF02289565
40. Kruskal JB. Nonmetric multidimensional scaling: a numerical method. Psychometrika. 1964;29:115–129. doi:10.1007/BF02289694
41. García-López M, Meier-Kolthoff JP, Tindall BJ, et al. Analysis of 1000 type-strain genomes improves taxonomic classification of Bacteroidetes. Front Microbiol. 2019;10:2083. doi:10.3389/fmicb.2019.02083
42. Pozuelo M, Panda S, Santiago A, et al. Reduction of butyrate- and methane-producing microorganisms in patients with irritable bowel syndrome. Sci Rep. 2015;5:12693. doi:10.1038/srep12693
43. Astbury S, Atallah E, Vijay A, Aithal GP, Grove JI, Valdes AM. Lower gut microbiome diversity and higher abundance of proinflammatory genus Collinsella are associated with biopsy-proven nonalcoholic steatohepatitis. Gut Microbes. 2020;11(3):569–580. doi:10.1080/19490976.2019.1681861
44. Labus JS, Hollister EB, Jacobs J, et al. Differences in gut microbial composition correlate with regional brain volumes in irritable bowel syndrome. Microbiome. 2017;5(1):49. doi:10.1186/s40168-017-0260-z
45. Karlsson FH, Fåk F, Nookaew I, et al. Symptomatic atherosclerosis is associated with an altered gut metagenome. Nat Commun. 2012;3:1245. doi:10.1038/ncomms2266
46. Takagi T, Naito Y, Kashiwagi S, et al. Changes in the gut microbiota are associated with hypertension, hyperlipidemia, and type 2 diabetes mellitus in Japanese subjects. Nutrients. 2020;12(10):2996. doi:10.3390/nu12102996
47. Houghton SC, Bertone-Johnson ER. Macronutrients and Premenstrual Syndrome. In: Berhadt LV, editor. Advances in Medicine and Biology. Vol. 2015. New York: Nova Science Publishers, Inc.; 2015:137–156.
48. Nishijima S, Suda W, Oshima J, et al. The gut microbiome of healthy Japanese and its microbial and functional uniqueness. DNA Res. 2016;23(2):125–133. doi:10.1093/dnares/dsw002
49. Tanaka E, Momoeda M, Osuka Y, et al. Burden of menstrual symptoms in Japanese women: results from a survey-based study. J Med Econ. 2013;16(11):1255–1266. doi:10.3111/13696998.2013.830974
50. Qiao M, Zhang H, Liu H, et al. Prevalence of premenstrual syndrome and premenstrual dysphoric disorder in a population-based sample in China. Eur J Obstet Gynecol Reprod Biol. 2012;162(1):83–86. doi:10.1016/j.ejogrb.2012.01.017
51. van Soest APM, Hermes GDA, Berendsen AAM, et al. Associations between pro- and anti-inflammatory gastro-intestinal microbiota, diet, and cognitive functioning in Dutch healthy older adults: the NU-AGE Study. Nutrients. 2020;12(11):3471. doi:10.3390/nu12113471
52. Gomez-Arango LF, Barrett HL, Wilkinson SA, et al. Low dietary fiber intake increases Collinsella abundance in the gut microbiota of overweight and obese pregnant women. Gut Microbes. 2018;9(3):189–201. doi:10.1080/19490976.2017.1406584
53. Haas E, Favarato D, Laurindo FRM, et al. Beneficial effects of red wine intake upon gut microbiota and parallel effects upon plasma metabolomics. Eur Heart J. 2019;40(Supplement1):
54. Henning SM, Yang J, Hsu M, et al. Decaffeinated green and black tea polyphenols decrease weight gain and alter microbiome populations and function in diet-induced obese mice. Eur J Nutr. 2018;57(8):2759–2769. doi:10.1007/s00394-017-1542-8
55. Nurazizah E, Tih F, Suwindere W. Black chocolate consumption reduces subjective symptoms in 18-22 years old females with premenstrual syndrome. JMH. 2015;1:1. doi:10.28932/jmh.v1i1.502
56. Zhou Y, Zheng J, Li Y, et al. Natural polyphenols for prevention and treatment of cancer. Nutrients. 2016;8(8):515. doi:10.3390/nu8080515
57. Hügel HM, Jackson N, May B, Zhang AL, Xue CC. Polyphenol protection and treatment of hypertension. Phytomedicine. 2016;23(2):220–231. doi:10.1016/j.phymed.2015.12.012
58. Vita JA. Polyphenols and cardiovascular disease: effects on endothelial and platelet function. Am J Clin Nutr. 2005;81(1 Suppl):292S–297S. doi:10.1093/ajcn/81.1.292S
59. Cao H, Ou J, Chen L, et al. Dietary polyphenols and type 2 diabetes: human study and clinical trial. Crit Rev Food Sci Nutr. 2019;59(20):3371–3379. doi:10.1080/10408398.2018.1492900
60. Takeda T, Yoshimi K, Kai S, et al. Characteristics of the gut microbiota in women with premenstrual symptoms: a cross-sectional study. PLoS One. 2022;17(5):e0268466. doi:10.1371/journal.pone.0268466
61. Wenting Y, Xie T, Song Y, et al. The role of androgen and its related signals in PCOS. J Cell Mol Med. 2021;25(4):1825–1837. doi:10.1111/jcmm.16205
62. Shi YC, Cai ST, Tian YP, et al. Effects of proton pump inhibitors on the gastrointestinal microbiota in gastroesophageal reflux disease. Genomics Proteomics Bioinformatics. 2019;17(1):52–63. doi:10.1016/j.gpb.2018.12.004
63. Zhang X, Han Y, Huang W, et al. The influence of the gut microbiota on the bioavailability of oral drugs. Acta Pharm Sin B. 2021;11(7):1789–1812. doi:10.1016/j.apsb.2020.09.013
64. Palleja A, Mikkelsen KH, Forslund SK, et al. Recovery of gut microbiota of healthy adults following antibiotic exposure. Nat Microbiol. 2018;3(11):1255–1265. doi:10.1038/s41564-018-0257-9
65. Maeda K, Koide Y, Katsuno H, et al. Questionnaire survey of bowel habit in Japanese medical personnel. J Anus Rectum Colon. 2021;5(3):297–305. doi:10.23922/jarc.2021-014
 © 2022 The Author(s). This work is published and licensed by Dove Medical Press Limited. The full terms of this license are available at https://www.dovepress.com/terms.php and incorporate the Creative Commons Attribution - Non Commercial (unported, v3.0) License.
By accessing the work you hereby accept the Terms. Non-commercial uses of the work are permitted without any further permission from Dove Medical Press Limited, provided the work is properly attributed. For permission for commercial use of this work, please see paragraphs 4.2 and 5 of our Terms.
© 2022 The Author(s). This work is published and licensed by Dove Medical Press Limited. The full terms of this license are available at https://www.dovepress.com/terms.php and incorporate the Creative Commons Attribution - Non Commercial (unported, v3.0) License.
By accessing the work you hereby accept the Terms. Non-commercial uses of the work are permitted without any further permission from Dove Medical Press Limited, provided the work is properly attributed. For permission for commercial use of this work, please see paragraphs 4.2 and 5 of our Terms.