")
Back to Journals » Pragmatic and Observational Research » Volume 12
Covid-19 Social Distancing Interventions by Statutory Mandate and Their Observational Correlation to Mortality in the United States and Europe
Authors Mccafferty S , Ashley S
Received 20 December 2020
Accepted for publication 30 March 2021
Published 27 April 2021 Volume 2021:12 Pages 15—24
DOI https://doi.org/10.2147/POR.S298309
Checked for plagiarism Yes
Review by Single anonymous peer review
Peer reviewer comments 5
Editor who approved publication: Professor David Price
Sean Mccafferty,1 Sean Ashley2
1Department of Ophthalmology, College of Medicine, University of Arizona, Tucson, AZ, USA; 2College of Optical Sciences, University of Arizona, Tucson, AZ, USA
Correspondence: Sean Mccafferty 6422 E. Speedway Blvd, Tucson, AZ 85710, USA
Tel +1 (520) 327-3487
Email [email protected]
Purpose: Evaluate the correlation between statutory social distancing interventions and Covid-19 mortality independently in both the United States and Europe. The study is presented as a potential methodology to evaluate the effectiveness of statutory social distancing policy.
Patients and Methods: Twenty-seven states in the United States and, separately, 12 European countries were selected which had clearly defined and dated establishment of statewide or national mandates for social distancing measures from the Institute for Health Metrics and Evaluation (IHME) data. Mandated social distancing measures considered in this study include: School closures, Prohibition on mass gatherings, business closures, stay at home orders, severe travel restrictions, and closure of non-essential businesses. The state/country Covid-19 peak mortality rate (PMR) was defined as the initial averaged normalized maximum during which social distancing mandates were in effect. Mandate-days were defined as the total days legislative mandates were in place to the PMR.
Results: The normalized peak mortality rate in the US and in Europe did not demonstrate a statistically significant correlation to the total mandate days (R-squared=0.053, p=0.246, R-squared=2.4E-06, p=0.996). A significant correlation was found between normalized mortality rate and state/country population density (R-squared=0.524, p=0.00002,R-squared=0.397, p=0.0281).
Discussion: The analysis appears to suggest no mandate effective reduction in Covid-19 mortality rate to its defined initial peak when interpreting their mean-effect. A strong correlation to population density suggests human interaction frequency does affect the peak mortality rate.
Keywords: epidemiology, analysis, SARS-Cov-2, mortality-rate, social-distancing, orders
Introduction
Socially distancing policy has been theorized to effectively reduce the rate of transmission of contagious diseases.1–3 Mandating social distancing within state jurisdictions the United States and countries in western Europe has been instituted to varying degrees during the Covid-19 pandemic. Reducing the maximum contagion transmission by mandating decreased social interactions has been theorized to reduce mortality by allowing for social/medical mobilization and proper resource allocation.3–5 Verification of this theoretical model has not been demonstrated, except analyses demonstrating marginal social distancing effectiveness in delaying the peak infection.6 The extensive global incidence of the Covid-19 pandemic and unique real-time record keeping presents an opportunity to evaluate the social distancing theory over a large population instituting considerably different social distancing measures. The purpose was to quantify the decrease in the infection/mortality or decrease in the maximum infection/mortality rate as a result of defined state mandated social distancing measures.
Patients and Methods
Data Collection
The study was conducted using the Institute for Health Metrics and Evaluation (IHME) openly published data on Covid-19 infections by individual states in the United States, to include daily infections/deaths as well as onset and discontinuation dates of state mandated social interaction interventions. A separate validating analysis was completed using IHME source information for individual European countries. As this was the primary source of information used for predictive modeling and setting public policy, it was chosen for its accuracy and regular updates.7 The methods are discussed extensively in the available preprint manuscript: “Covid-19 Social Distancing Interventions by State Mandate and Their Correlation to Mortality”.8
Mortality was chosen to define endpoint peaks and rates of change over registered infections within a state. Covid-19 registered infections are beset by inaccuracies due to: Inaccurate testing, testing frequency, asymptomatic patients, test availability, and regional variations in testing criteria. Individual states and developed countries routinely record accurately the cause and time of death. The analyses normalize for the state’s or county’s stage in the epidemiological infectious cycle by only accounting for mortality up to the initial peak mortality rate.
United States IHME data accessed on June 17, 2020 at 1900 EST was used to select all US states with more than a maximum mortality rate of 10 Covid-19 deaths per day. Separately, IHME data accessed on April 12, 2020 at 1900 EST was used to preliminarily select more than 10 sovereign European countries which fit into a geographic area of similar genomic constituency and indicated by WHO to have developed healthcare standards.7 Selected states/countries were independent legal jurisdictions which enacted geographically universal preventive social distancing statutes on a specific date to include one of the six (6) possible mandates defined in the IHME website data set. States or countries excluded were not in the geography of Europe or the United States, low initial maximum death rate of less than 10, or did not universally enact statutes.
Considered forms of social mandates:
- Public School Closures
- Social Gathering Restrictions
- Stay-at-Home Orders
- Business Closures
- Non-Essential Business Closures
- Severe Travel Restrictions
All States and countries maintained all mandated social distancing measures through the end of the examination period (initial peak mortality rate) and none were excluded. Twenty-seven (27) States were included as listed in Table 1 and twelve (12) western European countries were included as listen in Table 2. All states/countries mandated social distancing universally across their respective territory of the 6 variations listed above on a specific date provided by the IHME data set accessed on June 17, 2020 and maintained them through their initial peak infection rate.8
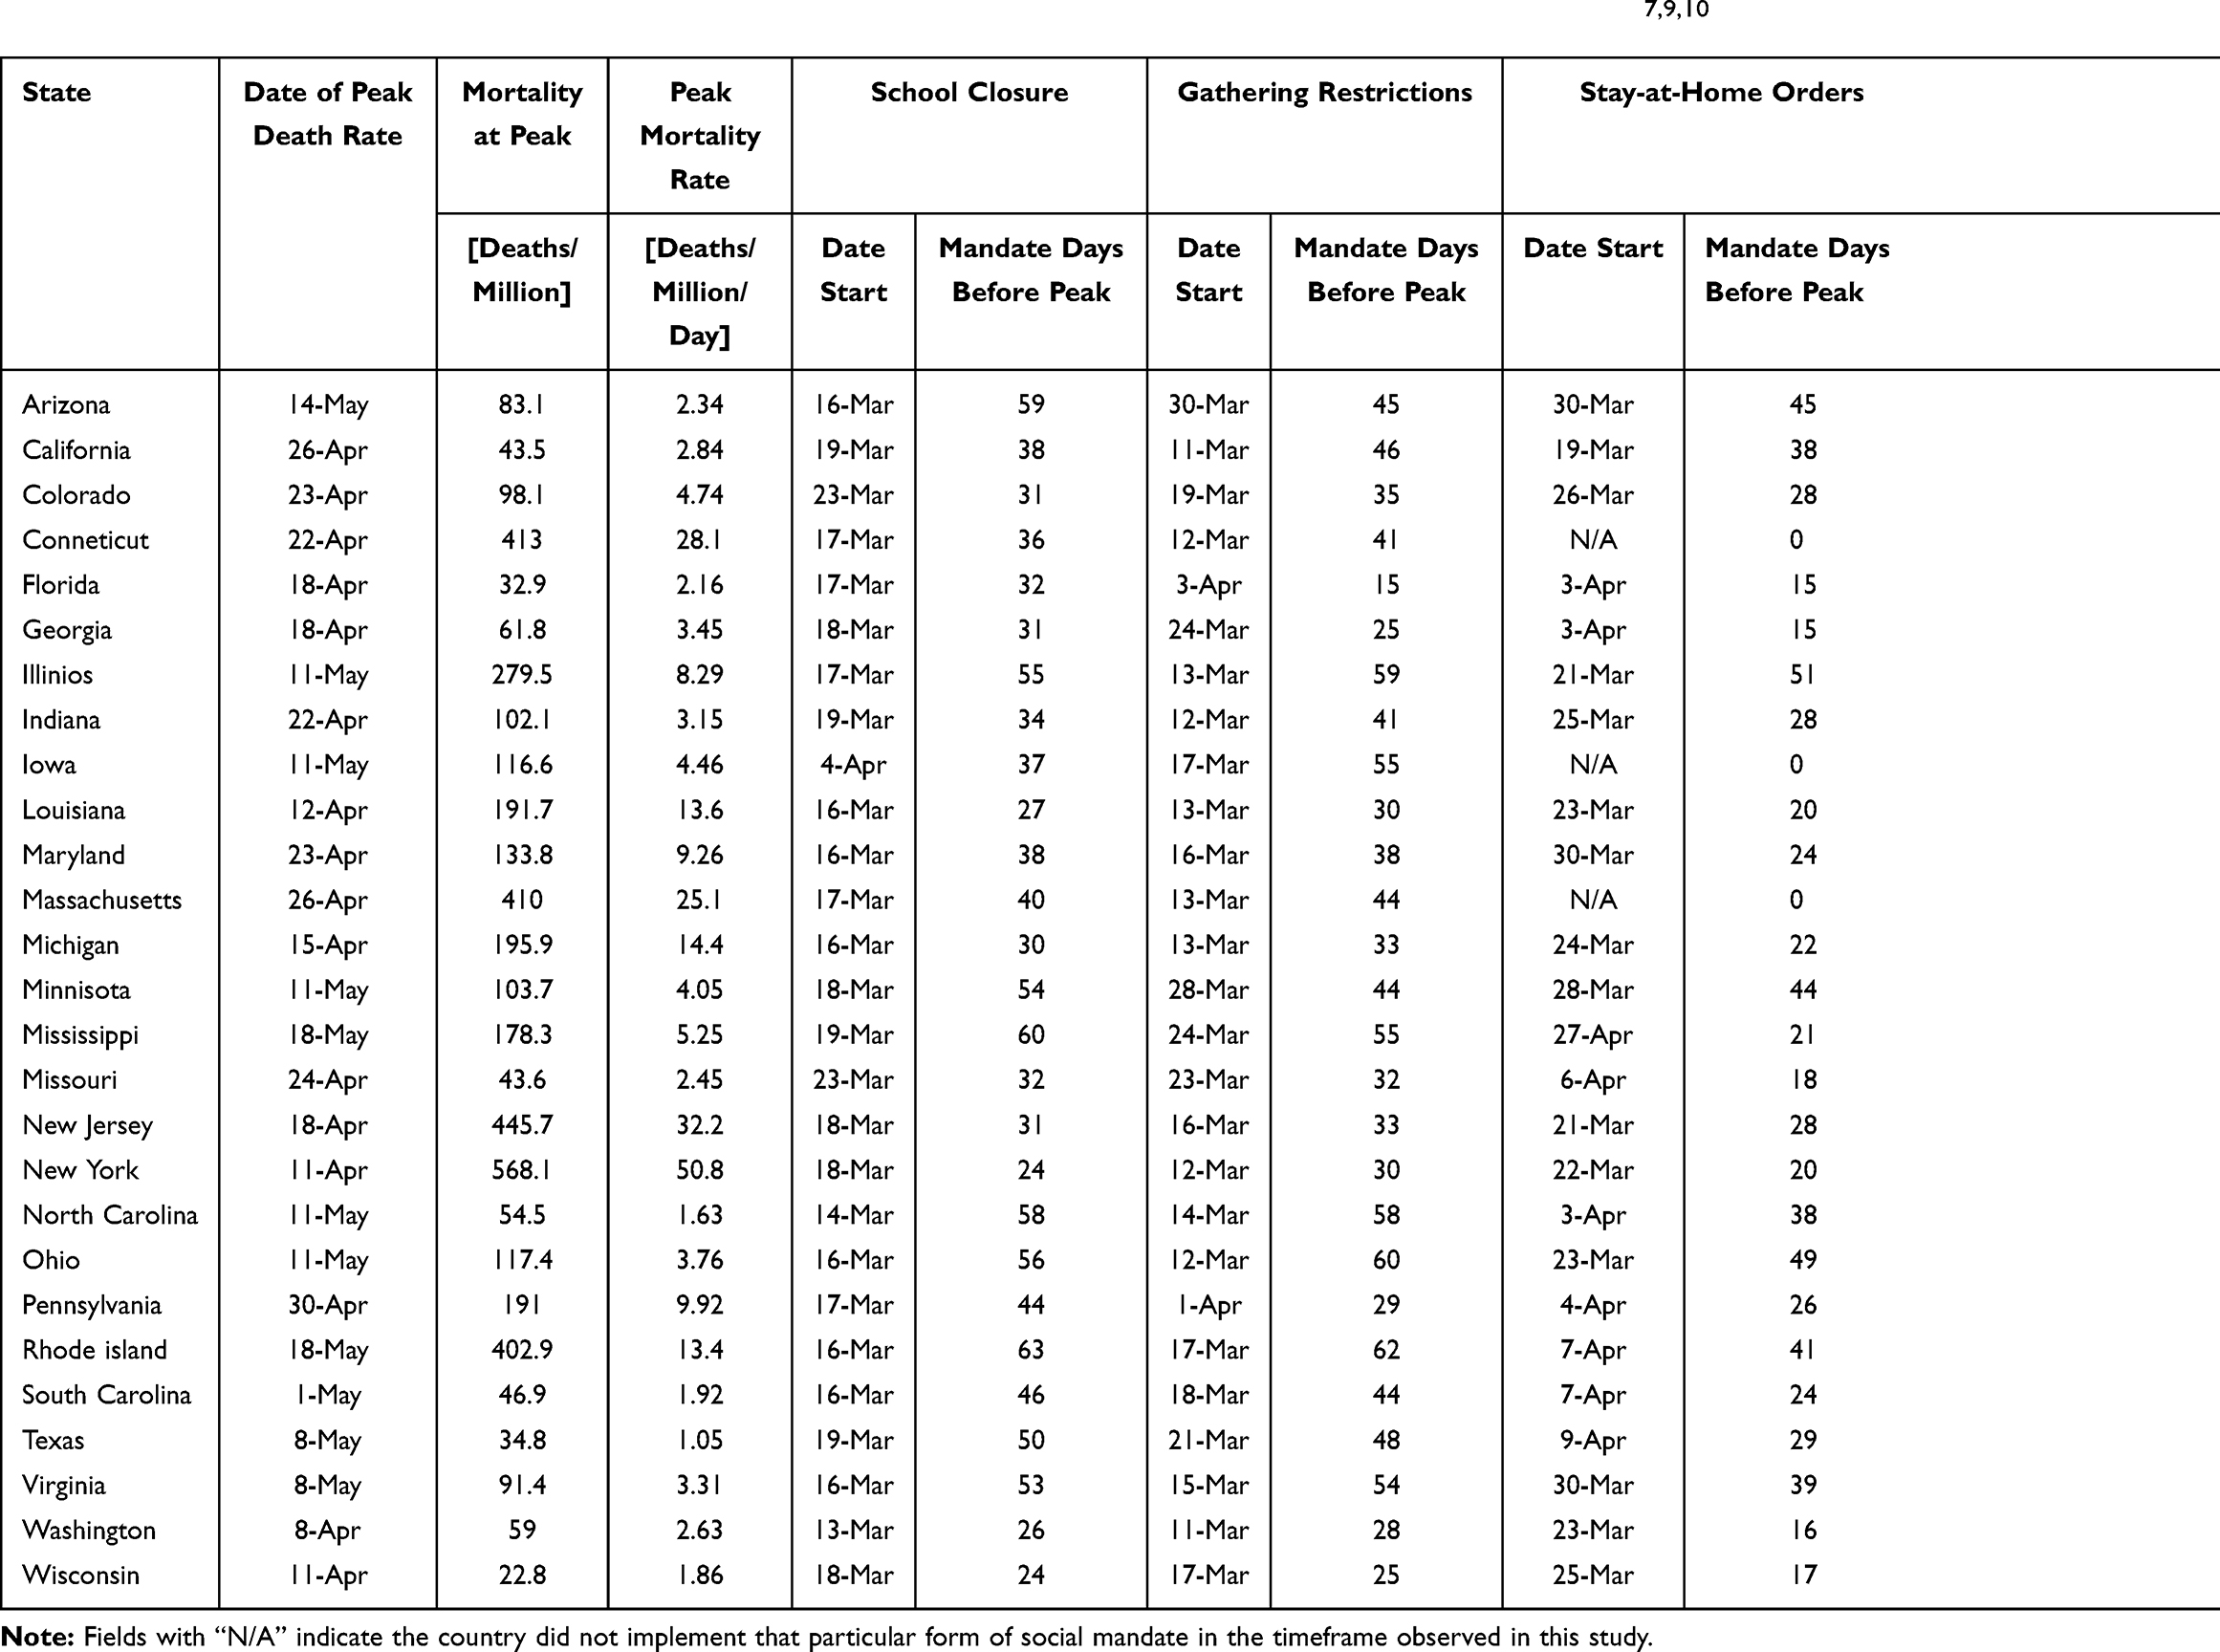 |
Table 1 Data on Population Density, Median Age, Social Mandate, and Covid-19 Mortality, and Covid-19 Maximum Mortality Rate on the 27 States in the USA Used in This Analysis. Covid-19 Data Was Obtained from IHME and Census Data.7,9,10 |
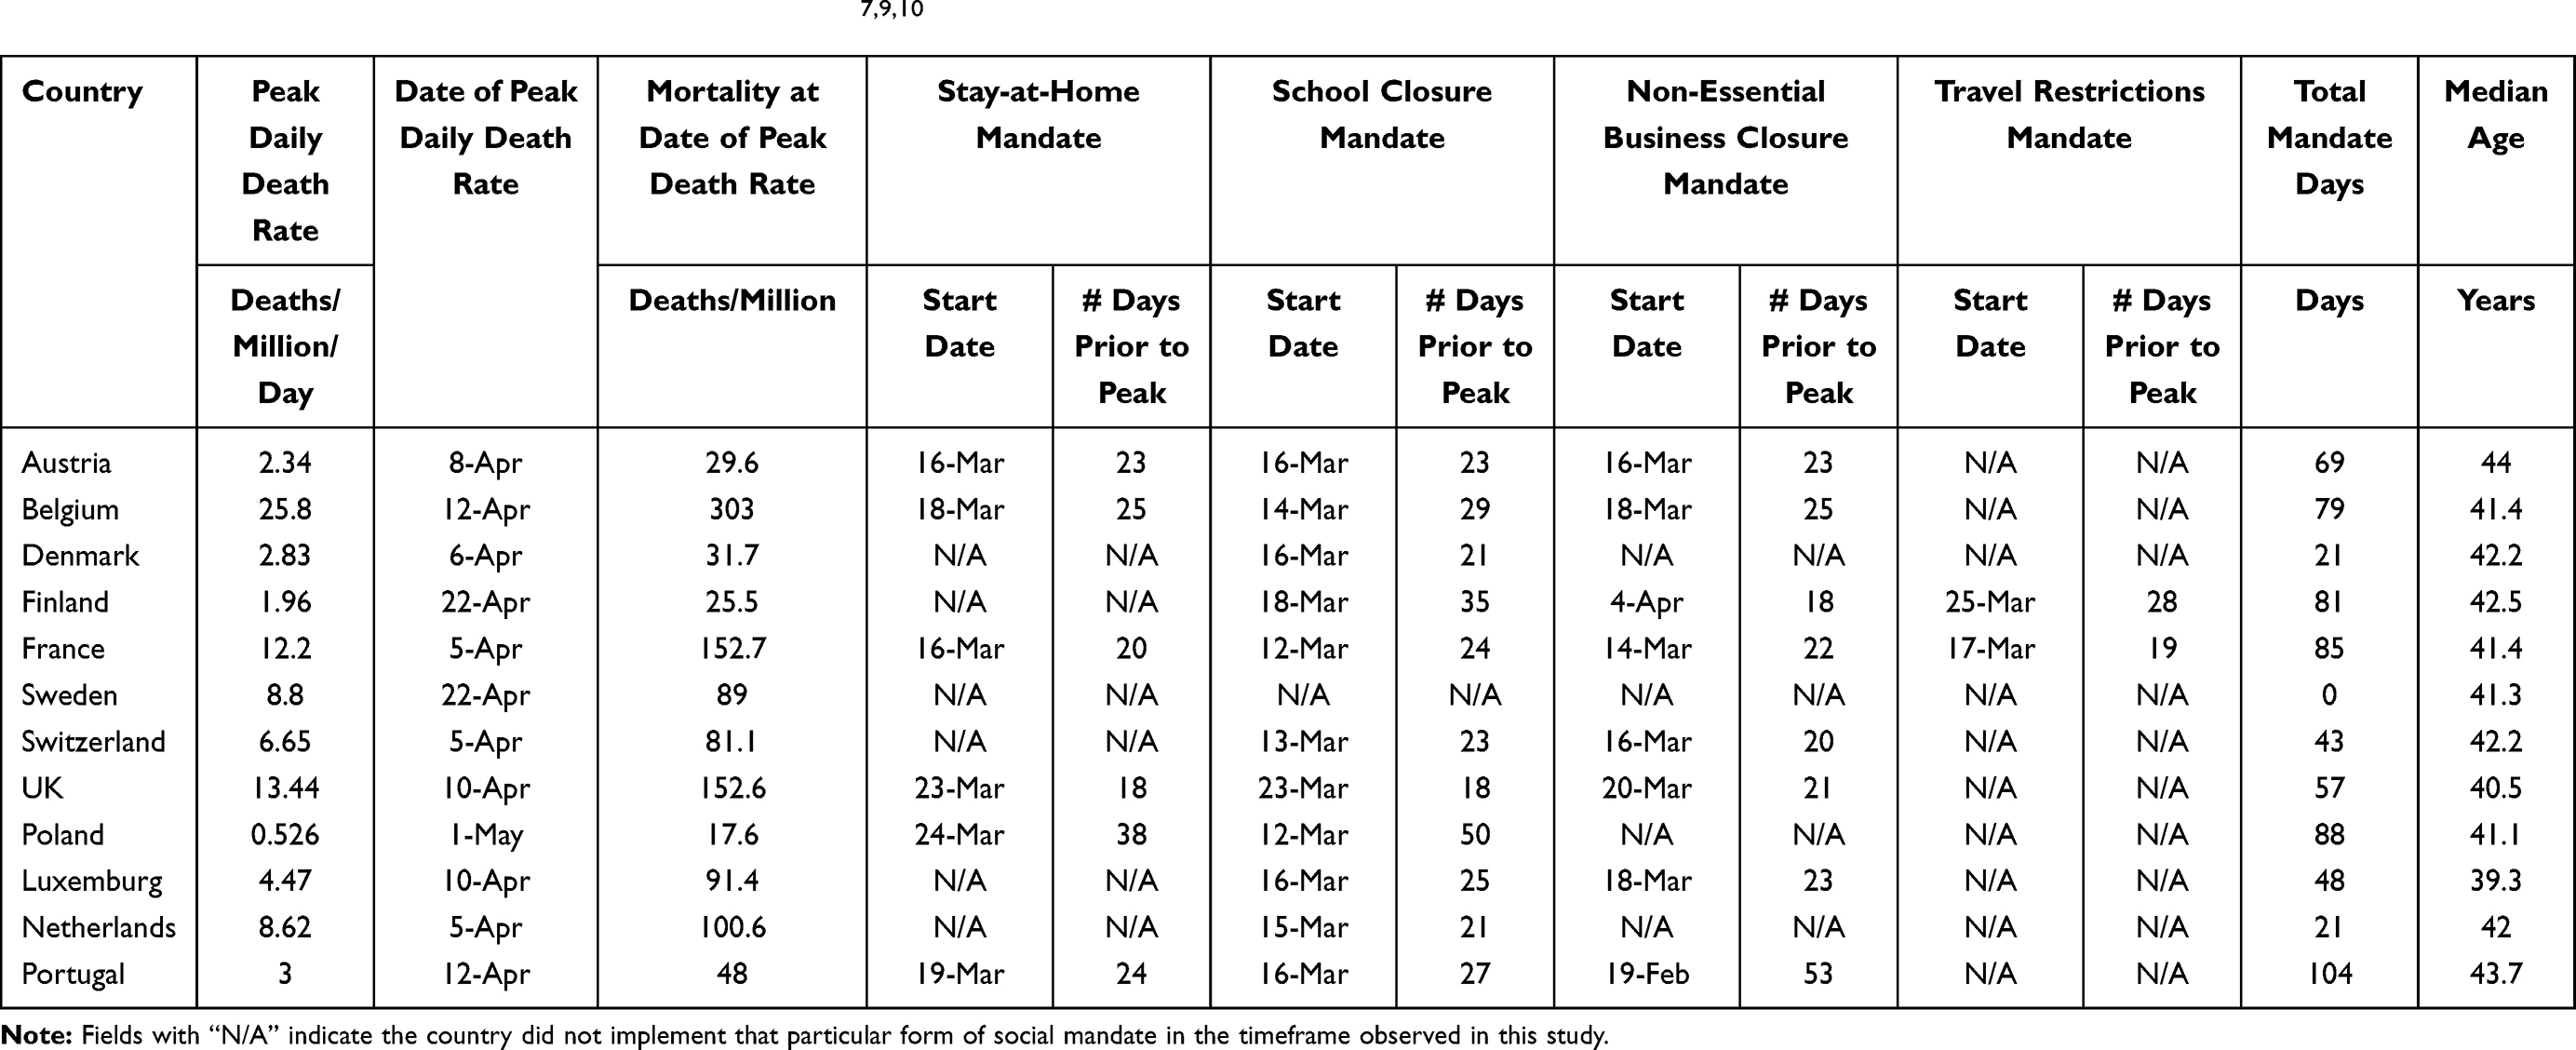 |
Table 2 Data on Population Density, Median Age, Social Mandate, and Covid-19 Mortality, and Covid-19 Maximum Mortality Rate on the 12 European Countries Used in This Analysis. Covid-19 Data Was Obtained from IHME and Census Data.7,9,10 |
The defined endpoints for the analysis included the date of the initial peak mortality rate in deaths per day for each state/country. A state’s or country’s peak mortality was defined as the highest recorded daily deaths over a seven-day moving-average which was followed by a seven-or-more day decline in mortality with no other discernable peaks (using the same criteria) at the time of accessing the data. The maximum daily mortality rate was used as an easily defined universal milestone in any infectious disease progression to examine the total viral mortality up to the maximum initial mortality rate during which mandates were continuously enacted.
Additionally, the maximum slope of the Covid-19 mortality was determined by evaluating the maximum of the derivative of the mortality curve. Specifically, this slope was defined as the total recorded mortality five days after the peak-mortality-rate minus the total recorded mortality five days before the peak-mortality-rate divided by the 10-day interval. Both the mortality-at-peak and peak-mortality-rate were normalized by dividing by the population of the selected state/country.
Equation 1 Formula to calculate the estimate for the peak-mortality rate

All data were analyzed with Matlab and Microsoft Excel.11 General linear mixed effects (GLME) modeling was used to examine combined effects of the multiple variables. Specifically, Microsoft Excel was used for the bivariate linear regressions and ANOVA summaries for both mortality-at-peak and peak-mortality-rate while Matlab was used to generate the 95% confidence interval bounds on those linear regressions as well as the separate multivariate GLME analyses.
The clinical study was conducted within the ethical principles contained in Declaration of Helsinki, Code of Federal Regulations (CRF), Obligations of Clinical Investigators (21 CFR 812). All data were public and anonymous so no IRB was needed.
Data Analysis
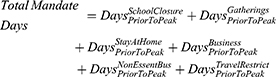
The study conducted two high-level bivariate analyses on this data: one for each output of interest – peak-mortality-rate (PMR) and mortality-at-peak (MAP) – against the total mandate days.8 The total mandate days was defined as the summation from each form of social-mandate of the total number of days prior to the initial peak that form of social-mandate was implemented.8
Equation 2 Formula for Total Mandate Days were calculated from each form of social-mandate and the number of days prior to the initial peak the mandates were implemented.
Also, bivariate analyses with the same response variables against population density were produced. Finally, two multivariate analyses were conducted. These multivariate analyses used the same response variables as in the previous bivariate studies.8
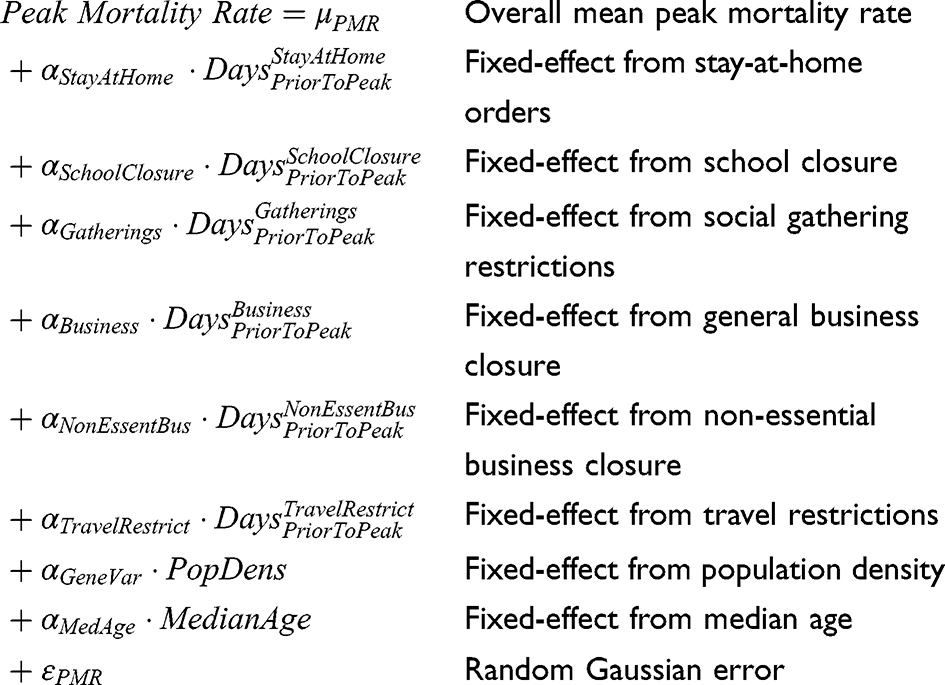
Equation 3 GLME model for peak-mortality-rate studied in the multivariate analysis.
 |
|
Equation 4 GLME model for mortality-at-peak studied in the multivariate analysis.
 |
|
These models were then regressed onto the data from Tables 1 and 2. Note that where certain social distancing mandates were not implemented, the “Days Prior to Peak” values were coded as zero in modeling to avoid singular data matrices during the regression analysis.8 The travel restrictions mandate were removed from the US analysis since no states implemented strict travel restrictions in the time of this study according to Table 1.
Results
Bivariate Analysis, MAP vs Total Mandate Days
Twenty-Seven US states were selected on June 17, 2020 to examine their collective correlation between standardized mortality and total mandate-days of state mandated social distancing directives. All states maintained social distancing directives through the study endpoint.7 States were found to have a significant diversity in total mandated intervention over time (mean = 171 total-mandate-days, std-dev = 50 total-mandate-days). The total population studied was 292 million. All states had statistically similar age distributions (mean = 38.6 years-old, std-dev = 1.5 years-old). The population density varied significantly (mean = 304 Pop./square mile, std-dev = 306 Pop./square mile)
Results for the US state bivariate analysis of mortality-at-peak (MAP) against total mandate days were analyzed. The correlation of the standardized mortality-at-peak with total-mandate-days of social-distancing mandates prior to the peak was found to be statistically insignificant (R-squared = 2E-06 with p-val = 0.9946).
Separately, twelve similar western European sovereign countries were pre-selected on April 12, 2020 to examine their collective correlation between standardized mortality and total mandate-days of state directed social distancing directives. All countries maintained social distancing directives through the study endpoint on May 1, 2020.7 Countries were found to have a significant diversity in total mandated intervention over time (mean = 58 total-mandate-days, std-dev = 30.6 total-mandate-days). The total population studied was 183 million. All countries had statistically similar age distributions (mean = 41.8 years-old, std-dev = 1.23 years-old). The total standardized mortality at the peak (MAP) per European country also exhibited no statistical correlation to the total mandate days (R-squared = 0.004, p=0.85).
Bivariate Analysis, PMR vs Total Mandate Days
The slope of the standardized mortality per European country or peak mortality rate (PMR) did not significantly correlate to the total mandate days (R-squared = 2.39E-06, p=0.996). The bivariate data regression results are shown in Figure 1 in the form of a scatter-plot. Results for the US bivariate analysis of peak-mortality-rate (PMR) against total mandate days are captured in Figure 2. The correlation of the standardized US peak-mortality-rate with total-mandate-days of social-distancing mandates prior to the peak was found to be statistically insignificant (R-squared = 0.0534 with p-val = 0.2463).
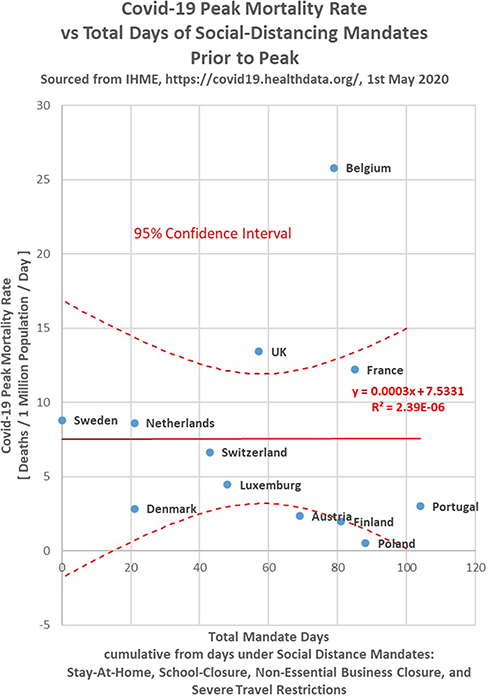 |
Figure 1 Standardized Covid-19 peak-mortality-rate (PMR) per European country correlated to days under mandated social distancing directives prior to the peak. Notes: Blue datapoints are labeled with their respective country name. The solid red line denotes a line-of-best-fit. The dotted red curves denote the upper and lower bounds of the 95% confidence interval about the line-of-best-fit. |
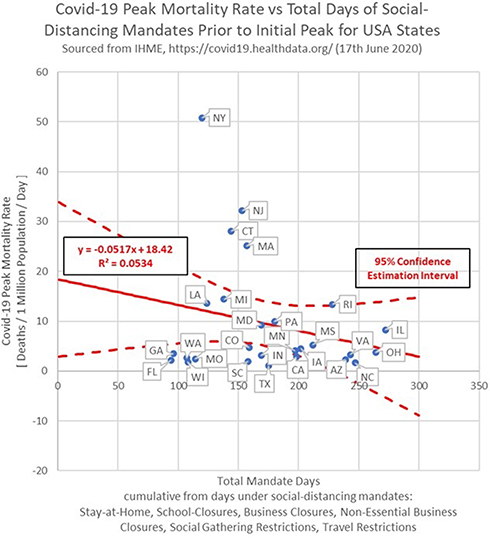 |
Figure 2 Standardized Covid-19 peak-mortality-rate (PMR) correlated to days under US state-mandated social distancing directives prior to the peak. Notes: Blue datapoints are labeled with their respective state abbreviation. The solid red line denotes a line-of-best-fit. The dotted red curves denote the upper and lower bounds of the 95% confidence interval about the line-of-best-fit. |
Bivariate Analysis, PMR vs Population Density
Results for the bivariate analysis of peak-mortality-rate against US state average population density are captured in Figure 3. The correlation of the standardized peak-mortality-rate with total-mandate-days of social-distancing mandates prior to the peak was found to be statistically significant (R-squared = 0.3814 with p-val = 0.0006). The bivariate analysis was repeated with respect to European population density. The slope of the standardized mortality per European country correlated to the population density and was statistically significant (R2 = 0.358 with p=0.0398). The bivariate data regression results are shown in Figure 4 in the form of a scatter-plot.
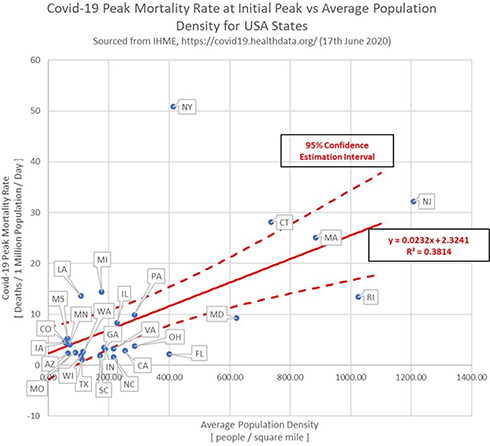 |
Figure 3 Standardized Covid-19 peak-mortality-rate (PMR) correlated to US state average population density. Notes: Blue datapoints are labeled with their respective state abbreviation. The solid red line denotes a line-of-best-fit. The dotted red curves denote the upper and lower bounds of the 95% confidence interval about the line-of-best-fit. |
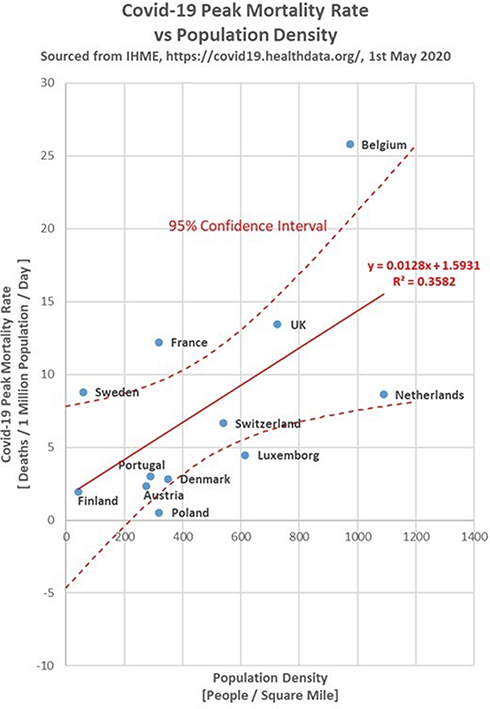 |
Figure 4 Standardized Covid-19 peak-mortality-rate (PMR) correlated to European country average population density. Notes: Blue datapoints are labeled with their respective country name. The solid red line denotes a line-of-best-fit. The dotted red curves denote the upper and lower bounds of the 95% confidence interval about the line-of-best-fit. |
Bivariate Analysis, MAP vs Population Density
Results for the bivariate analysis of mortality-at-peak against average US state population density were analyzed. The correlation of the mortality-at-peak with average US state population density was found to be statistically significant (R2 = 0.5238 with p-val = 1.99E-05). Likewise, the standardized mortality at the peak per European country also correlated to the population density and was statistically significant (R-squared = 0.397 with p=0.0281).
Multivariate Analysis on MAP
Results for the US and European multivariate analysis of mortality-at-peak on the date of initial peak-mortality-rate were separately analyzed in the GLME. In each study, one modeled effect was found to be statistically significant at the 5% significance level; this was a state’s/country’s average population density (p-val = 0.0004, p-val = 0.0046).
Multivariate Analysis on PMR
Results for the US and European multivariate analysis of peak-mortality-rate were captured in the GLME. In each study, One modeled effect was found to be statistically significant at the 5% significance level; this was a state’s/country’s average population density (p-val = 0.0025, p-val = 0.0042).
The European study also revealed under the multivariate analysis that school closures had an expected effect on the PMR and on the MAP (p-val = 0.0142,0.0265) and the stay-at-home orders actually had a negative effect (increased mortality) on the PMR and MAP (p-val = 0.0303.0.0476). However, the US multivariate analyses did not corroborate these findings with all factors producing statistically insignificant results.
Discussion
The analysis appears to show no statistically significant US reduction in the slope of the Covid-19 mortality rate (p-val = 0.995) nor in Covid-19 mortality (p-val = 0.246) to its defined initial mortality peak. Likewise, the analysis appears to show no statistically significant European reduction by combined mandated-days in either the slope of the Covid-19 mortality rate (p-val = 0.996) nor in Covid-19 mortality (p-val = 0.854) to its defined initial mortality peak. There was a significant correlation to both the overall mortality and the maximum mortality rate to population density in both the US and Europe. The correlation to population density suggests that the proximity and frequency of social interactions directly affect the mortality rate and overall mortality. However, the evaluation of statutory mandates suggests that they were unable to reduce the frequency of social interactions to be effective. The results separately analyzed in the US and Europe corroborate each other conducted using the same methodology with the IHME data.8
One of the advantages in this analytical approach is in the design of the social-mandate input variables to be more robust to possible biases caused by different states being in different epidemiologic infectious stages of Covid-19. It is worth noting that most of the states and countries included in this study have since experience a second wave of infections not included in this analysis. This may be a successive superposition of infectious cycles within the state in sequestered populations or an effect of behavioral changes within the population. Only their initial peaks were the subject of this study and they were not revised to the new peak nor excluded. Mandates and social behaviors changed substantially during the interim between the first maximum and could confound the analysis. Furthermore, the strong correlation to population density demonstrating a likely effect of personal interaction frequency which assists in validating the methodology. It is also worth noting that start dates of social-mandate implementation does not necessarily imply a certain degree of compliance of the population with enacted mandates.
The length of time before the initial peak a form of social-mandate was implemented by a US state was not found to be statistically significant in its effect on peak-mortality-rate and mortality-at-peak in both the US bivariate studies and the multivariate studies. The lowest associated p-value with social-mandate terms across all studies above was p-val > 0.2463 in the bivariate study of studying standardized Covid-19 peak-mortality-rate against total-mandate-days. However, the average population density was found to be a statistically significant factor for both peak-mortality-rate and mortality-at-peak of a state in both the bivariate and multivariate studies. The largest associated p-value with average population density across all studies above was p-val = 0.0025 in the multivariate study with peak-mortality-rate. The results were corroborated by the European study analyses with the exception of the multivariate analyses demonstrating a positive effect due to school closures and a negative effect due to stay-at-home orders.
The primary finding is that the timing and scope of social-mandates alone is not enough to explain the variability in Covid-19 peak-mortality-rate and mortality-at-peak numbers between states or countries. However, a state’s average population density is a significant factor and should be accounted for in one way or another in current and future investigations to explain the variability in Covid-19 peak-mortality-rate and mortality-at-peak numbers between states.
Factors which influence the effectiveness of social distancing interventions include the reproduction number (R0) of the virus, the mortality rate, and the mandate effectiveness of the isolation.12,13 A reduction of the slope of the maximum mortality rate without a change in total mortality is consistent with theory of viral infectious epidemiology.14 Reductions in total mortality due to reduced healthcare system or advancements in medical care did not materialize in this analysis. However, the time from the probable first registered death to the peak of the mortality rate was only 3 months. It is possible that if the viral mortality estimated at 0.6% to 1.2% or the viral reproduction R0, estimated between 2.8 and 3.3, were significantly higher may have produced a correlation.11,12 Mandated interventions which were significantly more isolating also may have produced a correlation to the mortality. A longitudinal study has found reduced mortality associated with social distancing intervention.15 However, the absence of demonstrable social distancing effect on infectious case rates have been supported in recent a observational study, Bendavid et al.16
The analysis is presented as a potential methodology to evaluate the effectiveness of statutory social distancing policy. Western European countries and US states were selected for this study due to their respective cultural and healthcare similarities. A possible future study would be to conduct a similar analysis on other clusters of countries with cultural similarities and interventional policy variations.
Abbreviations
FDA, Food and Drug Administration; CFR, Code of Federal Regulations; IHME, Institute of Health Metrics and Evaluation; GLME, General Linear Mixed-Effects; PMR, Peak-mortality-rate due to Covid-19 as calculated using Equation 1; MAP, Mortality-at-peak due to Covid-19, standardized by state total population as reported in referenced IHME data.
Data Sharing Statement
Depersonalized data made available for download on IHME Websites can be used, shared, modified or built upon by non-commercial users via the Creative Commons Attribution-NonCommercial 4.0 International License. https://creativecommons.org/licenses/by-nc/4.0/Data available Institute for Health Metrics and Evaluation (IHME) http://www.healthdata.org/covid accessed on June 17, 2020 and July 19, 2020.
Preprint version published: Medrxiv 2020; DOI: 10.1101/2020.08.26.20182758.
Ethics Approval and Consent to Participate
This clinical study was conducted in accordance with the ethical principles contained within Declaration of Helsinki, Protection of Human Volunteers (21 CFR 50), Institutional Review Boards (21 CFR 56), and Obligations of Clinical Investigators (21 CFR 812). No IRB was required with the use of depersonalized public data.
Consent for Publication
Not Applicable. Depersonalized data made available for download on IHME Websites can be used, shared, modified or built upon by non-commercial users via the Creative Commons Attribution-NonCommercial 4.0 International License. https://creativecommons.org/licenses/by-nc/4.0/
Author Contributions
All authors made substantial contributions to conception and design, acquisition of data, or analysis and interpretation of data; took part in drafting the article or revising it critically for important intellectual content; agreed to submit to the current journal; gave final approval of the version to be published; and agree to be accountable for all aspects of the work.
Funding
This study was not funded.
Disclosure
The authors report no conflicts of interest in this work.
References
1. Reluga T. Game theory of social distancing in response to an epidemic. PLoS Comput Biol. 2010;6(5):e1000793. doi:10.1371/journal.pcbi.1000793
2. Caley P, Philp D, McCracken K. Quantifying social distancing arising from pandemic influenza. J R Soc Interface. 2008;5(23):631–639. doi:10.1098/rsif.2007.1197
3. Kelso JK, Milne GJ, Kelly H. Simulation suggests that rapid activation of social distancing can arrest epidemic development due to a novel strain of influenza. BMC Public Health. 2009;9:117. doi:10.1186/1471-2458-9-117
4. Kissler S, Tedijanto C, Lipsitch M, Grad Y. Social distancing strategies for curbing the COVID-19 epidemic. medRxiv. 2020. doi:10.1101/2020.03.22.20041079
5. Rashid H, Ridda I, King C, et al. Evidence compendium and advice on social distancing and other related measures for response to an influenza pandemic. Paediatr Respir Rev. 2015;16:1526–1542. doi:10.1016/j.prrv.2014.01.003
6. Marsland R, Mehta P. Data-driven modeling reveals a universal dynamic underlying the COVID-19 pandemic under social distancing. arXiv p arXiv Preprint arXiv:2004 10666. 2020.
7. Institute for Health Metrics and Evaluation (IHME), Covid-19 Social distancing. Available from: http://www.healthdata.org/covid. June 17, 2020, July 19, 2020, April 12, 2020, May 1, 2020, May 15, 2020.
8. McCafferty S, Ashley S. Covid-19 social distancing interventions by state mandate and their correlation to mortality. medRxiv. 2020.
9. StatsAmerica. USA states in profile: median age in 2019. Indiana Business Research Center; July 9, 2020. Available from: http://www.statsamerica.org/sip/rank_list.aspx?rank_label=pop46&ct=S09.
10. United States Census Bureau. “United States summary: 2010, population and housing unit counts, 2010 census of population and housing,” pp. V-2, 1& 41 (Tables 1 & 18); 2012. Available from: https://www.census.gov/programs-surveys/decennial-census/2020-census.html.
11. MATLAB. Version 9.6.0.1072779 (R2019a). Natick, Massachusetts: The MathWorks Inc; 2020.
12. Viceconte G, Petrosillo N. Covid-19 R0: magic number or conundrum? 2020:1–2.
13. Russel T, Hallewell J, Jarvis C, et al. Estimating the infection and case fatality ratio (Covid-19) using age adjusted data from the outbreak on the diamond princess cruise ship, February 2020. Euro Surveill. 2020;25:2000256.
14. Daley G, Gani J. Epidemic modeling: an introduction. NY: Cambridge University Press; 2005.
15. Piovani D, Christodoulou MN, Hadjidemetriou A, et al. Effect of early application of social distancing interventions on COVID-19 mortality over the first pandemic wave: an analysis of longitudinal data from 37 countries. J Infect. 2021;82:133–142. doi:10.1016/j.jinf.2020.11.033
16. Bendavid E, Oh C, Bhattacharya J, Ioannidis JP. Assessing mandatory stay‐at‐home and business closure effects on the spread of COVID‐19. Eur J Clin Invest. 2021;51:e13484. doi:10.1111/eci.13484
 © 2021 The Author(s). This work is published and licensed by Dove Medical Press Limited. The full terms of this license are available at https://www.dovepress.com/terms.php and incorporate the Creative Commons Attribution - Non Commercial (unported, v3.0) License.
By accessing the work you hereby accept the Terms. Non-commercial uses of the work are permitted without any further permission from Dove Medical Press Limited, provided the work is properly attributed. For permission for commercial use of this work, please see paragraphs 4.2 and 5 of our Terms.
© 2021 The Author(s). This work is published and licensed by Dove Medical Press Limited. The full terms of this license are available at https://www.dovepress.com/terms.php and incorporate the Creative Commons Attribution - Non Commercial (unported, v3.0) License.
By accessing the work you hereby accept the Terms. Non-commercial uses of the work are permitted without any further permission from Dove Medical Press Limited, provided the work is properly attributed. For permission for commercial use of this work, please see paragraphs 4.2 and 5 of our Terms.