")
Back to Journals » Cancer Management and Research » Volume 14
Development and Internal Validation of a Nomogram-Based Model to Predict Three-Year and Five-Year Overall Survival in Patients with Stage II/III Colon Cancer
Authors Ren D, Wang WL, Wang G, Chen WW, Li XK, Li GD, Bai SX, Dong HM, Chen WH
Received 23 August 2021
Accepted for publication 20 October 2021
Published 14 January 2022 Volume 2022:14 Pages 225—236
DOI https://doi.org/10.2147/CMAR.S335665
Checked for plagiarism Yes
Review by Single anonymous peer review
Peer reviewer comments 2
Editor who approved publication: Dr Beicheng Sun
Dan Ren,1 Wen-Ling Wang,2 Gang Wang,2 Wei-Wei Chen,2 Xiao-Kai Li,2 Guo-Dong Li,2 Sai-Xi Bai,2 Hong-Min Dong,2 Wang-Hua Chen2
1Oncology Department, Guizhou Medical University, Guiyang, Guizhou, 550000, People’s Republic of China; 2Department of Abdominal Oncology, Affiliated Hospital of Guizhou Medical University, Affiliated Tumor Hospital of Guizhou Medical University, Guiyang, Guizhou, 550000, People’s Republic of China
Correspondence: Wen-Ling Wang
Department of Abdominal Oncology, Affiliated Hospital of Guizhou Medical University, Affiliated Tumor Hospital of Guizhou Medical University, No. 1 Beijin West Road, Yunyan District, Guiyang, Guizhou, 550000, People’s Republic of China
Tel +86 138 8507 7539
Fax +86 851 86512900
Email [email protected]
Objective: The aim of this study was to develop a nomogram-based model to predict the three-year and five-year overall survival (OS) of patients with stage II/III colon cancer following radical resection.
Methods: A total of 1156 patients with stage II/III colon cancer who underwent radical resection at the Affiliated Hospital of Guizhou Medical University between December 2012 and December 2018 were enrolled. Lasso regression was used to screen out 12 variables: age, prealbumin, albumin, degree of differentiation, total tumor-node-metastasis (TNM) stage, T stage, N stage, prognostic nutritional index (PNI), platelet/lymphocyte count, carcinoembryonic antigen, carbohydrate antigen 19-9 (CA19-9), and postoperative adjuvant chemotherapy. The data set was then randomly split into a modeling set and a validation set, and the bootstrap method was used to verify the internal validity of the final model. A nomogram was then used to present the model, and the risk groups were categorized according to the total score in the nomogram.
Results: This study established and developed a simple, easy-to-use predictive model that included age, degree of differentiation, N stage, CA19-9, PNI, and postoperative chemotherapy as variables. In the multivariate Cox regression analysis, only postoperative chemotherapy was identified as an independent risk factor for death in patients with colon cancer. The receiver operating characteristic curve showed that the model demonstrated good resolution, with an area under the curve of 0.803. Decision curve analysis indicated that the model had a good positive net gain, and the bootstrap method was used to verify its stability. In the OS rate, the C-index was 0.78. According to the total score of the nomogram, the risk group was layered by drawing the Kaplan–Meier (K–M) curve. In the three-year OS K–M curve, the survival rates of the low-risk group, the medium-risk group, and the high-risk group were 96%, 93%, and 82%, respectively. In the five-year OS K–M curve, the survival rates of the low-risk group, the medium-risk group, and the high-risk group were 94%, 90%, and 73%, respectively.
Conclusion: The nomogram-based prediction model developed in this study is stable and has good resolution, reliability, and net gain. It will therefore be useful for clinicians performing risk stratification and postoperative monitoring and in the development of personalized treatment options for patients with stage II/III colon cancer.
Keywords: colon cancer, nomogram, overall survival, prognosis
Introduction
Colon cancer is one of the most common malignant tumors worldwide, causing approximately 900,000 deaths every year.1 In China, with the continuous increase in the population base, the growth of population aging, and modern lifestyle changes, the incidence of colon cancer is also increasing every year.2,3 At present, surgical resection is the most common treatment for colon cancer, especially for patients without distant metastases.4,5
Tumor-node-metastasis (TNM) cancer staging, developed by the American Joint Commission on Cancer, is the main criterion for developing strategies for the treatment of colon cancer and is also used in prognostic risk stratification. However, this system only takes into account the morphological characteristics of the tumor, not the biological characteristics. A large number of clinical studies have found that even in patients with the same TNM stage, the prognosis is not always the same,6 especially in cases of stage II/III colon cancer.7 Previous research has found that locally advanced colon cancer accounts for around 70% of all colon cancer cases,8 and the five-year survival rate for patients with stage IIIa and stage IIb colon cancer is 83.4% and 72.2%, respectively. This indicates that, when patients are subjected to prognostic risk stratification, biological characteristics should be considered in addition to the morphological characteristics of the tumor.
Previous studies on colon cancer have considered other factors that are associated with prognosis, such as clinicopathological features, inflammatory indicators, carcinoembryonic antigen (CEA), carbohydrate antigen 19-9 (CA19-9), nutritional indicators, albumin, hemoglobin, prognostic nutritional index (PNI), and postoperative adjuvant chemotherapy.9–12 In addition, some genes or molecules, such as the Kirsten rat sarcoma virus gene, adenomatous polyposis coli gene, p53 gene, and the CD44 antigen have been identified as prognostic indicators for patients with colon cancer.13–15 Chromosome instability and CpG island methylation phenotype are also widely accepted as biomarkers for metastatic risk and prognostic analysis.16 However, these detection and judgment methods not only cause trauma to patients but are also very expensive. At present, the establishment of a prognostic prediction model for colorectal cancer patients is still an area of interest. Valentini et al17 developed a nomogram based on five European clinical trials in order to predict the recurrence, long-distance conversion, and overall survival (OS) of patients with locally advanced rectal cancer. The nomogram provides an accurate prediction of stage II/III rectal cancer and is the most reliable tool for prognosis. However, it is limited to Western locally advanced rectal cancer patients who have undergone neoadjuvant radiotherapy and chemotherapy prior to surgery.
This study aimed to establish a prognostic prediction model for colon cancer using clinical, pathological, biological, and morphological characteristics drawn from a single-center retrospective cohort patient data base. The findings of this study will offer clinicians assistance in early risk stratification and allow them to make clinical decisions to improve the survival rate of patients with stage II/III colon cancer.
Materials and Methods
Subjects
A total of 1175 patients with stage II/III colon cancer who underwent radical resection in the Affiliated Hospital of Guizhou Medical University between December 2012 to December 2018 were screened. Staging criteria were based on the eighth edition of the American Cancer Federation’s TNM staging system for colon cancer.
Follow-Up Criteria
Patients were followed up every three months after surgery or chemoradiotherapy. The follow-up methods involved inpatient and outpatient visits, and the follow-up examinations included computed tomography of the chest and abdomen, colonoscopy, tumor markers, and routine bloods including biochemistry, along with the patient’s symptoms and signs. The final follow-up took place in December 2019. The median follow-up period was 54 months (12–68 months).
Inclusion and Exclusion Criteria
Inclusion criteria: (1) patients who underwent surgical resection for colon cancer, (2) a postoperative pathological diagnosis of colon adenocarcinoma, (3) a postoperative classification of stage II/III cancer, (4) no distant metastases, and (5) no clinical infection.
Exclusion criteria: (1) patients who received neoadjuvant chemotherapy or radiotherapy, (2) an infectious disease or fever with other signs of infection in the three weeks prior to surgery, (3) hematological or immune system diseases, (4) other malignant tumors, (5) serious complications or death occurring during the perioperative period, and (6) no follow-up records, or a follow-up period of less than six months.
Based on the inclusion and exclusion criteria, 19 patients were excluded from the study: 10 had received neoadjuvant radiotherapy or chemotherapy and 9 either did not complete follow-up or had a follow-up period of less than six months. The remaining 1156 patients were enrolled in the modeling (Figure 1). As this study was a retrospective cohort study, data were anonymized and informed consent was not required.
 |
Figure 1 Flow chart of the data selection process. |
Patient Characteristics
Table 1 shows the baseline characteristics of all 1156 patients (modeling set: n = 1035; validation set: n = 121). Among these patients, 121 died during follow-up, with a mortality rate of 10.47%. In the modeling set, the mean age at diagnosis was 58.44 ± 13.00 years, and 701 patients (60.64%) were male. Operative pathological results indicated that there were 892 cases (86.18%) in either the high-or medium differentiation type and 143 cases (13.82%) in the low differentiation type in the modeling set. In both the modeling set and the validation set, the majority of patients were in the T3 stage. In the modeling set, staging was as follows: T3 = 817 (83.20%), T4 = 165 (16.80%), N0 = 528 (51.01%), N1 = 371 (35.85%), and N2 = 136 (13.14%). Most patients underwent postoperative adjuvant chemotherapy, with 818 (79.03%) in the modeling set doing so. The mean ± standard deviation for the PNI and CA19-9 were 48.73 ± 6.60 and 3.40 ± 1.68, respectively.
 |
Table 1 Baseline Characteristics of Participants |
Data Collection
The predictors for the study were selected a priori based on clinical experience and on previous research that had tested predictors for colon cancer survival. Twenty variables, split into two categories, continuous variables and categorical variables, were collected for the development of the model.
- Continuous variables were age, hemoglobin, prealbumin, total protein, albumin, tumor markers CA19-9 and CEA, and PNI, along with five hematological inflammation response markers: systemic immune inflammation index (SII), neutrophil-to-lymphocyte ratio (NLR), platelet-to-lymphocyte ratio (PLR), monocyte-to-lymphocyte ratio (MLR), and lymphocyte-to-monocyte ratio (LMR).
- Categorical variables were gender, tumor location, degree of differentiation, T stage, N stage, TNM stage, and postoperative adjuvant chemotherapy. As the SII, CEA, CA19-9, PLR, NLR, LMR, and MLR variables had skewed distributions log2 conversions were performed. The above blood biochemical indices, including nutritional indicators, inflammatory indicators, and tumor markers were tested one week prior to surgical resection, and all patients underwent standard radical resection under standard general anesthesia.
SII calculation formula: platelet count × neutrophil count/lymphocyte count (× 109/L).
PNI counting formula: serum albumin value (g/L) + 5 × lymphocyte count (× 109/L).
Model Establishment and Validation
As the incidence of events in this study was low, and in an effort to improve the events per variable (EPV) and thus avoid over-fitting, the selected modeling method generally followed the guidance outlined in the 2016 British Medical Journal publication “How to develop a more accurate risk prediction model when there are few events.”18
Preparation for Model Development
Lasso regression can reduce the dimension of the predictors by penalty function, thus streamlining the model, and was used to screen the predictors included in this study. After screening, a total of 12 variables were included in the model: age, prealbumin, albumin, degree of differentiation, N stage, T stage, TNM stage, PNI, PLR, CEA, CA19-9, and postoperative adjuvant chemotherapy.
Model Development and Validation
The study used random split-sample development and undertook validation using random segmentation internal validation; Type 2a in the Transparent Reporting of a Multivariable Prediction Model for Individual Prognosis or Diagnosis guidelines. First, the entire dataset was randomly split, with 75% as the modeling dataset and 25% as the validation dataset. The Cox regression model algorithm was then used to construct three models: (1) a full model, in which all 12 variables were used in the construction of the model, (2) an Akaike information criterion (AIC)-stepwise model, in which the variables that remained after screening using the AIC criteria were used, and (3) a multivariable fractional polynomial (MFP) model. As the Cox model belongs to a generalized linear equation, it can only assess linear relationships and not those that are nonlinear. An MFP model was constructed mainly based on sensitivity analysis to identify any differences between ordinary linear models, after considering nonlinear relationships. If a difference was identified, this indicated that the MFP model was required. If no differences were identified, this indicated that a possible nonlinear relationship would have no effect on the results.
Model performance was assessed using three indicators: (1) the C-index, used to assess the resolution of the models, (2) calibration curves, used to assess the reliability of the models, and (3) decision curves, used to assess the clinical value of the models. The models were then presented in nomogram form and applied to clinical practice.
Risk Stratification Based on the New Nomogram
To verify the independent discrimination ability of the nomogram, the patients were organized into high-risk, medium-risk, and low-risk groups based on total risk score. The K–M method was used to generate survival curves for the three risk groups.
Statistical Analysis
C-indices were calculated accurately, and calibration and decision curves were drawn. In addition, survival curves were drawn using the K–M method. Statistical analysis was carried out using SPSS 22.0 (IBM, New York, USA), R software (http://www.r-project.org), and EmpowerStats software (www.empowerstats.com, X&Y Solutions, Boston, Massachusetts, USA), and P < 0.05 was considered statistically significant.
Results
Risk Factors for Stage II/III Colon Cancer
Univariate and multivariate Cox regression analysis were performed on the 12 variables screened by Lasso regression, the results of which are shown in Table 2. The results of the univariate analysis showed that age, low differentiation, TNM stage III, PLR*, CEA*, CA19-9*, and no postoperative chemotherapy were positively correlated with the risk of death, and the risk of death in patients with lymph node metastases was higher than that in N0 patients. Both the PNI and albumin, known to be markers of nutrition, were found to be negatively associated with the risk of death. Only postoperative chemotherapy was found to be an independent risk factor for colon cancer death in the multivariate regression analysis (hazard ratio: 3.59; 95% confidence interval (CI): 2.44–5.28; P < 0.0001).
 |
Table 2 Results of Univariate and Multivariate Cox Regression Model |
The Establishment of the Nomogram
Three Cox regression models were constructed: the full model, the AIC-stepwise model, and the MFP model. The full model included 12 variables: demographic (age), pathological (degree of differentiation, T stage, N stage and TNM stage), nutrition index (prealbumin, albumin, and the PNI), inflammation index (PLR), tumor markers (CEA, CA19-9), and postoperative chemotherapy. In the AIC-stepwise model, the C-index was 0.77 (95% CI: 0.72–0.81) and the area under the curve (AUC) was 0.803. In the full model, the C-index was 0.78 (95% CI: 0.74–0.82) and the AUC was 0.814. In the MFP model, the C-index was 0.75 (95% CI: 0.75–0.83) and the AUC was 0.810. As shown in Figure 2, the model resolution of the three models is nearly identical. Furthermore, the MFP model showed that nonlinear relationships would have no effect on the results and consequently, the more streamlined AIC-stepwise model was chosen.
 |
Figure 2 The model resolution of the three models in the modeling set. (A) The modeling set; (B) The verification set, and AUC represents the area under the ROC curve. |
Evaluation of the Reliability of the AIC-Stepwise Model
The performance of the AIC-stepwise model was evaluated using a calibration curve, and the predicted probability was divided into 10 sets in order to determine whether the actual observed probability was the same as the predicted probability. The results are shown in Figure 3.
 |
Figure 3 Calibration for AIC-stepwise model. (A) Predicting the calibration curve of the patient’s 3-year overall survival; (B) Predicting the calibration curve of the patient’s 5-year overall survival. |
Evaluation of the Clinical Value of the AIC-Stepwise Model
The AIC-stepwise model represents the expected net gain for each patient as predicted by the nomogram. The decision curve AIC-stepwise model analysis showed that the prediction model had a good positive net gain, with a threshold probability of 0.1–0.5, indicating that it has good potential as a clinical application (see Figure 4).
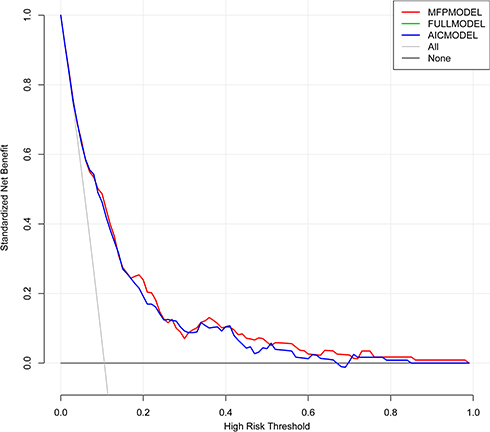 |
Figure 4 The clinical decision curves of the three models basically coincide. |
Internal Validation of the Model
Random segmentation was used in this study, and 25% of the data were used for verification. The bootstrap method was used to verify the final model. The basic principle was to replace the original data set (individually) with 1000 repeated samplings using a computer. The process was to randomly select samples with repeated replacements to form a new sample group, calculate model parameter values, and then compare them with the final model to verify the stability and accuracy of the developed model. As shown in Figure 2, the internal verification of the model in this study indicated that the results were stable and showed good fit and potential clinical benefits.
The Presentation of the Model Using a Nomogram
After considering resolution, calibration, and clinical value, the AIC-stepwise model was selected as the final model. A line diagram was used to present the model and facilitate its clinical application. The three-year and five-year OS rates of patients with stage II/III colon cancer were then mapped (see Figure 5). The principle of the nomogram is that patient variables are substituted into the corresponding points of the model, the score on the corresponding top horizontal line is the variable score, the sum of all variable scores is the total score for the patient, and the total score corresponds to the three-year and five-year OS probabilities.
 |
Figure 5 Nomogram for predicting 3 years (A) and 5 years (B) overall survival of patients in stage II/III colon cancer. In N stage, 0 means N0, 1 means N1, 2 means N2; in differentiation, 1 means high/medium differentiation, 2 means low differentiation; in postoperative chemotherapy, 1 means that postoperative chemotherapy has been performed, 2 means no postoperative chemotherapy. |
Risk Stratification Projections
To investigate the effectiveness of this nomogram, the patients in the OS cohort were categorized into either a low-risk, medium-risk, or high-risk group based on the total line map score, with each group representing a different prognosis. The K–M survival curve was then plotted, as shown in Figure 6. On the three-year OS curve, the OS in the low-risk, medium-risk, and high-risk groups was 96%, 93%, and 82%, respectively. On the five-year OS curve, the OS in the low-risk, medium-risk, and high-risk groups was 94%, 90%, and 73%, respectively. All curves were statistically different. The risk stratifications of patients with three-year and five-year OS are shown in Figure 5A and B, respectively.
 |
Figure 6 Draw the Kaplan-Meier curve of risk group stratification for overall survival. (A) In the 3-year overall survival Kaplan-Meier curve: 96% overall survival in the low-risk group, 93% overall survival in the middle-risk group, 82% overall survival in the high-risk group; (B) In the 5-year overall survival Kaplan-Meier curve: 94% overall survival in the low-risk group, 90% overall survival in the middle-risk group, 73% overall survival in the high-risk group; all curves show statistical differences. The blue line indicates low risk, the green line indicates medium risk, the red line indicates high risk. |
Discussion
This study established a predictive model for predicting survival in patients with stage II/III colon cancer using data from a single-center cohort. Considering the accuracy and applicability of the model, an objective, economical, and clinically accessible series of relevant variables were selected for analysis, with six factors eventually being integrated into the prediction model. The final model included six variables: age, CA19-9, PNI, N stage, degree of differentiation, and postoperative chemotherapy.
Previous studies have shown that age is an independent prognostic factor in patients with colon cancer and that younger patients have a better prognosis.19 Tumor markers (substances expressed and released during tumorigenesis and development) indirectly provide information about tumor biology, indicating relative tumor load and biological invasiveness.20 CEA and CA19-9 are two such laboratory markers and as a result of their convenience of use and cost effectiveness, they are widely used in the early diagnosis and prognostic evaluation of colon cancer.21–24 In colon cancer, patients often experience malnutrition because it develops slowly, and the incidence can be as high as 31.0%.25 Peng et al26 and Zhou et al27 discussed the evaluation of prognosis in patients with colorectal cancer using the PNI. Their results indicated that the PNI is another important predictor of survival following radical resection of colorectal cancer. Previous related studies have shown that histological low differentiation is also associated with poor prognosis in patients with colon cancer.
The current guidelines of the National Comprehensive Cancer Network and American Society of Clinical Oncology state that patients with stage III and high-risk stage II colon cancer following radical resection may benefit from postoperative adjuvant chemotherapy,28 the purpose of which is to eliminate small metastatic lesions thereby reducing recurrence and metastasis rate and prolonging patient survival. Sanoff et al29 also concluded that adjuvant chemotherapy in patients with colon cancer has survival benefits.
A literature search on PubMed identified a model-driven study on the prognosis of colon cancer. Previous similar studies have included one by Valentini et al,17 who developed a well-known prediction model that demonstrated a good C-index and used the largest data set from clinical trials (n = 2795). However, this model is only applicable to patients in Western countries with rectal cancer who receive radiotherapy and chemotherapy, and this treatment combination is not common in East Asian countries. Kawai et al, Li et al, and Zhong et al30–32 also developed prognostic models for patients with colorectal cancer, but their models were limited by their small sample sizes, insufficient C-indices, and limited target outcomes. Wu et al and Zhang et al33,34 published articles about colon cancer prediction models using data from the United States surveillance, epidemiology, and end results program database. While the C-indices of these models were between 0.62 and 0.75, most of the EPVs were not mentioned. Previous research clearly shows that the prognosis of colon cancer varies in different populations. Therefore, the applicability of these models to the Chinese population needs further verification.
In the present study, the C-index, calibration curves, and decision curves were used to comprehensively evaluate the final model for resolution, reliability, and clinical application value. In addition, a nomogram was created for use by clinicians. At the same time, the risk groups were stratified according to total survival, and a series of results showed that the prediction model was stable, with good resolution, reliability, and net gain.
At the same time, the model developed in this research provides a quantitative prognostic assessment for individual patients. In this study, postoperative chemotherapy was included in the construction of the prediction model, and multi-impact analysis suggested that postoperative chemotherapy is an independent prognostic factor for the prognosis of stage II/III colon cancer. Therefore, compared with radical surgery alone, our model can evaluate postoperative The efficacy of adjuvant chemotherapy.
Example 1: two postoperative patients with stage II colon cancer, both aged 60 years (approximately 8 points), both with stage N0 (0 points), PNI 40 (approximately 85 points), CA199 of 30 U/mL (30 points), and a high degree of tissue differentiation (0 points). One patient received postoperative chemotherapy (0 points), while the other patient did not (25 points). According to the nomogram, these two patients had three-year OS of 93% and 75% respectively, and five-year OS was 86% and 65%, respectively.
Example 2: two postoperative patients with stage III colon cancer, both aged 70 years (approximately 10 points), both with stage N2 (33 points), PNI of 45 (approximately 80 points), CA199 of 30 U/mL (30 points), and well-differentiated tumor cells (0 points). One patient received postoperative chemotherapy (0 points), while the other patient did not (25 points). The three-year OS of the patients was 75% and 37%, respectively. The annual OS rates were 63% and 22%, respectively. Therefore, through the above examples, doctors will be better able to formulate beneficial individualized treatment and follow-up plans for patients with different prognosis based on patient scores.
There are currently no other prediction models specifically designed for patients with colon cancer in stage II/III, the stage with the most cases. Although the prognosis of stage II/III colon cancer is better than that of stage IV, there are still many limitations to its treatment. Therefore, this study has the following advantages and clinical value: (1) it has, for the first time, constructed a predictive model for patients with stage II/III colon cancer. This model will help clinicians to predict the prognosis of patients with colon cancer and to guide clinical treatment, (2) the indicators used in the final model are all clinically accessible, supporting the ease of use and extensibility of the model, and (3) the nomogram created for the model presents the results clearly and accessibly.
However, this study does have some limitations: (1) no external validation was performed so a multicenter external validation of the model should be carried out in the future, (2) although the penalty function was used to reduce dimensions thereby improving the stability of the model by increasing EPV, the EPV in the study was just under 20. Previous literature shows that the risk of overfitting decreases significantly when the EPV is higher than 30, making the model more stable, (3) the predictions of the model constructed in this study are only applicable to patients with stage II/III colon cancer and cannot be used to assess the prognosis of stage I or IV colon cancer and malignant tumors, (4) the study excluded patients with preoperative infection, therefore, the application scenario of the constructed model is limited and cannot be used for such patients, and (5) only Chinese patients were included in this study, so external validation will be required to determine whether the results can be applied to foreign patients.
Conclusion
A model based on patient age, CA19-9, PNI, N stage, degree of differentiation, postoperative chemotherapy, and risk group stratification was successfully established and validated. This model will help clinicians to quickly and accurately assess the prognosis and survival of patients with stage II/III colon cancer, and at the same time identify high-risk groups and effectively develop corresponding individualized postoperative treatment plans, postoperative monitoring, and follow-up strategies.
Ethics Approval and Consent to Participate
This study was conducted with approval from the Ethics Committee of Affiliated Hospital of Guizhou Medical University (FZ 2018-12-031). This study was conducted in accordance with the declaration of Helsinki. As this study was a retrospective cohort study, the data was anonymous and informed consent was not required.
Acknowledgments
We would like to thank all colleagues in the Department of Oncology of the Affiliated Hospital of Guizhou Medical University; they participated in current research.
Funding
Major research project of the Innovation Department of the Ministry of Education of Guizhou Province (QJH-KY-Z [2018] 020).
Disclosure
The authors declare that they have no conflicts of interest for this work.
References
1. Bray F, Ferlay J, Soerjomataram I, et al. Global cancer statistics 2018: GLOBOCAN estimates of incidence and mortality worldwide for 36 cancers in 185 countries: global cancer statistics 2018. CA Cancer J Clin. 2018;68(6):394–424. doi:10.3322/caac.21492
2. Fu J, Huang Y, Yang J, et al. Clinical characteristics and prognosis of young patients with colorectal cancer in Eastern China. World J Gastroenterol. 2013;19(44):8078–8084. doi:10.3748/wjg.v19.i44.8078
3. Li M, Gu J. Changing patterns of colorectal cancer in China over a period of 20 years. World J Gastroenterol. 2005;11(30):4685–4688. doi:10.3748/wjg.v11.i30.4685
4. Stormark K, Soreide K, Soreide JA, et al. Nationwide implementation of laparoscopic surgery for colon cancer: short-term outcomes and long-term survival in a population-based cohort. Surg Endosc. 2016;30(11):4853–4864. doi:10.1007/s00464-016-4819-8
5. Sobrero A, Lonardi S, Rosati G, et al. FOLFOX or CAPOX in stage II to III colon cancer: efficacy results of the Italian three or six colon adjuvant trial. J Clin Oncol. 2018;36(15):1478–1485. doi:10.1200/JCO.2017.76.2187
6. Hari DM, Leung AM, Lee JH, et al. AJCC cancer staging manual 7th edition criteria for colon cancer: do the complex modifications improve prognostic assessment. J Am Coll Surg. 2013;217:181–190. doi:10.1016/j.jamcollsurg.2013.04.018
7. Webber C, Gospodarowicz M, Sobin LH, et al. Improving the TNM classification: findings from a 10-year continuous literature review. Int J Cancer. 2014;135:371–378. doi:10.1002/ijc.28683
8. Zhao P, Ma J, Qin SZ, et al. China cancer clinical yearbook. Chinese Journal of Frontier Medicine. 2017, 9(5):153–160.
9. Su BB, Shi H, Wan J. Role of serum carcinoembryonic antigen in the detection of colorectal cancer before and after surgical resection. World J Gastroenterol. 2012;18(17):2121–2126. doi:10.3748/wjg.v18.i17.2121
10. Van Halteren HK, Houterman S, Verheij CD, et al. Anaemia prior to operation is related with poorer long-term survival in patients with operable rectal cancer. Eur J Surg Oncol. 2004;30(6):628–632. doi:10.1016/j.ejso.2004.04.014
11. Maeda K, Shibutani M, Otani H, et al. Inflammation-based factors and prognosis in patients with colorectal cancer. World J Gastroenterol Oncol. 2015;7(8):111–117.
12. Huang L, Fang J, Wu J, et al. The value of preoperative serum tumor markers combined with blood routine indicators in evaluating the prognosis of patients with colorectal cancer. Chin J Gastrointest Surg. 2018;21(12):1421–1426.
13. Ciardiello F, Tortora G. EGFR antagonists in cancer treatment. N Engl J Med. 2008;358(11):1160–1174. doi:10.1056/NEJMra0707704
14. Haseba M, Hidaka S, Tsuji T, et al. Detection of p53 gene mutations by nonisotopic RNase cleavage assay as a predictor of poor prognosis in colorectal cancers. Dig Dis Sci. 2003;48(10):1984–1989. doi:10.1023/A:1026126522278
15. Liu YJ, Yan PS, Li J, Jia JF. Expression and significance of CD44s, CD44v6, and nm23 mRNA in human cancer. World J Gastroenterol. 2005;11(42):6601–6606. doi:10.3748/wjg.v11.i42.6601
16. Dalchau R, Kirkley J, Fabre JW. Monoclonal antibody to a human brain granulocyte-T lymphocyte antigen probably homologous to the W 3/13 antigen of the rat. Eur J Immunol. 1980;10(10):745–749. doi:10.1002/eji.1830101004
17. Valentini V, Van Stiphout RG, Lammering G, et al. Nomograms for predicting local recurrence, distant metastases, and overall survival for patients with locally advanced rectal cancer on the basis of European randomized clinical trials. J Clin Oncol. 2011;29(23):3163–3172. doi:10.1200/JCO.2010.33.1595
18. Pavlou M, Ambler G, Seaman SR, et al. How to develop a more accurate risk prediction model when there are few events. BMJ. 2015, 11;351:h3868. doi:10.1136/bmj.h3868
19. Abasse Kassim S, Tang W, Abbas M, et al. Clinicopathologic and epidemiological characteristics of prognostic factors in post-surgical survival of colorectal cancer patients in Jiangsu Province, China. Cancer Epidemiol. 2019;62:101565. doi:10.1016/j.canep.2019.07.004
20. Kanakis G, Kaltsas G. Biochemical markers for gastroenteropancreatic neuroendocrine tumours (GEP-NETs). Best Pract Res Clin Gastroenterol. 2012;26:791–802. doi:10.1016/j.bpg.2012.12.006
21. Nozoe T, Rikimaru T, Mori E, et al. Increase in both CEA and CA19-9 in sera is an independent prognostic indicator in colorectal carcino- ma. J Surg Oncol. 2010;94(2):132–137. doi:10.1002/jso.20577
22. Pietrzyk L, Plewa Z, Denisow-Pietrzyk M, et al. Diagnostic power of blood parameters as screening markers in gastric cancer patients. Asian Pac J Cancer Prev. 2016;17(9):4433–4437.
23. Sun Z, Wang F, Zhou Q, et al. Pre-operative to post-operative serum carcinoembryonic antigen ratio is a prognostic indicator in colorectal cancer. Oncotarget. 2017;8(33):54672–54682. doi:10.18632/oncotarget.17931
24. Kim CG, Ahn JB, Jung M, et al. Preoperative serum carcinoembryonic antigen level as a prognostic factor for recurrence and survival after curative resection followed by adjuvant chemotherapy in stage III colon cancer. Ann Surg Oncol. 2017;24(1):227–235. doi:10.1245/s10434-016-5613-5
25. Gur AS, Atahan K, Aladag I, et al. The efficacy of nutrition risk screening-2002 (NRS-2002) to decide on the nutritional support in general surgery patients. Bratisl Lek Listy. 2009;110:290–292.
26. Peng J, Zhang R, Zhao Y, et al. The prognostic value of preoperative prognostic nutrition index in patients with stage III colon cancer and its correlation with systemic inflammatory response markers. Cancer. 2019;038(001):10–22.
27. Zhou H, Wang W, Zhang R, et al. Prognostic nutrition index for evaluating the prognosis of locally advanced colorectal cancer. J Guizhou Med Univ. 2019;44(3):335–340.
28. Benson AB
29. Sanoff HK, Carpenter WR, Sturmer T, et al. Effect of adjuvant chemotherapy on survival of patients with stage III colon cancer diagnosed after age 75 years. J Clin Oncol. 2012;30(21):2624–2634. doi:10.1200/JCO.2011.41.1140
30. Kawai K, Ishihara S, Yamaguchi H, et al. Nomograms for predicting the prognosis of stage IV colorectal cancer after curative resection: a multicenter retrospective study. Eur J Surg Oncol. 2015;41(4):457–465. doi:10.1016/j.ejso.2015.01.026
31. Li C, Pei Q, Zhu H, et al. Survival nomograms for stage III colorectal cancer. Medicine. 2018;97(49):e13239. doi:10.1097/MD.0000000000013239
32. Zhong JW, Yang SX, Chen RP, et al. Prognostic value of lymphovascular invasion in patients with stage III colorectal cancer: a retrospective study. Med Sci Monit. 2019;25:6043–6050. doi:10.12659/MSM.918133
33. Wu Q, Wang WJ, Huang YQ, Fang SY, Guan YJ. Nomograms for estimating survival in patients with liver-only colorectal metastases: a retrospective study. Int J Surg. 2018;60:1–8. doi:10.1016/j.ijsu.2018.10.032
34. Zhang JY, Gong Z, Gong YW, Guo WJ. Development and validation of nomograms for prediction of overall survival and cancer-specific survival of patients with Stage IV colorectal cancer. Jpn J Clin Oncol. 2019;49(5):438–446. doi:10.1093/jjco/hyz035
 © 2022 The Author(s). This work is published and licensed by Dove Medical Press Limited. The full terms of this license are available at https://www.dovepress.com/terms.php and incorporate the Creative Commons Attribution - Non Commercial (unported, v3.0) License.
By accessing the work you hereby accept the Terms. Non-commercial uses of the work are permitted without any further permission from Dove Medical Press Limited, provided the work is properly attributed. For permission for commercial use of this work, please see paragraphs 4.2 and 5 of our Terms.
© 2022 The Author(s). This work is published and licensed by Dove Medical Press Limited. The full terms of this license are available at https://www.dovepress.com/terms.php and incorporate the Creative Commons Attribution - Non Commercial (unported, v3.0) License.
By accessing the work you hereby accept the Terms. Non-commercial uses of the work are permitted without any further permission from Dove Medical Press Limited, provided the work is properly attributed. For permission for commercial use of this work, please see paragraphs 4.2 and 5 of our Terms.