")
Back to Journals » Clinical Interventions in Aging » Volume 19
Development and Validation of Estimation Equations for Appendicular Skeletal Muscle Mass in Chinese Community-Dwelling Older Adults
Authors Sun Y, Yin T, Li M, Wang F, Qi J, Zhang H , Wang L , Zhao J, Zhang Y
Received 19 September 2023
Accepted for publication 17 January 2024
Published 16 February 2024 Volume 2024:19 Pages 265—276
DOI https://doi.org/10.2147/CIA.S440967
Checked for plagiarism Yes
Review by Single anonymous peer review
Peer reviewer comments 2
Editor who approved publication: Dr Maddalena Illario
Yun Sun,1,* Tongtong Yin,2,* Mengli Li,2,3 Fangfang Wang,2 Jiaying Qi,2 Hui Zhang,2,4 Li Wang,2 Jiehua Zhao,5 Yu Zhang5
1Department of Oncology, Suzhou BenQ Medical Center, Suzhou, Jiangsu, People’s Republic of China; 2School of Nursing, Suzhou Medical College of Soochow University, Suzhou, Jiangsu, People’s Republic of China; 3School of Nursing, Hong Kong Polytechnic University, Hongkong, People’s Republic of China; 4School of Nursing, Vocational Health College, Suzhou, Jiangsu, People’s Republic of China; 5Department of Nursing, Suzhou BenQ Medical Center, Suzhou, Jiangsu, People’s Republic of China
*These authors contributed equally to this work
Correspondence: Yu Zhang; Jiehua Zhao, Email [email protected]; [email protected]
Purpose: This study aimed to establish equations for estimating muscle mass through anthropometric parameters or together with physical function parameters in the community-dwelling older adults, providing a simple way of muscle mass assessment.
Methods: In this cross-sectional descriptive study, a total of 1537 older adults were recruited from the community and accepted the measurements of height, weight, upper arm and calf circumferences, grip strength, and walking speed. Body composition including appendicular skeletal muscle mass (ASM) was measured using bioelectrical impedance analysis (BIA). Participants were randomly divided into the development or validation group. Stepwise multiple linear regression was applied to develop equations in the development group. Thereafter, Pearson correlation coefficients, Bland-Altman plots, paired t-test, intraclass correlation coefficient (ICC) and paired-samples t-tests were used to assess the validity of the equations.
Results: All parameters were significantly correlated with ASM (r = 0.195~0.795, P < 0.001) except for the age in the validation group (P = 0.746). The most optimal anthropometric equation was: [adjusted R2 = 0.911, standard error of the estimate (SEE) = 1.311, P < 0.001]. Comparatively speaking, this equation showed high correlation coefficient (r = 0.951, P < 0.001) and ICC (ICC = 0.950, P < 0.001). No significant differences were found between BIA-measured ASM and the estimated ASM. The Bland-Altman plot showed that the mean difference between the estimated ASM and BIA-measured ASM was 0 kg and the limits of agreement of ASM was − 2.70~2.60 kg. Furthermore, inclusion of physical function did not significantly improve the adjusted R2 and SEE.
Conclusion: The anthropometric equation offers a practical alternative simple and dependable method for estimating ASM in community-dwelling older adults.
Keywords: appendicular muscle mass, anthropometry, physical function, estimation equation, older adults
Introduction
Muscles are the foundation of human physiological activities, and muscle mass is closely associated with physical function, quality of life, and overall health.1 Research has shown that muscle mass reaches its peak around the age of 25 and gradually declines after the age of 35.2 After the age of 50, muscle mass loss ranges from 1% to 2% per year, with even more pronounced decline in older adults.2 Insufficient muscle mass hinders the normal movement of joints, leading to functional impairments such as falls3 and fragility fractures4 in older adults, triggering a series of adverse health events. The reduction in muscle mass is also one of the diagnosis criteria for sarcopenia,5 which is known to be more prevalent in older populations6 and associated with a wide range of adverse outcomes including heart failure,7 increased risk of falls8 and mortality.9 Therefore, timely and convenient assessment of muscle mass in the older adults is crucial. Although there is currently no global consensus on diagnostic criteria for sarcopenia,10–13 assessment of muscle mass is mainly achieved through bioelectrical impedance analysis (BIA) and dual-energy x-ray absorptiometry (DXA).6 However, the instruments required for these methods are expensive and bulky, and the operating procedures require strict training, which limits their application in community settings. Therefore, exploring simple and inexpensive methods for assessing muscle mass will help community healthcare workers and residents quickly assess their health status. Appendicular skeletal muscle mass (ASM) which refers to the skeletal muscle mass of the limbs is the main parameter included in body composition measurement,14 muscle health assessment,15 and disease research.16
Calf circumference is an easy, low-cost, and universally accessible anthropometric measure, which has been previously reported to have a high to moderate correlation with ASM.17–19 Considering individual differences in body shape, the accuracy of using calf circumference alone for ASM estimation may be challenged, at least in some individuals. Other anthropometric measurements, including height, weight, and arm circumference, are commonly involved in health examinations. Taking multiple-anthropometric indicators of both the upper and lower bodies into account is expected to produce more accurate estimation.
However, the accuracy of these easily measured anthropometric parameters in estimation of ASM could be influenced by fat mass and other tissue mass. Since muscle mass is closely related to muscle function, which in turn impacts overall physical function,1 indicators of physical function may be able to improve the accuracy of the estimation. Grip strength and walking speed are the most commonly used indicators to assess muscle function.13,20 Whether multiple simple anthropometric parameters together with these commonly used physical function parameters are able to produce more accurate estimation of ASM also wait to be determined.
Previous studies have tried to use simple anthropometric parameters and physical function parameters to estimate muscle function and muscle mass, providing a faster and more comprehensive assessment of current muscle and overall physical health.14 Similar studies have been conducted in the population from United States,17 Japan,21 England,22 Korea23 and other countries.14 The results have shown that these equations have good estimating power, but there are differences in the estimating models across different nations. Furthermore, the inclusion of physical function in different studies has varying influence on the predictive accuracy of the model.20,24 The estimating models of ASM were also developed in Chinese populations, but the studies had small sample sizes,20,25 limited populations,24,26 or lack of the validation of the evaluation method.27
In this study, we aimed to develop and validate simple equation for ASM estimation with anthropometric parameters and physical function parameters in community-dwelling older adults. The results are expected to provide a simple and inexpensive method to assess muscle mass which meet the needs of the institutions with limited medical care resources.
Materials and Methods
Study Design and Participants
This is a cross-sectional, correlational research project. The participants were recruited from the communities in Suzhou, China, from Nov. 2019 to Oct. 2020. The inclusion criteria included the patients who (1) were ≥60 years old; (2) could stand independently without the use of any assistive devices or help from others; (3) were willing to participate and provided informed consent. The exclusion criteria included the participants who (1) had presence of cardiac stents, pacemakers, steel plates, steel nails, etc. in the body and therefore not suitable for BIA measurement; (2) suffered from severe heart, liver, kidney dysfunction, respiratory failure, or in the acute phase, such as acute myocardial infarction, and therefore not suitable for physical function test; (3) had mental illness, comprehension difficulties, or communication barriers; (4) had conditions that may affect the accuracy of body composition testing, such as edema. All participants were fully informed about the research purpose and characteristics before they provided signed consent.
Subjects underwent measurements of height, weight, upper arm circumference, calf circumference, and physical function, including grip strength assessments and walking speed measurements. For estimation model development and validation, participants were randomly allocated with 70% to development group (n = 1076) and 30% to validation group (n = 461), respectively. Many investigations on the optimality of data splitting ratio currently have not led to any consensus.28 However, extensive numerical studies have indicated that a value of around 30% to be a reasonable choice.28 The 7:3 ratio assignment was also used in previous similar studies.19,29 The specific procedure for randomization was as follows. The research subjects were assigned numbers according to their inclusion order. Random numbers were generated for each research subject using IBM.SPSS 26.0 software, ensuring that each subject corresponds to a unique random number. Subsequently, the random numbers were arranged in ascending order. Finally, the research subjects were divided into a development group (70%) and a validation group (30%) according to a ratio of 7:3.
Anthropometric Parameters
Upper Arm Circumference
The circumference of the upper arm was measured using an inelastic tape. The subjects were instructed to expose the non-dominant side of their body and relax their arm. The circumference of the midpoint between the acromion and olecranon of the arm30 was measured in centimeters (cm) with a precision of 0.1, and the average of the two measurements was used as the final result in this study.
Calf Circumference
The circumference of the calf was measured using an inelastic tape. The subjects were instructed to sit upright with their torso straight, legs apart, calves relaxed, feet flat on the ground, thighs and calves forming a 90-degree angle. The circumference of the thickest part of the non-dominant calf31 was measured in centimeters (cm) with a precision of 0.1, and the average of the two measurements was used as the final result in this study.
Physical Function Parameters
Grip Strength
The grip strength was measured using a Jamar hand dynamometer (model 563213, USA), which is widely recognized as the “gold standard” for grip strength testing in scientific research.32 The testing method recommended by the American Society of Hand Therapists in 1992 was used: after resting for 5 minutes, the subjects sat in front of the instrument with their torso upright, shoulder joint in a neutral position, and elbow joint at 90 degrees, with the forearm and hip joint in a neutral position.33 During the test, the subjects squeezed the dynamometer with maximum effort and held it for 3 seconds. Three trials were conducted for each hand with a 30-second interval between each trial, and a 1-minute rest was given between each set. If the coefficient of variation (CV%) of the three sets was greater than 10%, the test was repeated after a 20-minute rest. The average grip strength of both hands was used as the test result in this study.
Walking Speed
The 6-meter usual walking speed was measured. Prior to the test, a 10-meter straight line was marked using a meter ruler, with the middle 6 meters selected and red cones placed at both ends. The subjects were instructed to walk the entire 10 meters at their usual walking speed and the time taken to walk the 6 meters was recorded. Two trials were conducted with a 30-second interval between each trial. Before the test, the researchers explained and demonstrated the testing procedure to ensure that the subjects fully understood the instructions. The average of the two walking speeds was used as the test result in this study.
Muscle Mass
The body composition was measured using a body composition analyzer (TANITA, MC-180, Japan). TANITA MC-180 measures ASM through multi-frequency 8-electrode BIA. The subjects were instructed to keep fast for 8 hours and avoid vigorous exercise 1 hour prior to the test, and remove items that may affect the measurement, such as mobile phones and metal jewelry, and take off their shoes, socks, and heavy clothing. During the test, the subjects stood upright with their whole body relaxed, hands and feet in close contact with the electrode points, shoulder joints slightly abducted, and trunk and upper limbs at a 15-degree angle. This posture was maintained until the end of the test and subjects should avoid talking or laughing during the test.
Statistical Analysis
The data of the development group was used to develop estimating equations, and of the validation group served as a validation dataset. The Kolmogorov–Smirnov test was used for verifying the normal distribution of data. Mean values of the two groups were compared using independent samples t-test. The correlation between anthropometric/physical function measures and BIA-measured ASM was calculated using Pearson’s correlation coefficient.
To develop the estimating equations, stepwise linear regression analyses were performed with BIA-measured ASM as dependent variable and anthropometric parameters (age, sex, height, weight, upper arm circumference and calf circumference) and physical function parameters (grip strength, and walking speed) as independent variables. The collinearity between variables was verified by the variance inflation factors and tolerance values. The independence of residual error was tested by the Durbin–Watson method. One independent variable was included or excluded at each step of stepwise method based on the P value of probability of F: P < 0.05 to include and P > 0.10 to exclude. The process iterates until none improves the model to a statistically significant extent.34
To assess the validity of the equations, we calculated the estimated ASMs by applying the data of the validation group to the formulated estimation equations. Pearson correlation coefficients were used to evaluate the correlations between BIA-measured and estimated ASMs, and paired t-test was applied to assess their differences. Bland-Altman plots were performed to assess the distributions of random and systematic errors.35 The x-axis represented the mean estimated and BIA-measured ASMs, whereas the y-axis represented the difference (estimated ASMs - BIA-measured ASM). Agreements between the BIA-measured and estimated ASMs were assessed using intraclass correlation coefficient (ICC).
The significance level was set at P < 0.05. Data were analyzed using SPSS 26.0 (IBM, Armonk, NY, USA).
Results
Characteristics of the Participants
A total of 1537 participants accepted the tests. The mean ages of the men and women were 72.57 ± 5.59 (60.00–91.00) and 72.24 ± 5.66 (60.00–97.00) years old, respectively. The mean BMI of the men and women were 23.75 ± 2.95 (14.50–37.10) and 23.61 ± 3.33 (15.50–35.00) kg/m², respectively. The mean BIA-measured ASM of men and women was 21.98 ± 3.17 (13.00–34.40) and 14.89 ± 1.98 (9.60–24.10) kg, respectively.
The characteristics of the participants in the development and validation groups were shown in Table 1. No significant differences were found in the characteristics between the two groups in both men and women except for age and walking speed.
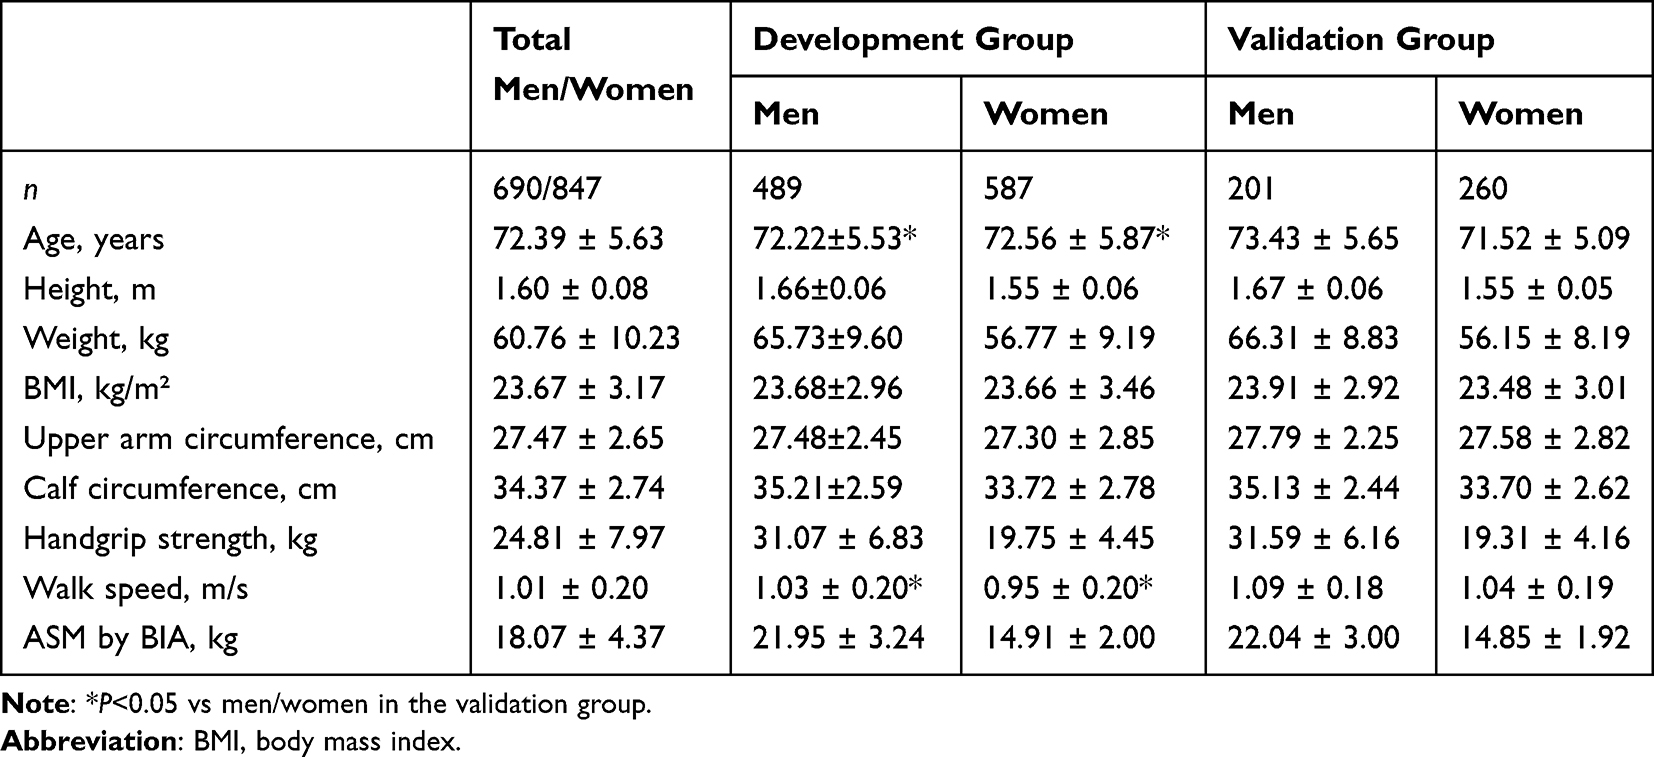 |
Table 1 Characteristics of Participants in the Development and Validation Groups |
Development of the Estimating Equations for ASM
Pearson correlation coefficients of anthropometric parameters and physical function parameters with BIA-measured ASM were shown in Table 2. All parameters were significantly correlated with ASM except for the age in the validation group (P = 0.746). Among the parameters, weight (r = 0.792 and 0.808, respectively), height (r = 0.791 and 0.792, respectively) and handgrip strength (r = 0.753 and 0.754, respectively) were strongly correlated with BIA-measured ASM in both development group and validation group.
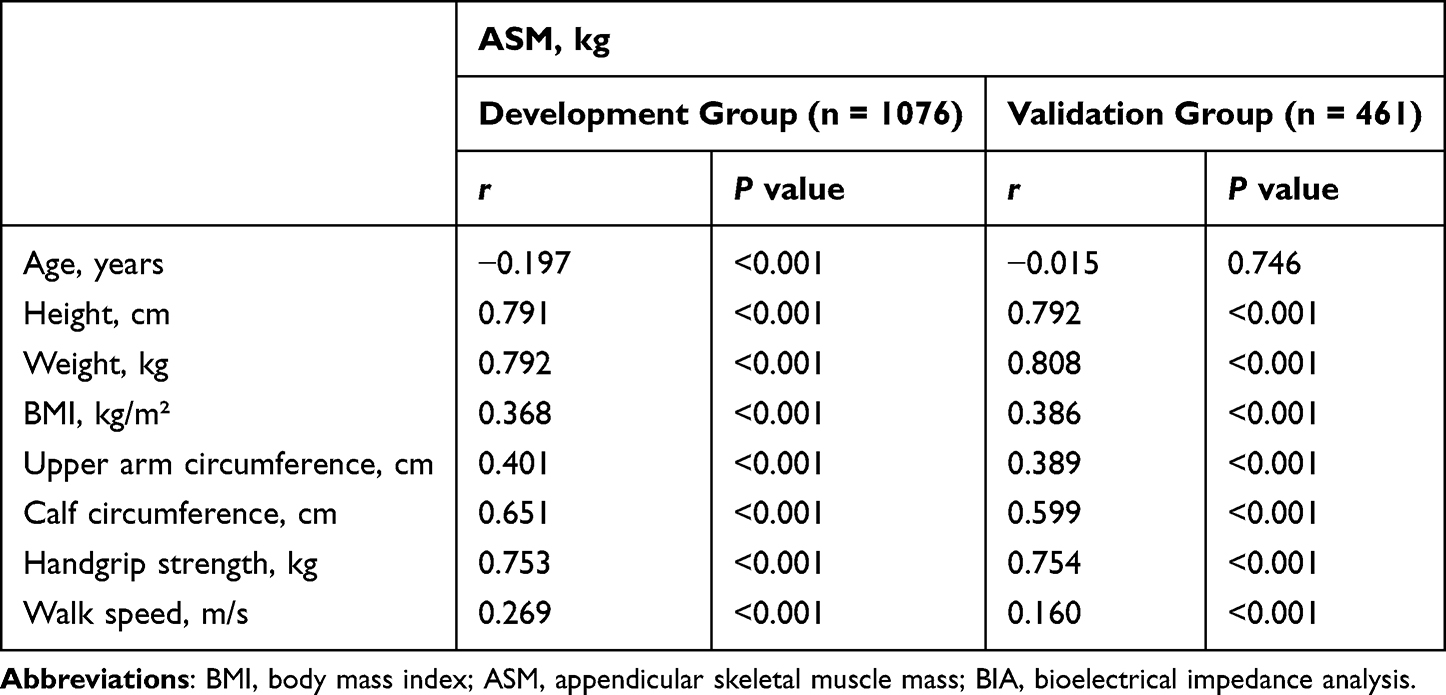 |
Table 2 Pearson’s Correlation Coefficients of Anthropometric and Physical Function Parameters with BIA-Measured ASM |
The BIA-measured ASM estimating equations were yielded by stepwise multiple linear regression firstly through using anthropometric parameters (Table 3). The equations No. 4 and 5 in Table 3 which were based on the parameters of age, sex, weight, height, calf circumference with or without arm circumference had the largest adjusted R2 (0.911) and the smallest standard error of the estimate (SEE) (1.3110 and 1.3050 respectively).
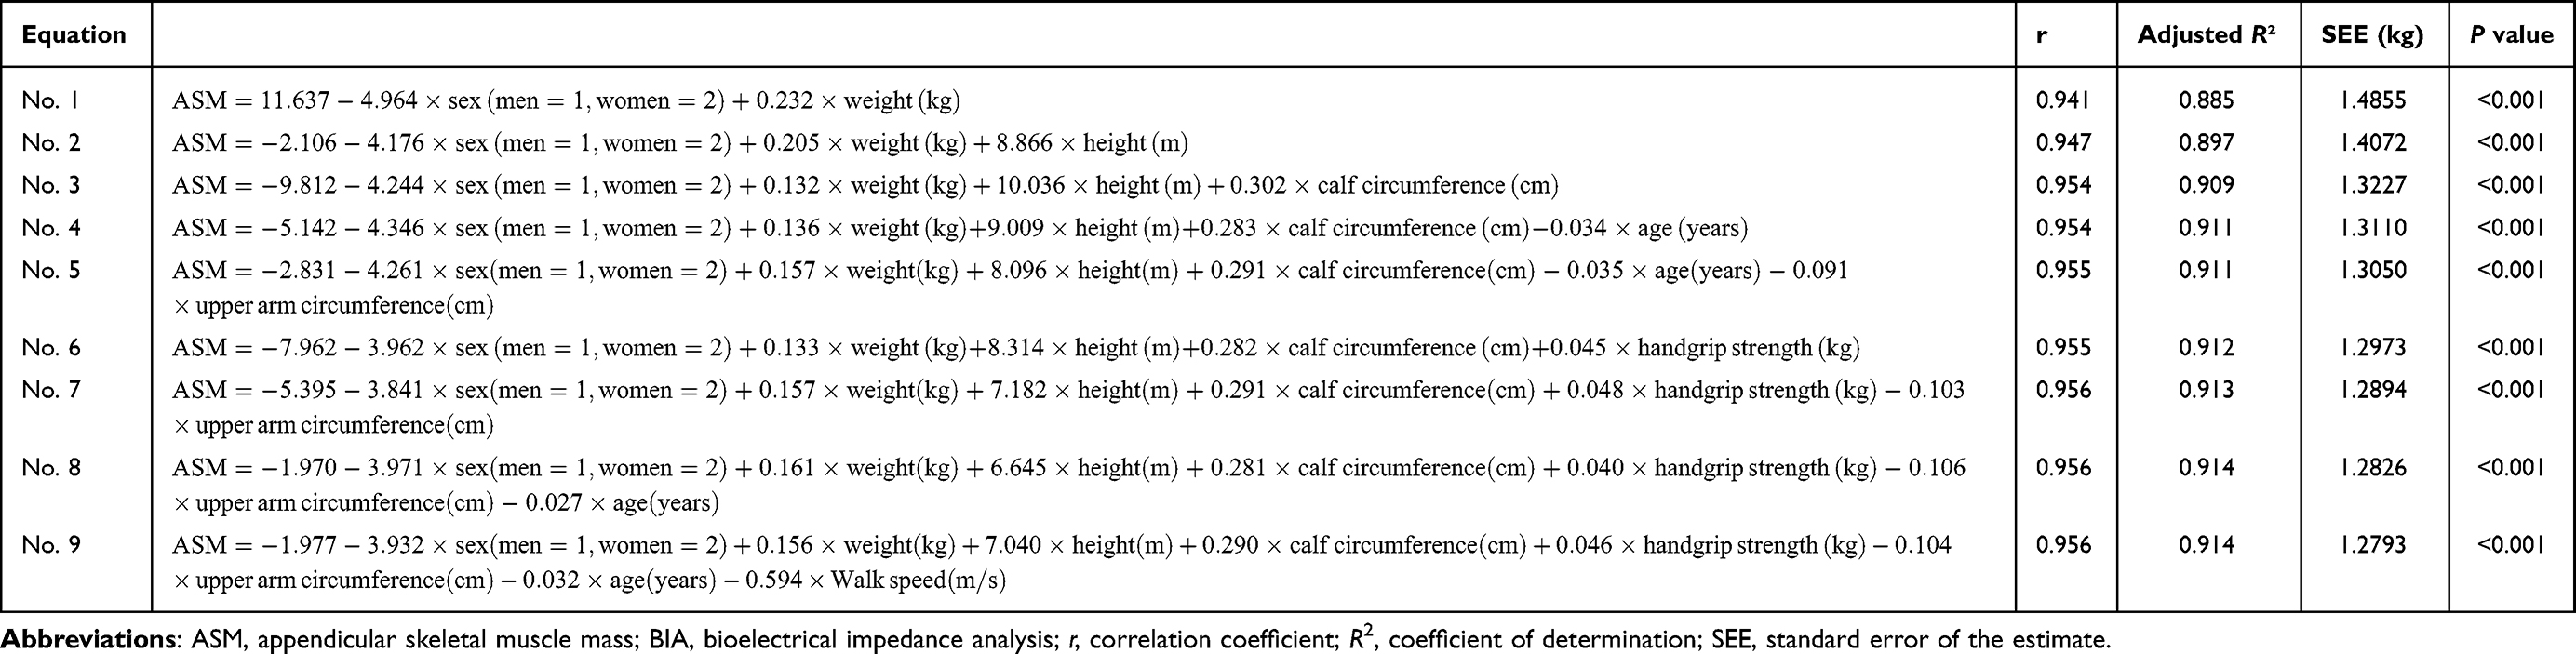 |
Table 3 BIA-Measured ASM Estimating Equations Deduced from Age, Anthropometric and Physical Function Parameters (n = 1076) |
Secondly, physical function parameters of handgrip strength and walking speed were added in the regression analysis and the equations of No. 8 and No. 9 (in Table 3) had the largest adjusted R2 (0.914) and the smallest SEE (1.2826 and 1.2793 respectively).
The subsequent validation was performed with the equations of No. 4, 5, 8, 9 in Table 3.
Validation of the ASM Estimating Equations
The developed equations (No. 4, 5, 8 and 9) were applied to the validation group to produce the estimated ASMs (ASM4, 5, 8 and 9). The mean BIA-measured ASM in the validation group was 17.99±4.33 (10.0~30.5) kg. No significant differences were found between the BIA-measured ASM and the estimated ASMs except for ASM9 (P = 0.027) (Table 4). The ICC between the BIA-measured ASM and the estimated ASMs were greater than 0.940 (P < 0.001). The estimated ASMs were strongly correlated with BIA-measured ASM (r = 0.951, P < 0.001; Figure 1).
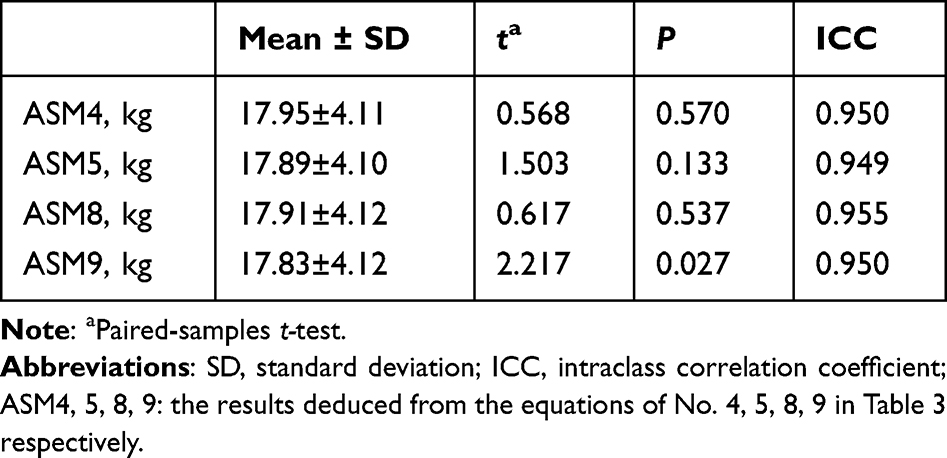 |
Table 4 Comparison of the Estimated ASMs with BIA-Measured ASM (n = 461) |
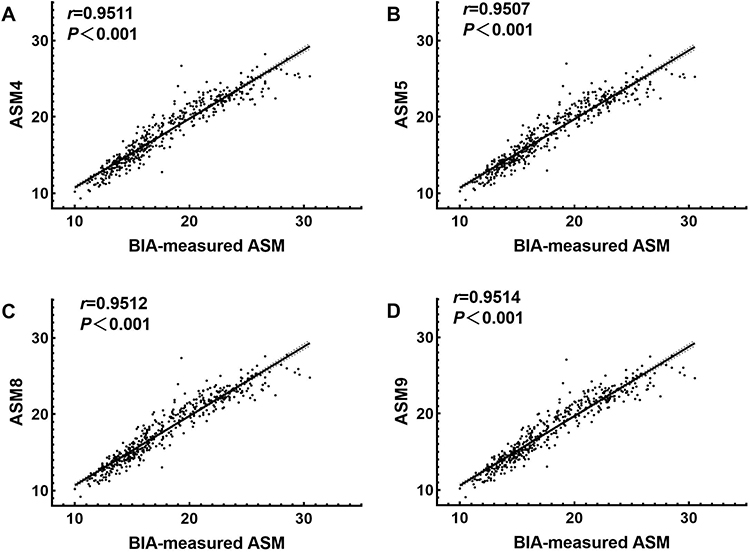 |
Figure 1 Correlation between Estimated ASMs by the Equations and BIA-measured ASM in the Validation Group. (A) Correlation between ASM4 and BIA-measured ASM. (B) Correlation between ASM5 and BIA-measured ASM. (C) Correlation between ASM8 and BIA-measured ASM. (D) Correlation between ASM9 and BIA-measured ASM. Abbreviations: ASM, appendicular skeletal muscle mass; BIA, bioelectrical impedance analysis; r, correlation coefficient; ASM4, 5, 8, 9, the results deduced from the equations of No. 4, 5, 8, 9 in Table 3 respectively. |
The Bland-Altman plot showed that the mean difference between the estimated ASMs (ASM4, 5, 8 and 9) and BIA-measured ASM were 0, −0.10, 0, 0.1kg respectively, and the limits of agreement (mean ± 1.96 SD) of ASM were (−2.70~2.60), (−2.70~2.50), (−2.60~2.60), (−2.70~2.50) respectively (Table 5 and Figure 2). Based on Figure 2, it can be observed that the majority of scatter points (438–439 cases) fall within the 95% limits of agreement (LoA), indicating a high agreement rate of 95% between the estimated ASMs and BIA-measured ASM.
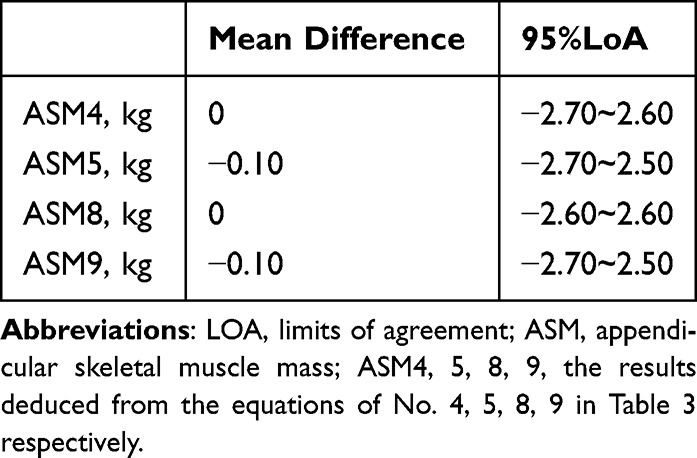 |
Table 5 The Bland-Altman Plot of the Estimated ASMs with Different Equations (n=461) |
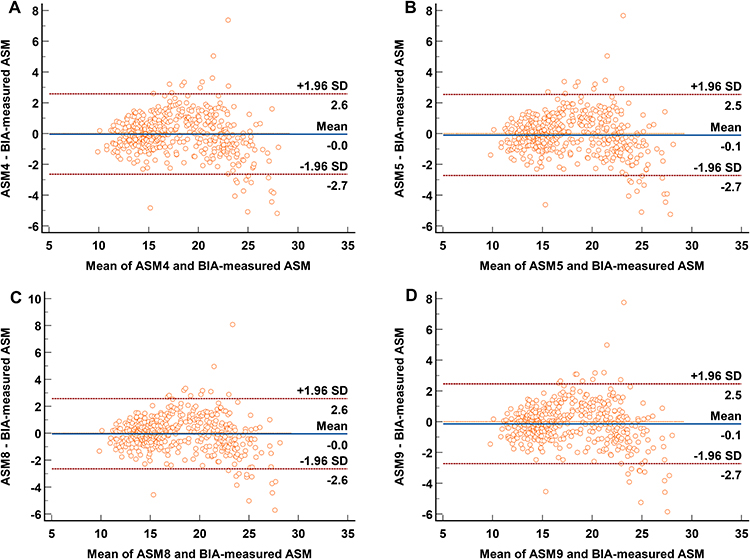 |
Figure 2 Bland-Altman plots of estimated ASMs and BIA-measured ASM in the validation group. (A) Bland-Altman plots of ASM4 and BIA-measured ASM. (B) Bland-Altman plots of ASM5 and BIA-measured ASM. (C) Bland-Altman plots of ASM8 and BIA-measured ASM. (D) Bland-Altman plots of ASM9 and BIA-measured ASM. Abbreviations: ASM, appendicular skeletal muscle mass; BIA, bioelectrical impedance analysis; SD, standard deviation; ASM4, 5, 8, 9, the results deduced from the equations of No. 4, 5, 8, 9 in Table 3 respectively. Note: Dotted horizontal lines represent the mean difference and limits of agreement defined as the mean difference ± 1.96SD. |
Discussion
In the current study, anthropometric and/or physical function indicators were used as independent variables, and a stepwise multiple linear regression analysis was conducted to establish equations for estimating ASM and validate them. The established equations provide a convenient, simple, and inexpensive method for assessing ASM in community-dwelling older adults.
Previous Research
In previous studies, some researchers have explored the correlation between anthropometric and/or physical function indicators and ASM. Researchers from several countries14 like America,17 Japan,21 England,22 Korea23 have used anthropometric indicators and physical function parameters to estimate ASM, and the developed equations have good estimating power. Hwang et al27 explored the estimating equation through 1839 community-dwelling participants aged 50 years and over, but the equation has not been validated. Due to regional and ethnic differences, the existed ASM estimating equations may not be applicable to the older people in China. There are a few scholars who have established ASM equations in China. Wen et al26 and Shi et al36 developed and validated anthropometric equations for the estimation of ASM in Chinese adults. However, no older people over 70 years old are involved in these studies. The equation developed by Wu et al24 was based on older people with knee osteoarthritis. The equations proposed by Liu,1 Chien,25 Hsiao20 et al were generalized from small sample size (140~510).
Correlation Analysis
This study found that both upper arm and calf circumferences were positively correlated with ASM. Compared with the correlation coefficient between upper arm circumference and ASM (~0.41), the one between calf circumference and ASM was larger (0.59~0.66) in our study. Although most studies have found that upper arm circumference and calf circumference are related to ASM, the strength of the correlation varies. Similar to the results we found, Kawakami et al19 found that the correlation coefficient between calf circumference and ASM was 0.76 for men, 0.80 for women, and 0.82 for the overall population involving 526 middle-aged and older Japanese people (aged 40–87 years). Santos et al17 investigated 4267 older people (aged ≥60 years) in the UK and found that the correlation coefficient between calf circumference and ASM was 0.79 for men, 0.74 for women, and that between upper arm circumference and ASM was 0.77 for men, 0.71 for women. Santana et al37 investigated 63 older people (aged ≥ 65 years) in Brazil and found that the correlation coefficient between upper arm circumference and ASM was 0.688. Bai et al38 investigated 401 older people (aged ≥ 60 years) in Shanghai and found that the correlation coefficients between calf circumference and ASM was 0.291 (P < 0.001), indicating a weak correlation. In their study, men and women showed remarkable difference. Men but not women showed significant correlation between calf circumference and appendicular skeletal muscle index (kg/m2). Previous study also found that the assessment of muscle mass using calf circumference is also influenced by sex and BMI.39 Future study may pay attention to these aspects for accurate estimation of muscle mass using calf circumference.
In this study, we also found significant correlations between ASM and both grip strength and walking speed. The correlation with grip strength (r > 0.750) is much stronger compared with the one with walking speed (0.160 < r < 0.270). Similar to our study, Liu et al1 found that the correlation coefficient between grip strength and ASM was 0.660~0.720 in a study involving 140 older Chinese people (aged 60~80 years), and Yang et al40 found that the correlation coefficient between walking speed and ASM was 0.411 in sarcopenia. The stronger correlation with ASM in grip strength than in walking speed may be related to the fact that the grip strength mainly reflects muscle strength and mass whereas walking speed may be influenced by other conditions apart from muscle strength and mass such as neurological function and physical activity habits.41
Development of ASM Estimating Equations
Based on the significant correlation between anthropometric/physical function indicators and ASM, ASM estimating equations were established in this study. Overall, all models had good fitting degrees, indicating the feasibility of calculating ASM through anthropometric and/or physical function indicators. Without the physical function indicators involved in the regression analysis, the No. 4 and 5 (Table 3) estimating equations had the same fitting degree of 91.1%, indicating that adding upper arm circumference (No. 5) had little influence on the fitting. Thereby, for simplicity, the estimating model without upper arm circumference (No. 4) could be used. When physical function indicators were included, the No. 8 and 9 estimating equations had the best and same fitting degree of 91.4%, indicating that walking speed had little effect on the model fitting and the estimating model without walking speed (No. 8) could be used. The inclusion of physical function did not significantly improve the predictive accuracy of the model and using anthropometric indicators alone can achieve good predictive performance.
Hwang et al27 developed the equation ASM using the same variables as the equation No. 4 but with different coefficients (β) [ ]. Participants in this study (63.90 ± 9.30; 50–92) were younger compared to our study (72.39 ± 5.63; 60–97) and DXA was used as gold standard, which may explain to some extent the inconsistent coefficients.
Validation of the ASM Estimating Equations
In this study, there was no statistically significant difference between the estimated ASMs and the BIA-measured ASM except for ASM deduced from the equation No. 9, which suggests a possible correlation with the lower walking speed of the development group compared to the validation group. The estimated ASMs and BIA-measured ASM were significantly correlated with r all bigger than 0.950, indicating that the regression equations established in this study had good validity.
The Bland–Altman method is a visual and convenient consistency test method that combines clinical significance, which can intuitively reflect the consistency and maximum difference between the estimated and measured values, and judge whether the maximum difference is within an acceptable range in clinical applications.42 Our results showed that the mean difference between the measured and estimated values of the four models was about 0, and most of the scatter plots in the Bland-Altman plots were distributed near the reference line of y = 0. More than 95% of the scatter plots in the Bland-Altman plots of the four models were within the 95% LoA. Overall, the consistency between the estimated ASMs and the BIA-measured ASM was good.
Limitations and Future Directions
However, several limitations exist. First, ASM was measured through BIA instead of DXA in this study. As the most authoritative muscle mass measurement method, DXA may present smaller error and is recommended in the future if available. Second, our equation was deduced from community-dwelling older adults in Suzhou, China, and further verification is needed to determine its applicability in populations of other regions or in hospitalized patients. For bedridden patients who are difficulty in measurement of height and weight, it is necessary to make adjustments and explore alternative indicators assessing muscle mass. Third, limited anthropometric and physical function indicators were chosen in this study to develop an estimation equation. Whether the involvement of other variables, such as waist circumference, will give different result is unknown. Future studies could make potential adjustments to the model for different populations or exploring additional variables for better results.
Conclusion
Anthropometric indicators can dependably estimate muscle mass in community-dwelling older adults with a recommended estimation of  . The equation achieves good predictive performance and the inclusion of physical function does not significantly improve accuracy. It may satisfy the needs of grassroots institutions and rural area where muscle mass evaluation infrastructures are not available.
The proposed model is added in the Supplementary Material.
Abbreviations
ASM, appendicular skeletal muscle mass; BIA, bioelectrical impedance analysis; DXA, dual-energy x-ray absorptiometry; ICC, intraclass correlation coefficient; BMI, body mass index; SEE, standard error of the estimate; LOA, limits of agreement; SD, standard deviation.
Data Sharing Statement
In attempt to preserve the privacy of individuals, clinical data will not be shared; the data can be available from the corresponding author on reasonable request authors upon request.
Ethics Approval and Consent to Participate
All participants were fully informed about the research purpose and characteristics before they provided signed consent. Ethical approval was granted from the Ethics Committee of Soochow University (ECSU-2019000161). This study conformed to the standards of the Declaration of Helsinki and was registered with Chinese Clinical Trial Registry (ChiCTR1900027960).
Acknowledgments
We would like to thank study participants who devoted their time and efforts.
Author Contributions
All authors made a significant contribution to the work reported, whether that is in the conception, study design, execution, acquisition of data, analysis and interpretation, or in all these areas; took part in drafting, revising or critically reviewing the article; gave final approval of the version to be published; have agreed on the journal to which the article has been submitted; and agree to be accountable for all aspects of the work.
Funding
This research was partially supported by grants from the Joint Research Project of Suzhou BenQ Medical Center and Suzhou Medical College of Soochow University (P112700322).
Disclosure
The authors report no conflicts of interest in this work.
References
1. Liu M, Zhou S, Li M, Wa L. Study of muscle mass prediction models through simple muscle strength in community-dwelling elderly. Pract Geriatr. 2021;35(02):149–154. doi:10.3969/j.issn.1003-9198.2021.02.010
2. Hirschfeld HP, Kinsella R, Duque G. Osteosarcopenia: where bone, muscle, and fat collide. Osteoporos Int. 2017;28(10):2781–2790. doi:10.1007/s00198-017-4151-8
3. Brotto M, Invernizzi M, Ireland A, Klein GL. Editorial: osteoporosis and the role of muscle. Front Endocrinol. 2022;13:951298. doi:10.3389/fendo.2022.951298
4. Kirk B, Feehan J, Lombardi G, Duque G. Muscle, bone, and fat crosstalk: the biological role of myokines, osteokines, and adipokines. Curr Osteoporos Rep. 2020;18(4):388–400. doi:10.1007/s11914-020-00599-y
5. Cruz-Jentoft AJ, Sayer AA. Sarcopenia. Lancet. 2019;393(10191):2636–2646. doi:10.1016/s0140-6736(19)31138-9
6. Cho MR, Lee S, Song SK. A review of sarcopenia pathophysiology, diagnosis, treatment and future direction. J Korean Med Sci. 2022;37(18):e146. doi:10.3346/jkms.2022.37.e146
7. Zhang Y, Zhang J, Ni W, et al. Sarcopenia in heart failure: a systematic review and meta-analysis. ESC Heart Fail. 2021;8(2):1007–1017. doi:10.1002/ehf2.13255
8. Yang J, Jiang F, Yang M, Chen Z. Sarcopenia and nervous system disorders. J Neurol. 2022;269(11):5787–5797. doi:10.1007/s00415-022-11268-8
9. Shu X, Lin T, Wang H, et al. Diagnosis, prevalence, and mortality of sarcopenia in dialysis patients: a systematic review and meta-analysis. J Cachexia, Sarcopenia Muscle. 2022;13(1):145–158. doi:10.1002/jcsm.12890
10. Fielding RA, Vellas B, Evans WJ, et al. Sarcopenia: an undiagnosed condition in older adults. Current consensus definition: prevalence, etiology, and consequences. International working group on sarcopenia. J Am Med Dir Assoc. 2011;12(4):249–256. doi:10.1016/j.jamda.2011.01.003
11. Studenski SA, Peters KW, Alley DE, et al. The FNIH sarcopenia project: rationale, study description, conference recommendations, and final estimates. J Gerontol a Biol Sci Med Sci. 2014;69(5):547–558. doi:10.1093/gerona/glu010
12. Cruz-Jentoft AJ, Bahat G, Bauer J, et al. Sarcopenia: revised European consensus on definition and diagnosis. Age Ageing. 2019;48(1):16–31. doi:10.1093/ageing/afy169
13. Chen LK, Woo J, Assantachai P, et al. Asian Working Group for Sarcopenia: 2019 consensus update on sarcopenia diagnosis and treatment. J Am Med Dir Assoc. 2020;21(3):300–307.e2. doi:10.1016/j.jamda.2019.12.012
14. Abdalla PP, da Silva LSL, Venturini ACR, et al. Anthropometric equations to estimate appendicular muscle mass from dual-energy X-ray absorptiometry (DXA): a scoping review. Arch Gerontol Geriatr. 2023;110:104972. doi:10.1016/j.archger.2023.104972
15. Massimino E, Izzo A, Riccardi G, Della Pepa G. The impact of glucose-lowering drugs on sarcopenia in type 2 diabetes: current evidence and underlying mechanisms. Cells. 2021;10(8):1958. doi:10.3390/cells10081958
16. Ebihara K, Iwanami Y, Yamasaki K, et al. Appendicular skeletal muscle mass correlates with patient-reported outcomes and physical performance in patients with idiopathic pulmonary fibrosis. Tohoku J Exp Med. 2021;253(1):61–68. doi:10.1620/tjem.253.61
17. Santos LP, Gonzalez MC, Orlandi SP, Bielemann RM, Barbosa-Silva TG, Heymsfield SB. New prediction equations to estimate appendicular skeletal muscle mass using calf circumference: results from NHANES 1999–2006. JPEN J Parenter Enteral Nutr. 2019;43(8):998–1007. doi:10.1002/jpen.1605
18. Zapata-Gómez D, Cerda-Kohler H, Burgos C, Báez EI, Ramirez-Campillo R. Validation of a novel equation to predict lower-limb muscle mass in young soccer players: a brief communication. Int J Morphol. 2020;38(3):665–669. doi:10.4067/S0717-95022020000300665
19. Kawakami R, Miyachi M, Tanisawa K, et al. Development and validation of a simple anthropometric equation to predict appendicular skeletal muscle mass. Clin Nutr. 2021;40(11):5523–5530. doi:10.1016/j.clnu.2021.09.032
20. Hsiao MY, Chang KV, Wu WT, Huang KC, Han DS. Grip strength and demographic variables estimate appendicular muscle mass better than bioelectrical impedance in Taiwanese older persons. J Am Med Dir Assoc. 2021;22(4):760–765. doi:10.1016/j.jamda.2020.08.003
21. Katano S, Honma S, Nagaoka R, et al. Anthropometric parameters-derived estimation of muscle mass predicts all-cause mortality in heart failure patients. ESC Heart Fail. 2022;9(6):4358–4365. doi:10.1002/ehf2.14121
22. Powell RM, Rolfe EDL, Day FR, et al. Development and validation of total and regional body composition prediction equations from anthropometry and single frequency segmental bioelectrical impedance with DEXA. medRxiv. 2020. doi:10.1101/2020.12.16.20248330
23. Lee G, Chang J, Hwang SS, Son JS, Park SM. Development and validation of prediction equations for the assessment of muscle or fat mass using anthropometric measurements, serum creatinine level, and lifestyle factors among Korean adults. Nutr Res Pract. 2021;15(1):95–105. doi:10.4162/nrp.2021.15.1.95
24. Wu P, Chen L, Jin J, et al. Estimation of appendicular skeletal muscle: development and validation of anthropometric prediction equations in Chinese patients with knee osteoarthritis. Australas J Ageing. 2020;39(1):e119–e126. doi:10.1111/ajag.12709
25. Chien KY, Chen CN, Chen SC, Wang HH, Zhou WS, Chen LH. A community-based approach to lean body mass and appendicular skeletal muscle mass prediction using body circumferences in community-dwelling elderly in Taiwan. Asia Pac J Clin Nutr. 2020;29(1):94–100. doi:10.6133/apjcn.202003_29(1).0013
26. Wen X, Wang M, Jiang CM, Zhang YM. Anthropometric equation for estimation of appendicular skeletal muscle mass in Chinese adults. Asia Pac J Clin Nutr. 2011;20(4):551–556.
27. Hwang AC, Liu LK, Lee WJ, Peng LN, Chen LK. Calf circumference as a screening instrument for appendicular muscle mass measurement. J Am Med Dir Assoc. 2018;19(2):182–184. doi:10.1016/j.jamda.2017.11.016
28. Joseph VR. Optimal ratio for data splitting. Statl Anal Data Min. 2022;4:15.
29. Lee DH, Keum N, Hu FB, et al. Development and validation of anthropometric prediction equations for lean body mass, fat mass and percent fat in adults using the National Health and Nutrition Examination Survey (NHANES) 1999–2006. Br J Nutr. 2017;118(10):858–866. doi:10.1017/s0007114517002665
30. Musa IR, Omar SM, Adam I. Mid-upper arm circumference as a substitute for body mass index in the assessment of nutritional status among adults in eastern Sudan. BMC Public Health. 2022;22(1):2056. doi:10.1186/s12889-022-14536-4
31. Gonzalez MC, Mehrnezhad A, Razaviarab N, Barbosa-Silva TG, Heymsfield SB. Calf circumference: cutoff values from the NHANES 1999–2006. Am J Clin Nutr. 2021;113(6):1679–1687. doi:10.1093/ajcn/nqab029
32. Roberts HC, Denison HJ, Martin HJ, et al. A review of the measurement of grip strength in clinical and epidemiological studies: towards a standardised approach. Age Ageing. 2011;40(4):423–429. doi:10.1093/ageing/afr051
33. Fess EE. American Society of Hand Therapists. J Hand Surg. 1983;8(5):625–627. doi:10.1016/S0363-5023(83)80141-5
34. Kline RB. Principles and Practice of Structural Equation Modeling.
35. Bland JM, Altman DG. Measuring agreement in method comparison studies. Stat Methods Med Res. 1999;8(2):135–160. doi:10.1177/096228029900800204
36. Shi J, He Q, Pan Y, Zhang X, Li M, Chen S. Estimation of appendicular skeletal muscle mass for women aged 60–70 years using a machine learning approach. J Am Med Dir Assoc. 2022;23(12):1985.e1–1985.e7. doi:10.1016/j.jamda.2022.09.002
37. Santana F, Farah BQ, Soares AHG, Correia M, Dias RMR. Anthropometric Parameters as Predictors of Muscle Mass in Older Women. Motricidade. 2015;11(2):107–114.
38. H BAI, J SUN, Chen M, Xie H, Xu D, Chen Y. Relationship between calf circumference and skeletal muscle mass, strength and function in the elderly. Chinese J Clin Nutr. 2018;26(5):284–287. doi:10.3760/cma.j.issn.1674-635X.2018.05.005
39. Asai C, Akao K, Adachi T, et al. Maximal calf circumference reflects calf muscle mass measured using magnetic resonance imaging. Arch Gerontol Geriatr. 2019;83:175–178. doi:10.1016/j.archger.2019.04.012
40. Yang L, Wu Y, Zhang L, et al. Sarcopenia and its related factors in elderly population in Suzhou. Chin J Osteop Bone Mineral Res. 2019;12(3):213–220. doi:10.3969/j.issn.1674-2591.2019.03.002
41. De la Cámara M, Higueras-Fresnillo S, Sadarangani KP, Esteban-Cornejo I, Martinez-Gomez D, Veiga ÓL. Clinical and ambulatory gait speed in older adults: associations with several physical, mental, and cognitive health outcomes. Phys Ther. 2020;100(4):718–727. doi:10.1093/ptj/pzz186
42. Bland JM, Altman DG. Statistical methods for assessing agreement between two methods of clinical measurement. Lancet. 1986;1(8476):307–310. doi:10.1016/S0140-6736(86)90837-8
 © 2024 The Author(s). This work is published and licensed by Dove Medical Press Limited. The full terms of this license are available at https://www.dovepress.com/terms.php and incorporate the Creative Commons Attribution - Non Commercial (unported, v3.0) License.
By accessing the work you hereby accept the Terms. Non-commercial uses of the work are permitted without any further permission from Dove Medical Press Limited, provided the work is properly attributed. For permission for commercial use of this work, please see paragraphs 4.2 and 5 of our Terms.
© 2024 The Author(s). This work is published and licensed by Dove Medical Press Limited. The full terms of this license are available at https://www.dovepress.com/terms.php and incorporate the Creative Commons Attribution - Non Commercial (unported, v3.0) License.
By accessing the work you hereby accept the Terms. Non-commercial uses of the work are permitted without any further permission from Dove Medical Press Limited, provided the work is properly attributed. For permission for commercial use of this work, please see paragraphs 4.2 and 5 of our Terms.