")
Back to Journals » Journal of Pain Research » Volume 17
Development of a Deep Learning Model for the Analysis of Dorsal Root Ganglion Chromatolysis in Rat Spinal Stenosis
Authors Li M , Zheng H , Koh JC , Choe GY, Choi EJ, Nahm FS, Lee PB
Received 10 October 2023
Accepted for publication 20 March 2024
Published 6 April 2024 Volume 2024:17 Pages 1369—1380
DOI https://doi.org/10.2147/JPR.S444055
Checked for plagiarism Yes
Review by Single anonymous peer review
Peer reviewer comments 2
Editor who approved publication: Dr Wendy Imlach
Meihui Li,1,2 Haiyan Zheng,3 Jae Chul Koh,4 Ghee Young Choe,5,6 Eun Joo Choi,1,2 Francis Sahngun Nahm,1,2 Pyung Bok Lee1,2
1Department of Anesthesiology and Pain Medicine, Seoul National University College of Medicine, Seoul, Korea; 2Department of Anesthesiology and Pain Medicine, Seoul National University Bundang Hospital, Seongnam, Korea; 3Department of Anesthesiology, The First Affiliated Hospital, Zhejiang University School of Medicine, Hangzhou, People’s Republic of China; 4Department of Anesthesiology and Pain Medicine, Korea University College of Medicine, Seoul, Korea; 5Department of Pathology, Seoul National University Bundang Hospital, Seongnam, Korea; 6Department of Pathology, Seoul National University College of Medicine, Seoul, Korea
Correspondence: Pyung Bok Lee, Email [email protected]
Objective: To create a deep learning (DL) model that can accurately detect and classify three distinct types of rat dorsal root ganglion neurons: normal, segmental chromatolysis, and central chromatolysis. The DL model has the potential to improve the efficiency and precision of neuron classification in research related to spinal injuries and diseases.
Methods: H&E slide images were divided into an internal training set (80%) and a test set (20%). The training dataset was labeled by two pathologists using pre-defined grades. Using this dataset, a two-component DL model was developed with the first component being a convolutional neural network (CNN) that was trained to detect the region of interest (ROI) and the second component being another CNN used for classification.
Results: A total of 240 lumbar dorsal root ganglion (DRG) pathology slide images from rats were analyzed. The internal testing results showed an accuracy of 93.13%, and the external dataset testing demonstrated an accuracy of 93.44%.
Conclusion: The DL model demonstrated a level of agreement comparable to that of pathologists in detecting and classifying normal and segmental chromatolysis neurons, although its agreement was slightly lower for central chromatolysis neurons. Significance: DL in improving the accuracy and efficiency of pathological analysis suggests that it may have a role in enhancing medical decision-making.
Keywords: deep learning, dorsal root ganglion, chromatolysis, automated detection and spinal stenosis
Introduction
Lumbar spinal stenosis (LSS) is a prevalent and debilitating condition that causes low back and leg pain in older individuals, with estimated 103 million people affected globally.1 Non-surgical interventions such as physical therapy, medications, and spinal injections are commonly used to treat LSS. Different categories of drugs like corticosteroids, nonsteroidal anti-inflammatory drugs (NSAIDs), opioids, anticonvulsants, and antidepressants have been used to treat LSS effectively.2 Despite the effectiveness of these medications in managing the symptoms of LSS, there are potential side effects associated with their use, such as bleeding, addiction, and neurotoxicity. Therefore, it is important to carefully weigh the risks and benefits of drug therapy for LSS on a case-by-case basis. Recently, there has gained significant attention in the use of deep learning algorithms for medical image analysis and drug testing, including the detection and diagnosis of LSS, and improving the efficiency and effectiveness of drug testing.
Chromatolysis, which refers to the loss or dispersion of Nissl bodies, is a process that occurs in neurons where the cell body undergoes structural changes due to axotomy, toxic injuries to neurons, and ischemia.3–5 Recent studies have suggested that chromatolysis may play a critical role in the pathogenesis of lumbar spinal stenosis.6,7 In the context of spinal stenosis, chromatolysis may occur in the nerve cells that are compressed or damaged due to the narrowing of the foramen. The process of chromatolysis can also lead to the degeneration of the axon, the part of the neuron that transmits signals to other cells. This can result in a loss of function of the affected nerve and contribute to the symptoms of spinal stenoses, such as pain, numbness, and weakness. Studies have shown that certain drugs, such as neuroprotective agents, can help to protect neurons from damage and reduce the severity of chromatolysis. Drug therapy tests may involve administering these medications to animal models to evaluate their effectiveness in preventing or treating chromatolysis.8 Therefore, identifying chromatolysis in the dorsal root ganglion (DRG), a cluster of nerve cell bodies located in the spinal cord can provide valuable information about the severity and progression of the disease.
To evaluate the condition of chromatolysis, there are some established criteria. However, there exist some factors which may affect judgment because of subjectiveness and differences in clinical experience. Correct and accurate diagnosis of chromatolysis is foremost. Recently, there has been an increasing trend in the development and utilization of deep learning techniques in healthcare, such as computer vision, natural language processing, reinforcement learning, and generalized methods. These methods have demonstrated a high potential for enhancing the precision and efficiency of healthcare delivery, gaining objectivity in the evaluation, and providing a more accurate diagnosis.9
To enhance the efficiency of the assessment process and alleviate the workload for researchers and pathologists, the implementation of an automated system for the detection of chromatolysis in DRG neurons is imperative. Recently, convolutional deep neural networks (CNNs) have demonstrated notable effectiveness in image recognition and classification.10 A prominent advancement in this domain is the Mask R-CNN, or Mask Region-based Convolutional Neural Network, which serves as a computer vision algorithm designed for both object detection and instance segmentation in images.11,12 This architecture extends from the Faster R-CNN (Region-based Convolutional Neural Network) framework, initially devised for object detection tasks. Key components of the Mask R-CNN include the Region Proposal Network (RPN), Backbone Network (ResNet101), Feature Pyramid Network (FPN), RoIAlign Layer, and Mask Head.
The widespread application of Mask R-CNN spans various computer vision tasks, particularly in scenarios demanding meticulous segmentation of objects, such as in medical image analysis, autonomous vehicles, and robotics.13–15 It has gained popularity as an effective architecture for tasks involving both object detection and instance segmentation in images. The integration of Mask R-CNN into the detection process for DRG neuron chromatolysis holds significant promise for automating and streamlining this critical aspect of medical analysis. However, as far as we are aware, there is currently no deep learning model designed specifically for chromatolysis neuron detection.
Therefore, the aim of our study is to develop a deep learning (DL) model capable of identifying and classifying different types of neuronal changes, including central chromatolysis and segmental chromatolysis. This study represents the first deep learning model specifically designed to elucidate DRG chromatolysis, following extensive training with extensive datasets of neuronal images. By analyzing these images, deep learning models can effectively detect intricate patterns and anomalies that may pose challenges or be impossible for humans to identify.
This deep learning model harbors the potential to markedly enhance diagnostic efficiency and treatment selection for spinal stenosis in preclinical research. It is poised to augment the efficiency and speed of DRG neuron chromatolysis pathology analysis, expediting the process of drug testing, selection, and toxin analysis. Consequently, it facilitates a more precise and effective evaluation of neuroprotective agents and other chromatolysis treatments.
Materials and Method
Animals
This study adhered to the National Research Council’s guide for laboratory animal care. Institutional Animal Care and Use Committees of Seoul National University Hospital approved the study (IACUC No. BA-2008-301-069). 23 rats were randomly divided into two groups, wild-type group and lumbar foraminal stenosis group.
Establishment of Spinal Stenosis Models
Male Sprague Dawley rats weighing 250–300 g were used in this study. The rats were acclimatized for a minimum of one week before surgery. In this study, a surgical procedure was performed to create chronic compression on the intravertebral foramen. The procedure involved making an incision on the skin located on the left side of the lumbar vertebrae, between L4 and L6, and separating the left paraspinal muscles from the mammillary and transverse process at the L4-L6 level. The L5 intravertebral foramen was then exposed, and a 3mm-long, stainless-steel rod with a diameter of 0.6mm was inserted into the foramen. The rod was inserted at a 30° angle relative to the dorsal middle line and 10° relative to the vertebral horizontal line. Upon reaching the DRG, there was a brief and slight twitch observed in the hind leg muscles on the operated side.16 For the sham group, the procedure is the same as the experimental group except for rod insertion.
Behavioral Observations
The behavioral tests, such as Von Frey and Treadmill, employed in this study are comparable to those used in our prior research.6 Briefly, the rats’ behavior was closely monitored for any signs of abnormal posture, lameness, or changes in eating habits. The assessment of motor function and sensory response to mechanical stimuli were used to evaluate the rats’ behavior, with observations made preoperatively and on postoperative days 1, 3, 7, and 14. To ensure unbiased evaluation, a single investigator blinded to the experimental procedure conducted all assessments.
Histopathologic Examination
All rats were sacrificed for microscopic examination on day 3 following the completion of behavioral observations. General anesthesia was induced using 3 L/min of oxygen and 2% sevoflurane, followed by transcranial perfusion of each rat with 200 mL of normal saline and 300–500 mL of 4% paraformaldehyde in a 0.1 M phosphate buffer solution. The vertebral columns from L4–L6, including the DRG, nerve root, and spinal nerve of L5, were then cropped en bloc and the overlying muscles were removed for microscopic examination of the degree of chromatolysis. Any inserted stainless-steel rods that were not placed in the neural foramina were excluded from the test results. The sample was post-fixed in a 10% buffered formalin solution for 48 hours and decalcified using 10% w/v ethylenediaminetetraacetic acid before being embedded in a paraffin block. Hematoxylin and eosin staining was performed on 4-μm sections, and a microscopic assessment of the tissues was conducted by two pathologists who were blinded to the test group.
Dataset Preparation
The Hematoxylin and Eosin (H&E) stained slides underwent digital scanning using a digital slide scanning service (Pannoramic 250 FLASH II, 3DHISTECH) equipped with 40x air objectives. Slides exhibiting suboptimal image quality or color ambiguity were excluded from the study. The internal dataset was randomly partitioned into training and test sets, with 83 (80%) out of the 101 slides allocated for training purposes and the remaining 18 (20%) reserved for validation. For external testing, a random selection of 139 H&E slides was utilized without further training. An external dataset comprising 87 rats’ lumbar foraminal stenosis slides sourced from PB Lee6 and 52 rats’ lumbar foraminal stenosis slides from this study were obtained for analysis. Notably, the 52 slides were derived from different rats compared to the 101 slides utilized for training and internal testing (Table 1).
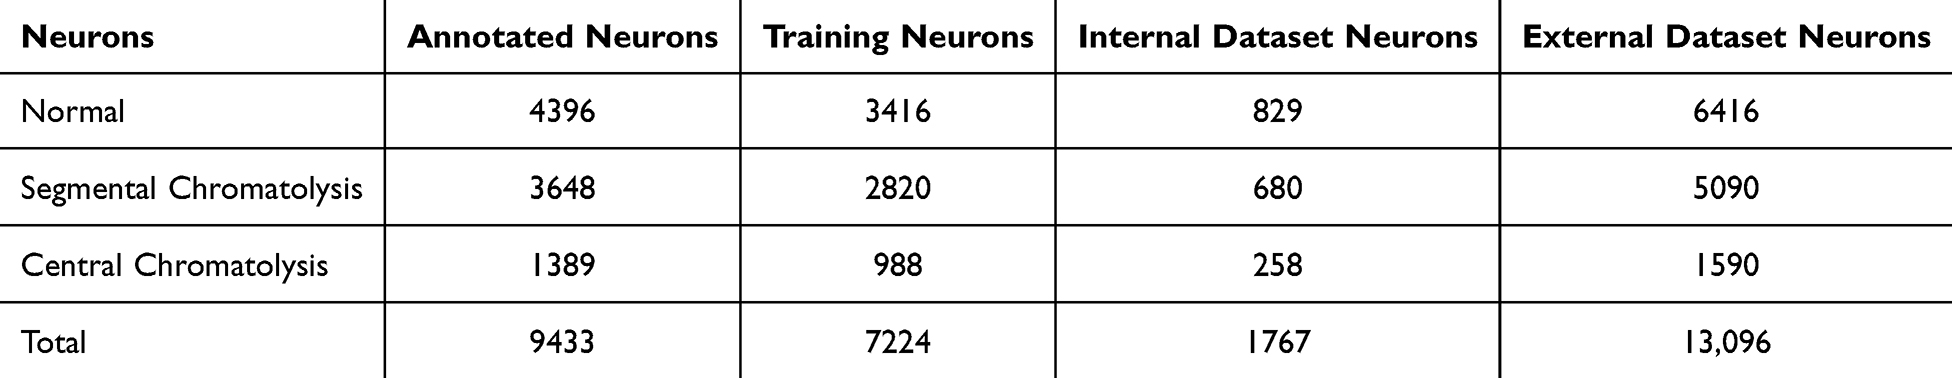 |
Table 1 Number of Neurons |
Dataset Labeling
Expert neuropathologist labeled the training data, with each labeling at least 200 H&E lumbar spine slides independently and blinded to the rats’ groups. The pathologist used open-source annotation software (https://www.robots.ox.ac.uk/) to segment the regions of interest (ROIs), which included normal, central chromatolysis, and segmental chromatolysis.17 (Figure 1) The pathologist annotated the clear neurons while excluding those with poor image quality, uncertain classification, and those located on the edges. An experienced pathologist with 35 years of expertise (GY.C.) labeled the internal test set using the same visual scale as the training data and served as the reference standard. The expert pathologist re-labeled the same test set after an 8-week interval to evaluate interobserver variability. Lastly, the pathologist labeled the external test set, serving as the reference standard.
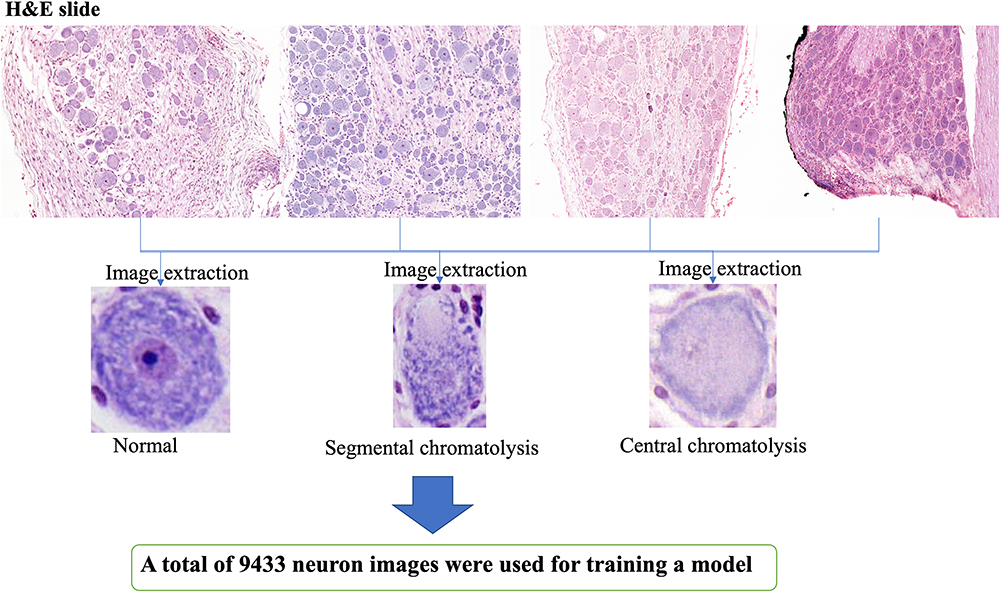 |
Figure 1 Extraction of single neuron images from rat DRG H&E slides for data labeling. These images were annotated based on the identification of three types of neurons: normal, central chromatolysis, and segmental chromatolysis. |
Evaluation Metrics
To evaluate the effectiveness of our proposed deep learning (DL) models in classifying neurons, we utilized the Confusion Matrix for Multi-Class Classification. The dataset consists of 3 neuron classes: normal, central chromatolysis, and segmental chromatolysis. Similar to binary classification, we calculate True Positive (TP), False Negative (FN), False Positive (FP), and True Negative (TN) values.18
To evaluate the performance of our DL models, we utilized four evaluation indices. We interpreted the confusion matrix using several metrics, such as accuracy, precision, recall, and F1 score. Accuracy measures the proportion of correct predictions overall. Precision measures the proportion of correct positive predictions. Recall measures the proportion of true positive predictions. The F1 score is the harmonic mean of precision and recall and provides a single score that balances both metrics.
The formulas for these performance indices are as follows:
Accuracy (ACC) = (TP + TN) / (TP + TN + FP + FN)
Precision = TP / (TP + FP)
Recall = TP / (TP + FN)
F1 Score = 2 * (Precision * Recall) / (Precision + Recall)
DL Model Development
The code for developing the deep learning (DL) model was written in Jupyter notebooks using the detectron2 library. Out of a total of 101 slides prepared for the model, 83 were allocated for training, and 18 were reserved for validation (Table 1). The prepared dataset, which annotated areas to be identified as elliptical shapes, included information about the central coordinates, major/minor axes of the ellipses, and the tilt angle. To make this data suitable for training within the library, we initially derived four points representing the movement from the ellipse’s center to its major and minor axes.
As a training model, mask_rcnn_R_50_FPN_3x of detection was used. This model generates multi-layered feature maps by utilizing the ResNet50 backbone and creates feature maps through the Feature Pyramid Network (FPN). The Mask R-CNN model extends Faster R-CNN with Fully Convolutional Network (FCN) principles,12 allowing it to perform both object detection and instance segmentation. It segments regions of interest by aligning them with the bounding box and executes instance segmentation through Mask R-CNN.
During the training phase, the batch size was set to 4 images per batch, the base learning rate was established at 0.00025, and the batch size per image for ROI_Heads was configured to 512. The number of classes for ROI heads was defined as three categories: normal, central, and segmental. The training process involved varying total iterations, ranging from 3000 to 20,000.
For added convenience, we created an executable program using Tkinter,19 Python Library Reference, release 3.8.2, Python Software Foundation,20 and the Python Imaging Library.21 When executed, this program allows users to select the necessary image and applies the pre-trained model to locate, annotate, and classify cells, which can then be saved as image files.
Statistical Analysis
The data are presented as mean ± standard deviation (SD). The paw-withdrawal threshold was evaluated within each group using repeated measures analysis of variance, and subsequently, multiple comparisons were performed with Bonferroni correction. The percentage of ganglion cells with segmental chromatolysis was analyzed using the Wilcoxon rank-sum test. A value of P < 0.05 was considered statistically significant.
Results
Assessment of Lumbar Foraminal Stenosis Model
Figure 2A illustrates the timeline of the rat experiment, with 20 rats included in the final analysis after excluding one rat with abnormal findings on the preoperative test and two rats with misplaced stainless-steel rods. The study consisted of a sham group (n=8) and a lumbar foraminal stenosis group (LFS, n=12). Prior to the surgery, there were no significant differences between the groups in the degree of mechanical threshold and running time. However, one hour after the surgery, all rats exhibited hyperalgesia. The post-surgery analysis revealed significant differences between the sham and LFS groups, as shown in Figure 2B and C. The significant differences in sensory and motor nerve disturbance between the two groups indicate the effectiveness of the LFS model.
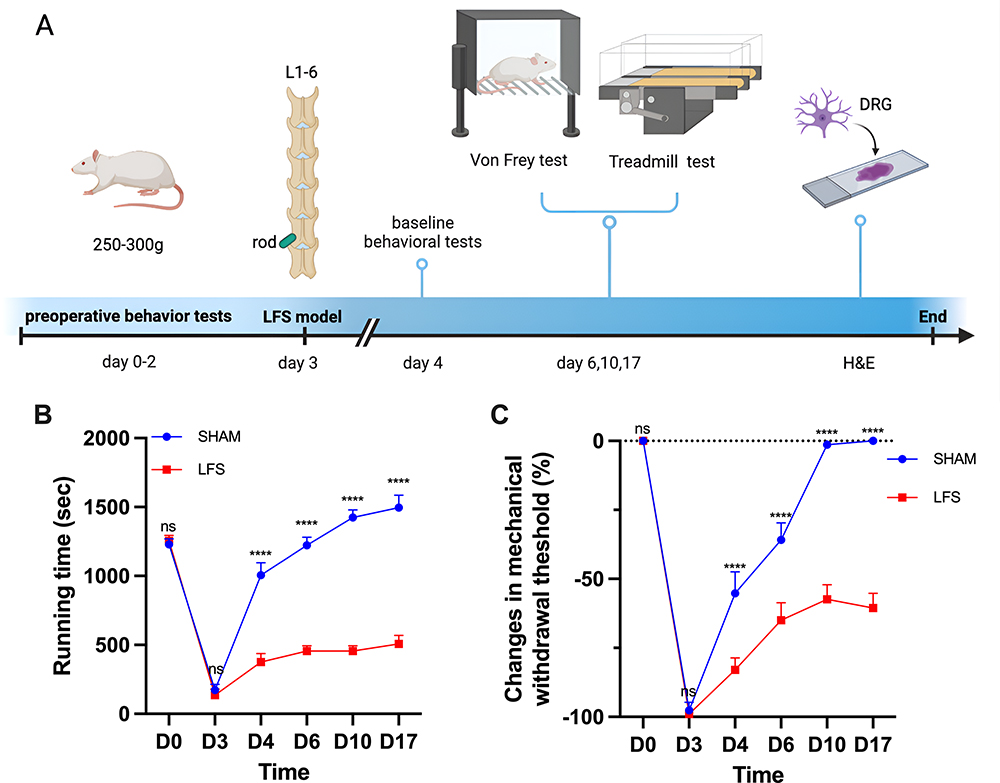 |
Figure 2 Assessment of Rat Lumbar Foraminal Stenosis model. (A): A overview of rat lumbar foraminal stenosis model. Adapted from “Behavioral Tests for Mice”, by BioRender.com (2020). Retrieved from https://app.biorender.com/biorender-templates (B) The von Frey test was used to measure paw withdrawal thresholds before and after the surgery. Results showed that the LFS group developed a transient mechanical allodynia after the surgery (**** p<0.0001 compared to the control group) as determined by a two-way repeated measures ANOVA followed by a Bonferroni post hoc test.(C) Treadmill running time was assessed before and after the surgery. The LFS group showed a significant decrease in running time after the surgery (**** p<0.0001 compared to the control group) as determined by a two-way repeated measures ANOVA followed by a Bonferroni post hoc test.The data are presented as mean ± standard deviation. “ns” indicates no statistical significance. “LFS” stands for lumbar foraminal stenosis. |
DRG Neurons Detector
In the DRG neurons detector, a graphical user interface is employed, consisting of four buttons: Browse, Original, Detect, and SaveFile (Figure 3A). The Browse button serves as the initial step for locating and selecting the target image. Upon clicking the Original button, users can view the unaltered version of the image (Figure 3B). The Detect button is utilized to identify and label the normal, segmental, and central segmental neurons present in the image. In the detection image, the system also displays the percentage likelihood of each cell type, providing a visual representation of accuracy. Subsequently, users can save the annotated image by clicking the SaveFile button. This DRG neuron detector can display pathology results within two seconds of loading the image, a significantly faster pace compared to a pathologist.
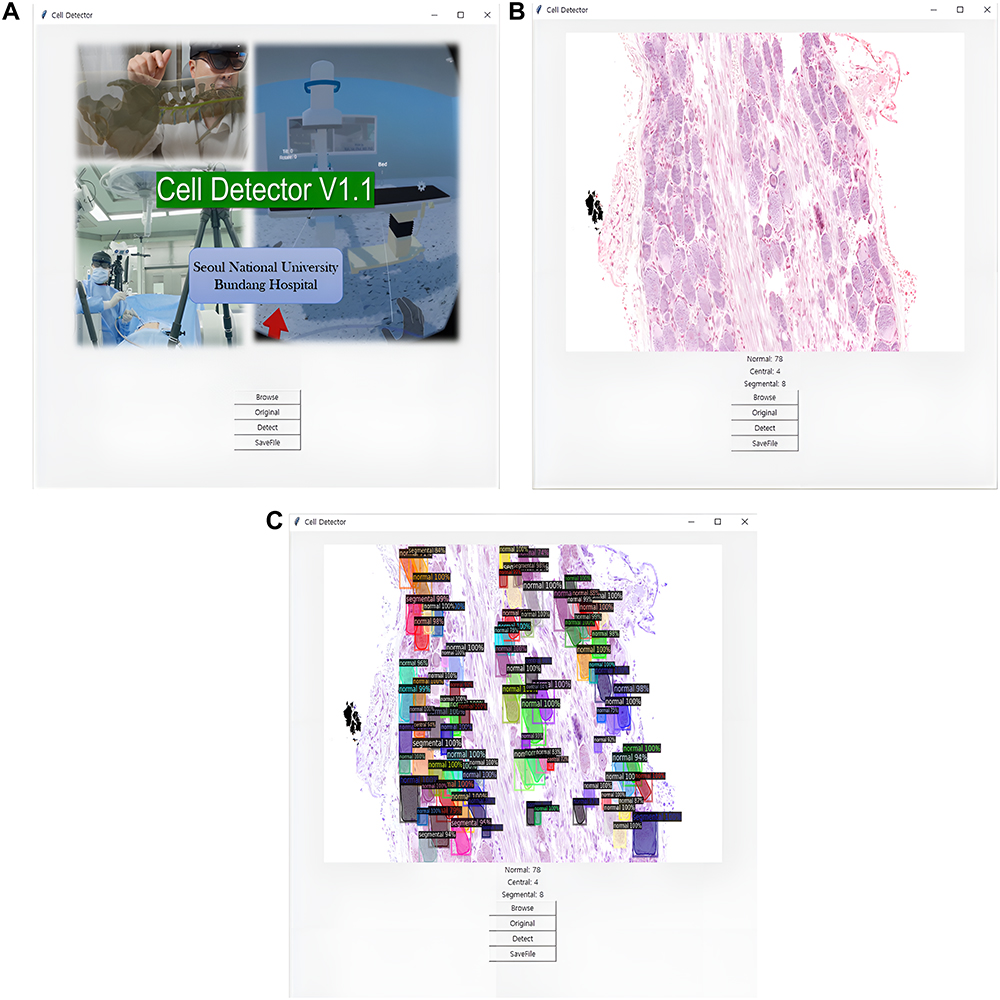 |
Figure 3 Overview of the Neuron Detector User Interface. (A) The Neuron Detector user interface offers several essential functions as described below:Browse: This button enables users to locate and select the target image. Original: This button enables users to view the unaltered version of the selected image. Detect: the detector identifies and labels the various types of neurons found in the image, including normal, segmental, and central segmental neurons. SaveFile: This button enables users to save the annotated image for further analysis or documentation. (B) The Neuron Detector displays the original image along with the number of annotated neurons detected in the image. (C) In Detect interface, users are presented with essential information regarding the annotated neurons. This includes the number of neurons that have been successfully annotated, the percentage of classification probabilities associated with each neuron, and the labels assigned to the identified neurons. |
The DRG detector demonstrates a commendable level of accuracy in annotating a substantial portion of DRG neurons, surpassing a remarkable coverage rate of 92%. Nevertheless, it should be acknowledged that certain neurons may elude identification due to factors such as their diminutive size or incomplete shape and unclear color characteristics. Such challenges in detection can hamper the comprehensive annotation of all neurons within the image. For a more comprehensive understanding of the classification probabilities assigned to individual neurons, users can examine the slide images accessible through the detector. Furthermore, the detector provides information regarding the number of neurons annotated, enabling users to quantify the extent of annotation accomplished by the DRG detector (Figure 3C).
Classification of Internal Test Set ROI for DRG Neurons
To evaluate the robustness of the deep learning (DL) model classifier, an extensive epoch ranges from 3000 to 20,000 was implemented. It is noteworthy that an upward trajectory in performance was consistently observed as the epoch number increased within this range (Figure 4). And the achieved accuracy level over 0.90 at epoch 20,000. Then, the trained deep learning model at epoch 20,000 was employed to thoroughly evaluate both internal and external datasets. This meticulous assessment aimed to ensure the reliability and generalizability of the model, contributing to rigorous verification.
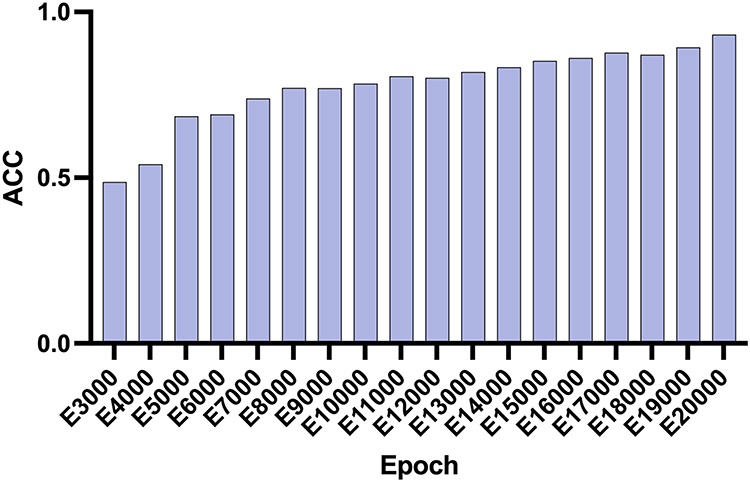 |
Figure 4 Accuracy of the DL model. The graph illustrates the accuracy achieved by the trained model over a range of epochs, from 3000 to 20,000. ACC: accuracy. |
In the internal dataset, the DL model demonstrated a commendable level of agreement with both the reference standard and the pathologist. The model achieved an accuracy rate of 93.13%. Notably, the precision, recall, and F1 score metrics were calculated for each DRG neuron type, resulting in the following values: normal DRG neurons - precision: 91.92%, recall: 95.58%, F1 score: 93.71%; segmental chromatolysis neurons - precision: 95.04%, recall: 92.02%, F1 score: 93.51%; and central chromatolysis neurons - precision: 92.19%, recall: 90.13%, F1 score: 91.15% (Table 2).
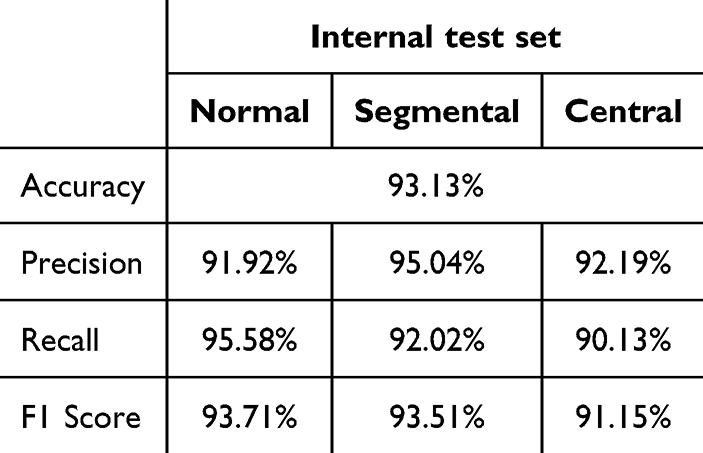 |
Table 2 Internal Test Set Classifications Using Evaluation Metrics |
Classification of External Test Set ROI for DRG Neurons
To the external dataset, a high level of agreement was observed between the DL model and the pathologist, further aligning with the reference standard. The model achieved an accuracy rate of 93.44%. Precision, recall, and F1 score values were computed for each DRG neuron type, yielding the following outcomes: normal DRG neurons - precision: 91.99%, recall: 96.00%, F1 score: 93.95%; segmental chromatolysis neurons - precision: 96.03%, recall: 91.98%, F1 score: 93.96%; and central chromatolysis neurons - precision: 91.60%, recall: 87.80%, F1 score: 89.66% (Table 3).
 |
Table 3 External Test Set Classifications Using Evaluation Metrics |
Discussion and Conclusion
Lumbar foraminal stenosis is a prevalent spinal disorder characterized by the narrowing of the intervertebral foramen, leading to compression of the spinal nerves. This compression and irritation of the nerve roots manifest as symptoms such as pain, numbness, and weakness in the lower back, buttocks, and legs. The prevalence of lumbar foraminal stenosis generally exhibits an age-related increase, underscoring the significance of accurate and timely detection for effective diagnosis, treatment planning and new drug development. In recent times, deep learning, which is a subfield of machine learning, has emerged as a promising tool for medical imaging analysis. Its potential has been demonstrated in the evaluation, detection, and characterization of different aspects of lumbar foraminal stenosis, such as Neural Foraminal Stenosis, Lateral Recess conditions, and Central Canal abnormalities, as observed in Lumbar Spine MRI scans.22–24 The utilization of deep learning algorithms has led to noteworthy progress in enhancing the efficiency of medical image analysis and improving overall productivity.
Deep learning has emerged as a popular methodology for biomedical cell detection, with notable applications in biomedical image data analysis, such as cell detection and shape measurements using U-Net,25 and application in bone marrow cell detection and classification.26 Moreover, deep learning techniques have been explored in the field of neuroscience, including neuron image segmentation,27 neural stem cell differentiation,28 and neuronal soma detection.29 However, it is important to note that there is currently a lack of research specifically focusing on biomedical cell detection in the context of lumbar foraminal stenosis.
There have been limited studies presenting a practical artificial intelligence detection model for clinical and preclinical use. This study aimed to address challenges encountered in implementing artificial intelligence research in medical care. Previous studies based on convolutional neural networks required resizing images to a specific resolution for model classification.28,29 This process was not only cumbersome but also compromised the quality and accuracy of image analysis. However, this study successfully employed FPN, allowing convenient analysis of images with varying resolutions without the need for conversion, thereby ensuring accurate analysis.
Previous studies focused on either image classification or object detection models, which posed challenges in verifying artificial intelligence inferences. For instance, a model solely capable of image classification could only determine the presence of abnormal cells in a given image.27 In contrast, our detection model could identify regions containing both normal and abnormal cells and quantify their numbers. However, the object detection model alone could not differentiate the specific cell to be analyzed within each bounding box.26 This limitation meant that the bounding box might include regions other than the target cell, resulting in inaccurate analysis. By utilizing the mask R-CNN in this study, instance segmentation was achieved, enabling accurate identification and delineation of each target cell. Consequently, the correctness of inferences could be more easily and precisely verified.
Another notable advantage of the AI model developed in this study was its convenience. In previous studies, importing images into the AI model required coding within the program development environment, leading to inconvenience.30 Conversely, this study created an executable program in the widely used Windows environment, allowing simple application of images to the generated artificial intelligence model. In preclinical settings, this executable program can facilitate faster and broader application of the model.
Prior to this study, there was a lack of investigation into the utilization of deep learning for the detection of neuron chromatolysis. This highlights an opportunity for further exploration and investigation in this area. Future studies investigating the application of deep learning techniques for biomedical cell detection in lumbar foraminal stenosis could contribute to the development of more precise preclinical diagnostic methods and facilitate the optimization of treatment strategies. This study demonstrates the feasibility of employing deep learning for the evaluation of chromatolysis. The deep learning model achieved an impressive overall accuracy of 95.6% for detecting normal neurons, along with accuracies of 92.0% and 90.1% for classifying central and segmental chromatolysis, respectively. These outcomes indicate that the model has the potential to accurately identify the presence and specific type of chromatolysis in rat foraminal stenosis. The study also conducted a comparison between the performance of the deep learning model and that of human experts who manually annotated chromatolysis in the images. The deep learning model exhibited comparable accuracy to the human experts while demonstrating faster processing times, suggesting that it could serve as a valuable tool for automating the detection and classification of chromatolysis in rat foraminal stenosis.
Chromatolysis represents a neuronal response to various insults or injuries, such as axotomy, toxic injuries, or ischemia. While chromatolysis is not specific to any neurodegenerative condition, it may be associated with neuronal stress or damage observed in diseases like amyotrophic lateral sclerosis, axonal injury, pellagra, and Alzheimer’s disease.31–33 Additionally, chromatolysis has been identified in other diseases, including lumbar foraminal stenosis, neurogenic intermittent claudication, and sciatic nerve injury, as revealed in previous studies.7,34–36
Considering the inherent challenges in conducting human experiments related to neurodegenerative diseases, animal models serve as practical substitutes. In this context, animal pathology examination assumes a pivotal role in the experimental process, underscoring the imperative for efficient and expeditious pathology examination results. The deep learning model under consideration is meticulously crafted to detect chromatolysis specifically in rat spinal dorsal root ganglion neurons. We intend to extend the applicability of this model by assessing its effectiveness in detecting chromatolysis in neurons beyond the rat spinal dorsal root ganglion, potentially in other neuron types or species in the future.
The deep learning model developed for dorsal root ganglion (DRG) neurons has yielded significant findings with broad implications for understanding neural changes. Key outcomes of this model include its ability to accurately classify neurons based on various morphological features, aiding in the identification and characterization of different types of DRG neuron chromatolysis. Furthermore, the model’s capacity to detect chromatolysis provides valuable insights into pathological processes associated with conditions like spinal stenosis and neurodegenerative diseases. By elucidating these neural changes at a microscopic level, the model contributes to the development of targeted therapeutic interventions in animal experiments aimed at providing treatment and for future human therapy. Overall, the findings of this deep learning model improve research efficiency and offer promising avenues for further research into neurological disorders affecting the peripheral nervous system.
However, certain limitations should be acknowledged. The dataset utilized in this study was relatively small, and it remains uncertain how the deep learning model would perform on larger datasets or different image types. Furthermore, the study did not explore the use of the deep learning model for histologic grade evaluation of chromatolysis in the dorsal root ganglia (DRG), which presents a potential avenue for future research. The deep learning model did exhibit errors in detecting and classifying chromatolysis, potentially attributable to factors such as image quality or the inherent shape diversity of neurons. The H&E stained slides used in our study were scanned with 40x air objectives, although we also tested slides scanned with 20x objectives. However, the model exhibited lower accuracy with the 20x objective slides compared to the 40x objectives. This indicates that there is still room for improvement in the model’s performance. Furthermore, it’s worth noting that this model currently lacks a size threshold, which can sometimes result in difficulty clarifying very small neurons. In future iterations, implementing a size threshold will be essential to enhance the accuracy and reliability of the model.
In conclusion, this study showcases the potential of employing deep learning for automated detection and classification of chromatolysis in rat foraminal stenosis. Future investigations could focus on utilizing larger datasets, diverse image types, and additional disease outcomes to further refine and validate the deep learning model. Additionally, efforts could be directed toward enhancing the interpretability of the model, thereby increasing its utility in other chromatolysis disease contexts.
Acknowledgments
Meihui Li is a recipent of the China Scholarship Council scholarship (CSC number: 202208260090).
Funding
This work was supported by a research grant from Seoul National University Bundang Hospital (14-2021-0012).
Disclosure
The authors report no conflicts of interest in this work.
References
1. Katz JN, Zimmerman ZE, Mass H, Makhni MC. Diagnosis and management of lumbar spinal stenosis: a review. JAMA. 2022;327(17):1688–1699. doi:10.1001/jama.2022.5921.
2. Lurie J, Tomkins-Lane C. Management of lumbar spinal stenosis. BMJ. 2016;352:h6234. doi:10.1136/bmj.h6234 PMID: 26727925; PubMed Central PMCID: PMCPMC6887476.
3. Cammermeyer J. PERIPHERAL CHROMATOLYSIS AFTER TRANSECTION OF MOUSE FACIAL NERVE. Acta Neuropathol. 1963;2:213–230. doi:10.1007/bf00686415 PubMed PMID: 14190987.
4. Leech RW. Changes in satellite cells of rat dorsal root ganglia during central chromatolysis. an electron microscopic study. Neurology. 1967;17(4):349. doi:10.1212/wnl.17.4.349 PubMed PMID: 6067070.
5. Levine S, Saltzman A, Kumar AR. A method for peripheral chromatolysis in neurons of trigeminal and dorsal root ganglia, produced in rats by lithium. J Neurosci Methods. 2004;132(1):1–7. doi:10.1016/j.jneumeth.2003.07.001 PubMed PMID: 14687669.
6. Lee HJ, Ju J, Choi E, Nahm FS, Choe GY, Lee PB. Effect of epidural polydeoxyribonucleotide in a rat model of lumbar foraminal stenosis. Korean J Pain. 2021;34(4):394–404. doi:10.3344/kjp.2021.34.4.394 PubMed PMID: 34593657; PubMed Central PMCID: PMCPMC8494961.
7. Nahm FS, Lee PB, Choe GY, Lim YJ, Kim YC. Therapeutic effect of epidural hyaluronic acid in a rat model of foraminal stenosis. J Pain Res. 2017;10:241–248. doi:10.2147/jpr.S122861 PubMed PMID: 28182130; PubMed Central PMCID: PMCPMC5279814.
8. Choi E, Im SM, Yoo HS, et al. The neurological safety of an epidurally administered lipo-PGE1 agonist in rats. Reg Anesth Pain Med. 2017;42(1):75–81. doi:10.1097/aap.0000000000000520 PubMed PMID: 27922949.
9. Esteva A, Robicquet A, Ramsundar B, et al. A guide to deep learning in healthcare. Nat Med. 2019;25(1):24–29. doi:10.1038/s41591-018-0316-z PubMed PMID: 30617335.
10. Haenssle HA, Fink C, Schneiderbauer R, et al. Man against machine: diagnostic performance of a deep learning convolutional neural network for dermoscopic melanoma recognition in comparison to 58 dermatologists. Ann Oncol. 2018;29(8):1836–1842. doi:10.1093/annonc/mdy166 PubMed PMID: 29846502.
11. Gupta P, Sharma V, Varma S. A novel algorithm for mask detection and recognizing actions of human. Expert Syst Appl. 2022;198:116823. doi:10.1016/j.eswa.2022.116823
12. He K, Gkioxari G, Dollar P, Girshick R. Mask R-CNN. IEEE Trans Pattern Anal Mach Intell. 2020;42(2):386–397. doi:10.1109/TPAMI.2018.2844175 PubMed PMID: 29994331.
13. Hsieh KY, Chen HY, Kim SC, Tsai YJ, Chiu HY, Chen GY. A mask R-CNN based automatic assessment system for nail psoriasis severity. Comput Biol Med. 2022;143:105300. doi:10.1016/j.compbiomed.2022.105300 PubMed PMID: 35172223.
14. Zhang Q, Sun Z, Shu H. Research on vehicle lane change warning method based on deep learning image processing. Sensors. 2022;22(9). PubMed PMID: 35591016; PubMed Central PMCID: PMCPMC9100057. doi:10.3390/s22093326
15. Pan S, Ahamed T. Pear recognition in an orchard from 3d stereo camera datasets to develop a fruit picking mechanism using mask R-CNN. Sensors. 2022;22(11):4187. doi:10.3390/s22114187 PubMed PMID: 35684807; PubMed Central PMCID: PMCPMC9185418.
16. Hu SJ, Xing JL. An experimental model for chronic compression of dorsal root ganglion produced by intervertebral foramen stenosis in the rat. Pain. 1998;77(1):15–23. doi:10.1016/s0304-3959(98)00067-0 PubMed PMID: 9755014.
17. Dutta A, Zisserman A The VIA annotation software for images, audio and video.
18. Markoulidakis I, Rallis I, Georgoulas I, Kopsiaftis G, Doulamis A, Doulamis N. Multiclass confusion matrix reduction method and its application on net promoter score classification problem. Technologies. 2021;9(4):81. doi:10.3390/technologies9040081
19. Lundh F. An introduction to tkinter. 1999.
20. Van Rossum G The python library reference, release 3.8.2: Python Software Foundation.; 2020. Available from: https://www.python.org/downloads/release/python-382/.
21. P U. Image processing in python. CSI Communications; 2012Available from: https://pypi.org/project/Pillow/.
22. Hallinan J, Zhu L, Yang K, et al. Deep learning model for automated detection and classification of central canal, lateral recess, and neural foraminal stenosis at lumbar spine MRI. Radiology. 2021;300(1):130–138. doi:10.1148/radiol.2021204289 PubMed PMID: 33973835.
23. Lim DSW, Makmur A, Zhu L, et al. Improved productivity using deep learning-assisted reporting for lumbar spine MRI. Radiology. 2022;305(1):160–166. doi:10.1148/radiol.220076 PubMed PMID: 35699577.
24. Sun S, Tan ET, Mintz DN, et al. Evaluation of deep learning reconstructed high-resolution 3D lumbar spine MRI. Eur Radiol. 2022;32(9):6167–6177. doi:10.1007/s00330-022-08708-4 PubMed PMID: 35322280.
25. Falk T, Mai D, Bensch R, et al. U-Net: deep learning for cell counting, detection, and morphometry. Nat Methods. 2019;16(1):67–70. doi:10.1038/s41592-018-0261-2 PubMed PMID: 30559429.
26. Wang CW, Huang SC, Lee YC, Shen YJ, Meng SI, Gaol JL. Deep learning for bone marrow cell detection and classification on whole-slide images. Med Image Anal. 2022;75:102270. doi:10.1016/j.media.2021.102270 PubMed PMID: 34710655.
27. Yang B, Chen W, Luo H, Tan Y, Liu M, Wang Y. Neuron image segmentation via learning deep features and enhancing weak neuronal structures. IEEE J Biomed Health Inform. 2021;25(5):1634–1645. doi:10.1109/JBHI.2020.3017540 PubMed PMID: 32809948.
28. Zhu Y, Huang R, Wu Z, Song S, Cheng L, Zhu R. Deep learning-based predictive identification of neural stem cell differentiation. Nat Commun. 2021;12(1):2614. doi:10.1038/s41467-021-22758-0 PubMed PMID: 33972525; PubMed Central PMCID: PMCPMC8110743.
29. Li Q, Zhang Y, Liang H, et al. Deep learning based neuronal soma detection and counting for Alzheimer’s disease analysis. Comput Meth Prog Biomed. 2021;203:106023. PubMed PMID: 33744751. doi:10.1016/j.cmpb.2021.106023
30. Yoo SY, Park HE, Kim JH, et al. Whole-Slide image analysis reveals quantitative landscape of tumor-immune microenvironment in colorectal cancers. Clin Cancer Res. 2020;26(4):870–881. doi:10.1158/1078-0432.Ccr-19-1159 PubMed PMID: 31757879.
31. Riancho J, Ruiz-Soto M, Villagrá NT, Berciano J, Berciano MT, Lafarga M. Compensatory motor neuron response to chromatolysis in the murine hSOD1(G93A) model of amyotrophic lateral sclerosis. Front Cell Neurosci. 2014;8:346. doi:10.3389/fncel.2014.00346 PubMed PMID: 25374511; PubMed Central PMCID: PMCPMC4206191.
32. Torres L, Noel RJ Jr. Astrocytic expression of HIV-1 viral protein R in the hippocampus causes chromatolysis, synaptic loss and memory impairment. J Neuroinflammation. 2014;11:53. doi:10.1186/1742-2094-11-53 PubMed PMID: 24655810; PubMed Central PMCID: PMCPMC3994341.
33. Fu L, Doreswamy V, Prakash R. The biochemical pathways of central nervous system neural degeneration in niacin deficiency. Neural Regen Res. 2014;9(16):1509–1513. doi:10.4103/1673-5374.139475 PubMed PMID: 25317166; PubMed Central PMCID: PMCPMC4192966.
34. Prabhala T, Hellman A, Walling I, et al. External focused ultrasound treatment for neuropathic pain induced by common peroneal nerve injury. Neurosci Lett. 2018;684:145–151. PubMed PMID: 30056105. doi:10.1016/j.neulet.2018.07.037
35. Delibaş B, Kaplan S. The histomorphological and stereological assessment of rat dorsal root ganglion tissues after various types of sciatic nerve injury. Histochem Cell Biol. 2024;161(2):145–163. doi:10.1007/s00418-023-02242-0 PubMed PMID: 37855874.
36. Ando T, Watanabe H, Riku Y, et al. Neurogenic intermittent claudication caused by vasculitis in the cauda equina: an autopsy case report. Eur Spine J. 2023;32(7):2602–2606. doi:10.1007/s00586-022-07458-7 PubMed PMID: 36416968.
 © 2024 The Author(s). This work is published and licensed by Dove Medical Press Limited. The full terms of this license are available at https://www.dovepress.com/terms.php and incorporate the Creative Commons Attribution - Non Commercial (unported, v3.0) License.
By accessing the work you hereby accept the Terms. Non-commercial uses of the work are permitted without any further permission from Dove Medical Press Limited, provided the work is properly attributed. For permission for commercial use of this work, please see paragraphs 4.2 and 5 of our Terms.
© 2024 The Author(s). This work is published and licensed by Dove Medical Press Limited. The full terms of this license are available at https://www.dovepress.com/terms.php and incorporate the Creative Commons Attribution - Non Commercial (unported, v3.0) License.
By accessing the work you hereby accept the Terms. Non-commercial uses of the work are permitted without any further permission from Dove Medical Press Limited, provided the work is properly attributed. For permission for commercial use of this work, please see paragraphs 4.2 and 5 of our Terms.