")
Back to Journals » Clinical Interventions in Aging » Volume 19
Do LUTS Predict Mortality? An Analysis Using Random Forest Algorithms
Authors Åkerla J , Nevalainen J , Pesonen JS, Pöyhönen A, Koskimäki J, Häkkinen J , Tammela TL, Auvinen A
Received 25 July 2023
Accepted for publication 17 January 2024
Published 12 February 2024 Volume 2024:19 Pages 237—245
DOI https://doi.org/10.2147/CIA.S432368
Checked for plagiarism Yes
Review by Single anonymous peer review
Peer reviewer comments 2
Editor who approved publication: Dr Maddalena Illario
Jonne Åkerla,1,2 Jaakko Nevalainen,3 Jori S Pesonen,4 Antti Pöyhönen,5 Juha Koskimäki,1 Jukka Häkkinen,6 Teuvo LJ Tammela,1,2 Anssi Auvinen3
1Department of Urology, Tampere University Hospital, Tampere, Finland; 2Faculty of Medicine and Health Technology, Tampere University, Tampere, Finland; 3Faculty of Social Sciences, Tampere University, Tampere, Finland; 4Department of Surgery, Päijät-Häme Central Hospital, Lahti, Finland; 5Centre for Military Medicine, The Finnish Defence Forces, Riihimäki, Finland; 6Department of Urology, Länsi-Pohja healthcare District, Kemi, Finland
Correspondence: Jonne Åkerla, Department of Urology, Tampere University Hospital, Teiskontie 35, Tampere, 33521, Finland, Tel +358 311 611, Fax +358 311 64256, Email [email protected]
Purpose: To evaluate a random forest (RF) algorithm of lower urinary tract symptoms (LUTS) as a predictor of all-cause mortality in a population-based cohort.
Materials and Methods: A population-based cohort of 3143 men born in 1924, 1934, and 1944 was evaluated using a mailed questionnaire including the Danish Prostatic Symptom Score (DAN-PSS-1) to assess LUTS as well as questions on medical conditions and behavioral and sociodemographic factors. Surveys were repeated in 1994, 1999, 2004, 2009 and 2015. The cohort was followed-up for vital status until the end of 2018. RF uses an ensemble of classification trees for prediction with a good flexibility and without overfitting. RF algorithms were developed to predict the five-year mortality using LUTS, demographic, medical, and behavioral factors alone and in combinations.
Results: A total of 2663 men were included in the study, of whom 917 (34%) died during follow-up (median follow-up time 15.0 years). The LUTS-based RF algorithm showed an area under the curve (AUC) 0.60 (95% CI 0.52– 0.69) for five-year mortality. An expanded RF algorithm, including LUTS, medical history, and behavioral and sociodemographic factors, yielded an AUC 0.73 (0.65– 0.81), while an algorithm excluding LUTS yielded an AUC 0.71 (0.62– 0.78).
Conclusion: An exploratory RF algorithm using LUTS can predict all-cause mortality with acceptable discrimination at the group level. In clinical practice, it is unlikely that LUTS will improve the accuracy to predict death if the patient’s background is well known.
Keywords: lower urinary tract symptoms, mortality, machine learning, cohort studies
Introduction
Lower urinary tract symptoms (LUTS) are common and the prevalence of LUTS increases with age.1 The etiology of LUTS is multifactorial, as symptoms can be due to bladder outlet obstruction, detrusor overactivity or underactivity, or prostatic inflammation, but also non-urological conditions including cardiovascular diseases, metabolic syndrome, and neurological symptoms.2,3
Considering that LUTS can be associated with multiple comorbidities, the association of LUTS with premature death has been a topic of considerable research efforts. However, the association of LUTS with aging and several comorbidities makes it difficult to determine the value of LUTS as a prognostic factor for premature death. Nevertheless, there is growing evidence that LUTS are a potential indicator and risk factor for mortality but most of the previous studies have focused exclusively on nocturia.4–6 However, some studies have shown that urgency, increased daytime urinary frequency and any urinary incontinence increase the risk of death but the evidence is sparse and somewhat controversial.5,7,8 Prediction models for general population have been developed but not adopted for common use unlike those for specific medical conditions (eg coronary heart disease, breast cancer, and cardiovascular disease) which are included in clinical guidelines to guide management.9–13
The aim of the current study is to evaluate the usefulness of LUTS as a prognostic marker for mortality on its own as well as in combination with demographic, medical, and behavioral factors. We approach this aim by a random forest (RF) algorithm to identify the complex prediction patterns among multiple variables in a population-based cohort of middle-aged and elderly Finnish men. Machine learning (ML) techniques, including RF, have been shown to improve the accuracy of premature all-cause mortality prediction compared to standard methods.9 Therefore, it is important to evaluate their usability in common study designs, such as cohort studies.
Materials and Methods
Study Population
This report is part of the population-based Tampere Ageing Male Urologic Study (TAMUS) focusing on urological symptoms and sexual functioning among middle-aged and elderly men consisting of 50-, 60-, and 70-year-old men at the beginning of the study. The study was launched in Pirkanmaa County, Finland, in 1994 with repeated rounds in 1999, 2004, 2009, and 2015. Self-administered questionnaires were mailed with an informed consent form to the study cohort at all rounds. The study details have been published previously.14,15 The study protocol was reviewed by the ethics committee of the Pirkanmaa Hospital District (tracking number 99050) and was conducted in accordance with the Declaration of Helsinki.
Data Collection and Variables
The Danish Prostatic Symptom Score (DAN-PSS-1) was used to evaluate LUTS.16 An exception was made in the 1994 assessment, which lacked the questions concerning slow stream and straining. Consequently, questions concerning slow stream and straining in the subsequent rounds were dropped from the current analysis, leaving ten of twelve items of the DAN-PSS-1. Each item contains two elements as parts A and B cover symptom severity and symptom-related bother, respectively. Every man providing answers to at least eight of the ten items of the DAN-PSS-1 in part A in at least one questionnaire round was included in the study.
The variables derived from the questionnaire were grouped into four categories for the current study: LUTS (hesitancy, feeling of incomplete emptying, post-micturition dribble, daytime frequency, nocturia, urgency, urgency incontinence, dysuria, stress incontinence, mixed incontinence, and total DAN-PSS-1 score), medical (diabetes, cardiac disease, hypertension, cerebrovascular disease, and cancer), behavioral (body mass index (BMI) and smoking), and sociodemographic (age, education, marital status, and occupation status) factors. Age was calculated when the questionnaire was completed. In addition, we computed total DAN-PSS-1 score by taking the product of A and B and summing up the products for all items.
Information on the date and cause of deaths were obtained through Statistics Finland until the end of 2018.
Statistical Analyses
The study period was divided into five-year time windows following each questionnaire round. The main outcome variable was death from any cause (yes/no) during that period. Thus, each man had a minimum of one observation of the questionnaire and outcome and a maximum of five observations if they survived the entire study period and participated in each round.
In medical research, ML is used in the field of diagnostics and prognosis with promising results.17–23 Therefore, we chose to use one of the ML methods, the RF, to evaluate the usefulness of LUTS in predicting mortality. The RF algorithm has the advantage over standard statistical methods in that no particular structure for the predictive model has to be assumed or pre-specified (eg proportionality assumption, linearities, or interactions). Instead, the RF algorithm uses an ensemble of classification trees for the prediction.24 In a single tree, the dataset is split into two groups using a threshold value of a variable. The threshold is chosen such that homogeneity within the groups is maximized. After the first split, the process is applied to each group recursively until the groups reach a minimum size or until no improvement can be made. Each tree is constructed using a random subset of individuals and variables. The final predictions are based on a large number of developed trees.
We trained nine different RF algorithms to determine LUTS usefulness in mortality prediction using RF. First, RF algorithms using each category (LUTS, medical, sociodemographic, and behavioral factors) alone were fitted. Second, RF algorithms using information of LUTS combined with one of the other categories one at a time were created. Finally, RF algorithms using other variables than LUTS and LUTS combined with other variables were trained. Additionally, RF algorithms predicting death due to cardiovascular deaths, cancer deaths, pulmonary disease deaths and deaths caused by falling were developed. For this purpose, three different RF algorithms were developed: on LUTS alone, on other variable categories than LUTS, and LUTS combined with other categories.
The RF was initially designed for independent observations. Recent extensions to dependent data have coupled the RF with an appropriate generalized mixed model.25–27 We implemented another approach to avoid any modelling assumptions and to develop an RF algorithm that makes use of all data in its training but does not require longitudinal input data for prediction. To meet this purpose, we used a specific resampling variant of the RF algorithm. First, we sampled 90% of men to the training set of the RF algorithm. Second, we fitted the algorithm to that set of data so that for each tree, one observation per man was used (ie stratified sampling from each man), in which the last observation prior to death was sampled with a probability of 0.5, if present, and one of the other observations also with 0.5 probability. Thus, the observations used for the construction of a single tree were independent, and observations preceding death were sampled more frequently than those preceding “no death” to reduce imbalance between outcomes. Five hundred trees were grown in this manner and thus, all the observations for a man in the training set were (in practice) used multiple times in the development of the forest. Third, we assessed the performance of the RF on an independent test set consisting of 10% of the men and one randomly chosen observation per man. Performance was assessed using sensitivity, specificity, and area under the curve (AUC) on the test dataset. Finally, we conducted resampling and RF fitting steps (1–3) with 90–10% splits of men 200 times to ensure that the vast majority of the men were part of the test set at least once. The estimated performance measures were aggregated over the resamples. We used 20% as the threshold probability of death in the calculation of the sensitivity and specificity. The quantiles of the resampled AUCs were used to estimate the confidence intervals. The RF algorithm was implemented in R with the randomForest package.
After every resampled training and test sample, missing data were imputed with the rfImpute algorithm, which used proximity in the RF to impute missing values.28 To reduce the known possibility of a slight overestimation of the algorithm prediction performance, we implemented these independently to the training and test samples, as well as repeatedly at every resampling step, resulting in a distribution of imputed values for a missing value rather than a single value.
Results
A total of 2067 questionnaires (66% of those mailed) were returned in 1994, 2133 (75%) in 1999, 1905 (76%) in 2004, 1424 (66%) in 2009 and 1146 (66%) in 2015. A flow chart of population formation for the current study is shown in Figure 1. Among the total eligible 2663 men (85% of those mailed), 690 (26%) provided data in all five questionnaire rounds, 525 (20%) in four, 461 (17%) in three, 470 (18%) in two, and 517 (19%) in one round. Demographic and medical information based on the questionnaires is summarized in Supplementary Table 1. The median follow-up time was 15.0 years (Q1 = 10.0, Q3 = 21.0). During the follow-up from 1994 to the end of 2018, 917 (34%) men included in the analysis died.
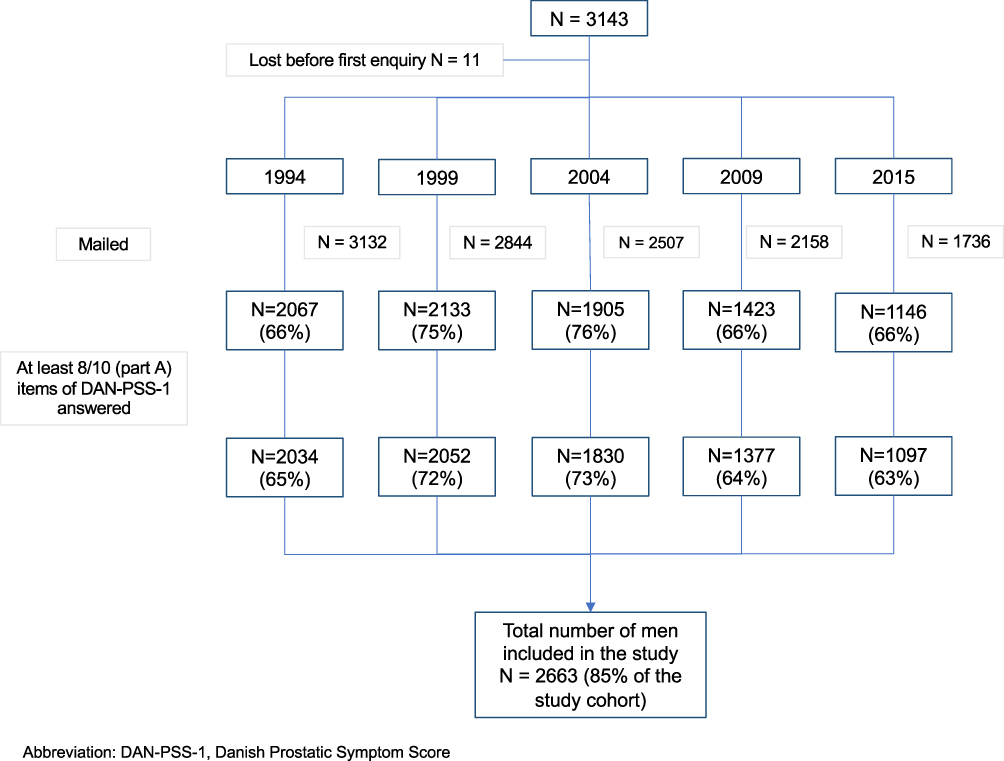 |
Figure 1 Flow chart of the formation of the study population. |
When considering 20% as the threshold probability for a high risk of 5-year mortality, the RF showed a sensitivity of 0.42 and specificity of 0.72 when using LUTS alone for the algorithm (Table 1). The corresponding AUC 0.60 (95% CI 0.52–0.69) indicates some predictive ability for LUTS for all-cause mortality. With the same threshold, the sensitivity in detecting men at high risk of death was lower for sociodemographic, medical, or behavioral factors alone compared to the use of LUTS alone: sensitivities were 0.17, 0.03 and 0.02 for sociodemographic, medical and behavioral factors, respectively. Unsurprisingly, a low sensitivity was associated with high specificities of 0.94, 0.99, 1.00 for RFs based on sociodemographic, medical, and behavioral factors, respectively. Sociodemographic variables showed the highest potential with AUC 0.60 (0.53–0.68) among sociodemographic, medical, or behavioral factors used alone but was comparable to the AUC with LUTS alone.
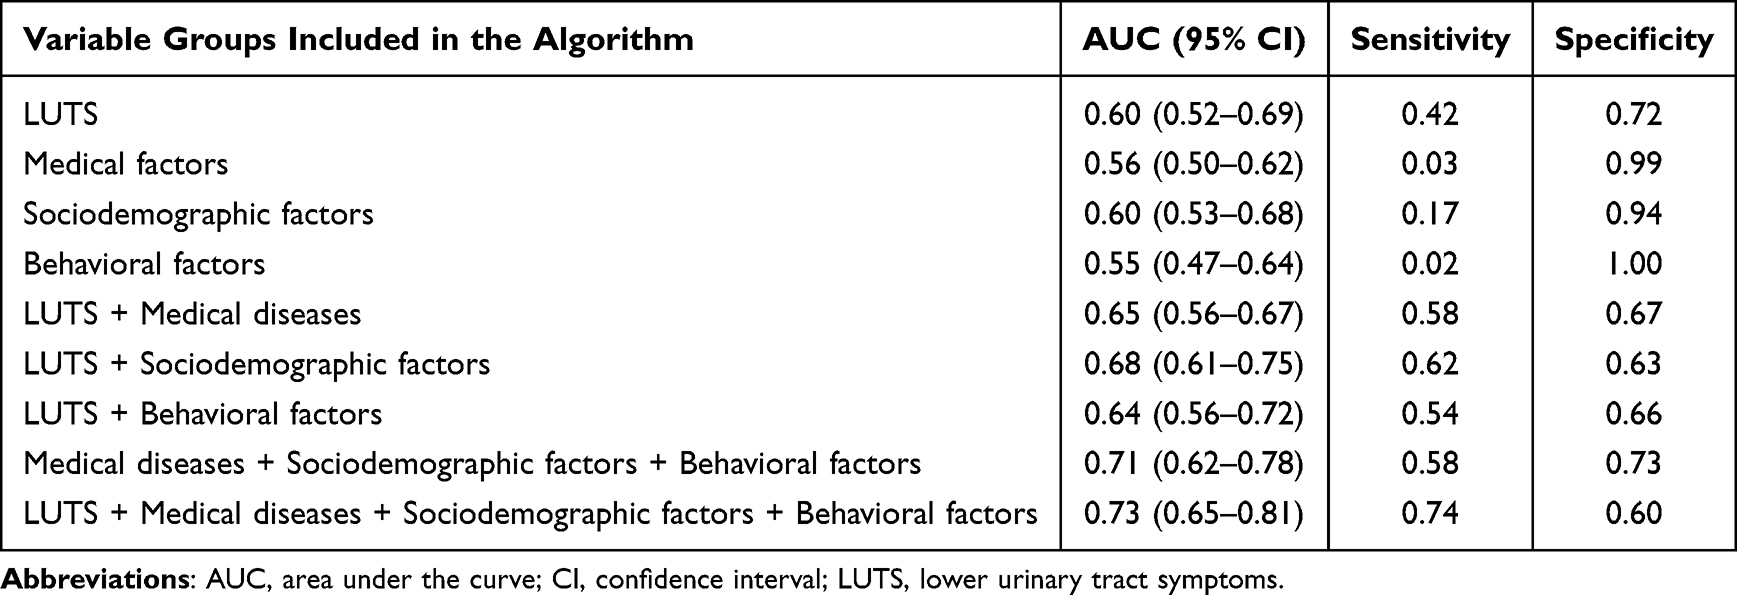 |
Table 1 AUC, Sensitivity and Specificity of the Random Forest by Using Different Variable Groups |
Adding any other set of variables to the RF with LUTS resulted in some improvement in the predictive ability (Table 1). It made little difference which variable group was used. The best-performing RF algorithm contained all variable groups, including LUTS, and demonstrated a marked increase in the AUC (0.73, 0.65–0.81), reaching an acceptable level of discrimination.29 Additionally, the confidence interval nearly excludes that of LUTS alone.
The most important predictor variables were age and body mass index (Supplementary Figure 1). Other important variables included marital status, educational level, cardiac disease, and smoking status. Of the LUTS variables, the total DAN-PSS-1 score, daytime frequency, feeling of incomplete emptying, hesitancy, and nocturia were the most important ones. Variations in the predicted probability of death by age, BMI, DAN-PSS-1 total score, and marital status are presented in Figure 2, and for specific LUTS (daytime frequency, feeling of incomplete emptying, and nocturia) in Supplementary Figure 2. Naturally, the probability of death increased with age. Both extremes of BMI, underweight and overweight, were associated with an increased risk of death, as BMI showed a U-shaped curve. Widowers had a higher mortality rate than other men. The probability of death also increased with the DAN-PSS-1 score, but with a plateau at 75 points. Considering LUTS variables, nocturia severity was associated with a clear increase in the probability of death, but other symptoms also showed an effect though weaker.
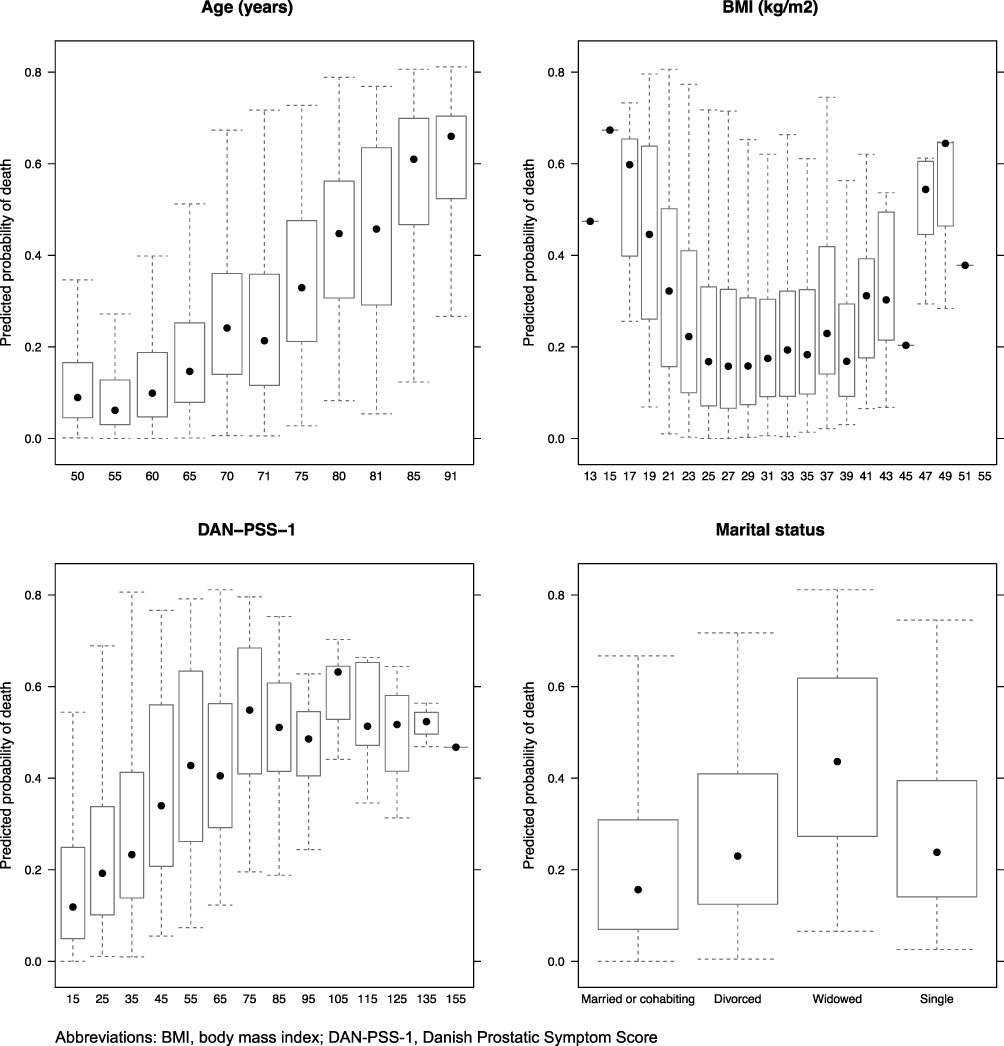 |
Figure 2 The variation of predicted probability of death between the variable values for age, BMI, DAN-PSS-1 total score and marital status. |
The predictive ability of RF was also evaluated for four groups of causes of death: cardiovascular diseases, cancers, respiratory diseases, and falls. An algorithm including only information of LUTS showed little predictive ability for cardiovascular diseases, cancers, or respiratory diseases with the AUC values close to 0.5 (Table 2). The RF including variables other than LUTS was a moderate predictor of cardiovascular diseases (AUC 0.71, 0.61–0.79). Adding LUTS to the RF slightly increased the AUC (0.73 0.63–0.82). For deaths due to respiratory diseases or cancers, the RF algorithm showed AUC values below 0.7. There were few deaths due to falls, which led to a zero sensitivity to predict death caused by falls for the RF with all the variables when the threshold was 20% probability. Nevertheless, the AUC values for predicting deaths caused by falls were comparable to those for other causes of death: 0.68 (0.48–0.90) for the RF algorithm including variables other than LUTS and 0.73 (0.52–0.89) for the RF algorithm including also LUTS.
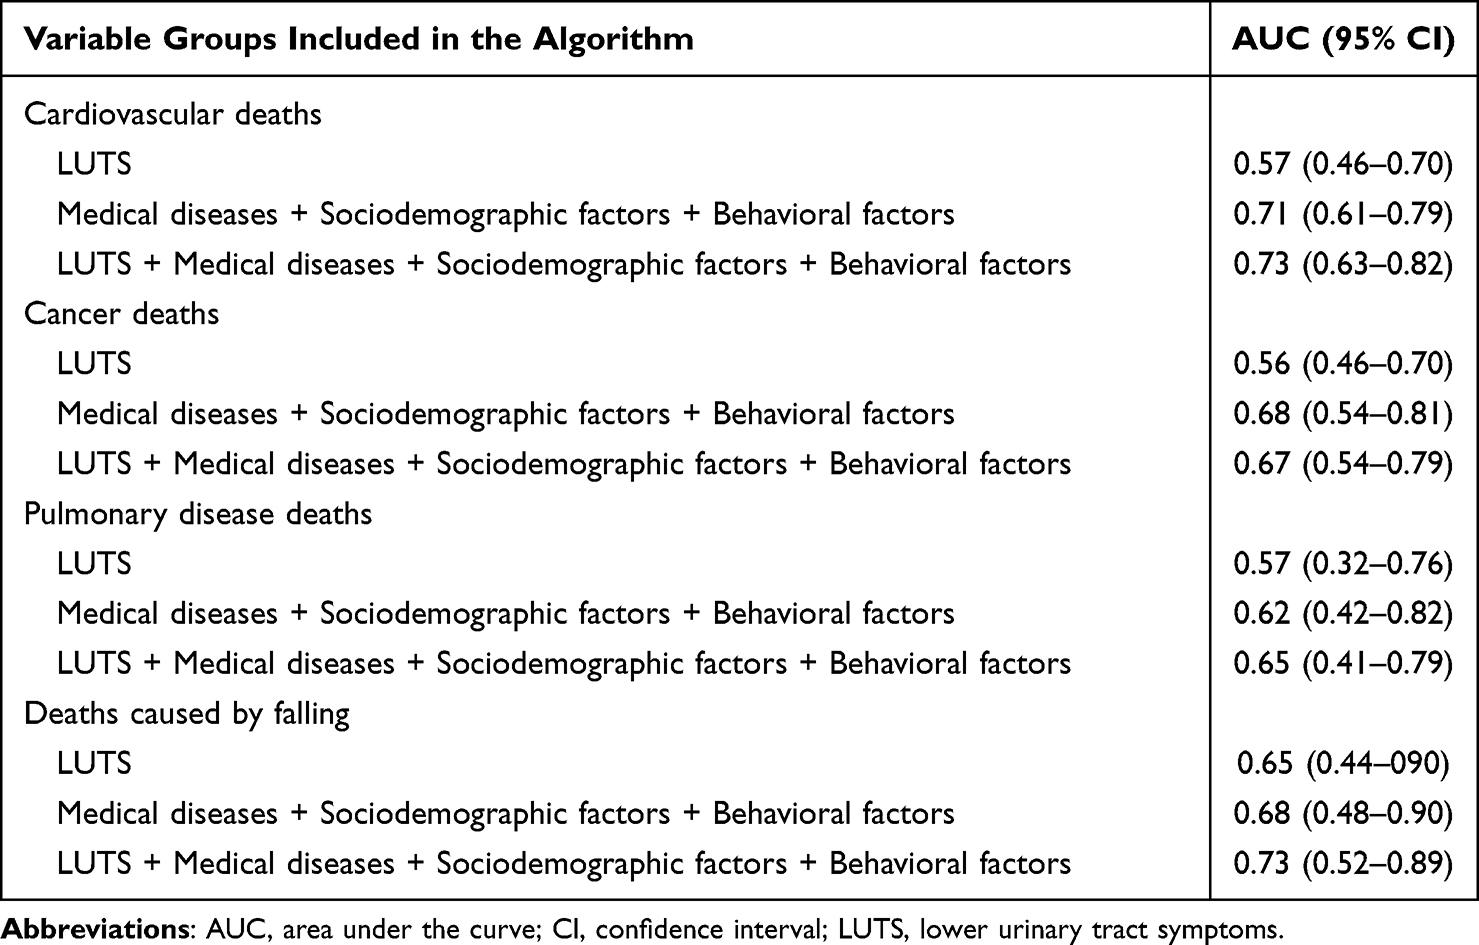 |
Table 2 AUC of the Random Forest by Using Different Variable Groups to Predict Death Due to Specific Cause |
Discussion
Our population-based follow-up study shows that RF incorporating LUTS can reasonably predict five-year risk of death. However, LUTS alone was not a good predictor of five-year mortality (AUC 0.60), although it showed a similar predictive capacity as demographic and medical variables alone. Combining LUTS with demographic, medical, or behavioral factors increased the ability of the RF algorithm to predict five-year mortality to some degree, but the AUCs were still quite low (0.64 to 0.68). Only a combination of all demographic, medical, and behavioral factors provided a moderate predictor with an AUC of 0.71 (as AUC values over 0.7 can be considered to describe an acceptable discrimination).29 Adding information of LUTS into an algorithm with the other three variable groups showed the highest AUC of 0.73, although with overlapping confidence intervals with the RF without LUTS.
Even though ML methods are increasingly used in medical research, few studies have investigated all-cause mortality in a population-based cohort. Instead, most studies have focused on narrow special situations, like perioperative mortality or mortality in specific acute conditions such as infections or cardiovascular events. Weng et al used a large population cohort from the United Kingdom, including 502,628 women and men, to compare the predictive ability of the RF with that of the Cox regression model and another ML method (deep learning) for premature all-cause mortality.9 They found that the ML methods (RF and deep learning) were more accurate in predicting mortality than the Cox model (AUC 0.69 compared to RF AUC 0.78 and deep learning AUC 0.80). These results are quite similar to our results regardless of the difference in the number of predictor variables. The study cohort provided approximately 60 predictor variables, which is a notably greater number than the 22 predictor variables in our study, of which 11 involved LUTS. In another study, Reps et al developed a model using ML to predict patients’ death based on the Observational Medical Outcomes Partnership (OMOP) Common Data Model (CDM) by using over 88,000 predictor variables with good results.30
In previous studies, LUTS, especially nocturia, have been suggested as predictors for premature death.4,5,31 To our knowledge, the present study is the first to employ LUTS and ML methods such as RF to predict all-cause mortality in a population-based cohort. The weaker prediction accuracy of LUTS compared to the findings of previous LUTS association studies on mortality can be explained by the more efficient elimination of confounding factors compared to traditional regression models.
In the present study, combining LUTS with other predictors resulted in the highest AUC, although the confidence intervals overlapped with the AUC of the combination of the other three variable groups. This suggests that the predictive information from LUTS is captured by other characteristics, with little independent contribution from LUTS. The association between LUTS and mortality can result from its association with comorbidities, such as cardiovascular disease, metabolic syndrome, and diabetes.6,32–34 Therefore, when comorbidities are included in the algorithm, LUTS add very little. One of the potential benefits of the RF method, the detection of non-linear associations, was confirmed in our study by identifying and characterizing non-monotonous associations for BMI and LUTS.
The main limitations of the study are the small number of men and outcome events in the study population as well as a relatively limited set of predictor variables. This may limit the accuracy of the RF. The RF including all variables showed the highest AUC but with broad confidence intervals. With a larger study cohort, one could obtain more precise results and a better estimate of the contribution of LUTS to the discrimination ability. ML was developed to deal with vast amounts of data and ideally learns from those data masses, but our analysis contained only 22 variables for two and a half thousand men. The behavioral factors contained only two variables (smoking and BMI). With more extensive information (eg medication, physical activity, and family history), the predictive capability would probably be improved. When interpreting the findings of population-based studies, the validity of the estimates and their applicability in real-world practice must always be considered. The study cohort represents primarily a Caucasian population including both urban and rural residents. Therefore, the results of the current study can be generalized to the Caucasian population. The study findings can only be applied to male patients because the etiologies of various LUTS vary between men and women. In the study sample, factors associated with both LUTS and mortality, such as prostate cancer, were likely to affect some individuals. Furthermore, factors that can be protective against both LUTS and mortality, such as a history of care-seeking, probably affected a small proportion of men. However, we did not apply any selection criteria for the cohort because of the complex causal pathways between various health issues, LUTS, and mortality, as well as the risk of wasting information resulting in weaker statistical power. Finally, the data on the variables included in the analyses were based on self-reports and could therefore be subject to response bias.
Conclusions
In conclusion, the RF algorithm is a good but not a groundbreaking tool for predicting all-cause mortality based on LUTS and a limited set of key risk factors. However, an algorithm based on LUTS alone has a poor discriminative capacity. In clinical practice, it is unlikely that LUTS will improve the accuracy to predict death if the patient’s background is well known. Therefore, the management of male LUTS should include the assessment of men’s general health, risk factors, and major comorbidities.
Abbreviations
LUTS, Lower urinary tract symptoms; RF, random forest; ML, machine learning; TAMUS, Tampere Ageing Male Urologic Study; DAN-PSS-1, Danish Prostatic Symptom Score; BMI, body mass index; AUC, area under the curve.
Funding
The TAMUS study was financially supported by the Päivikki and Sakari Sohlberg Foundation and the Competitive State Research Financing of the Expert Responsibility area of Tampere University Hospital (9V065 and 9×055). State Research Funding (Finland) was used for data collection. The work of Jonne Åkerla was funded by the Finnish Urological Association. The funders had no role in the study design, data collection and analysis, decision to publish, or preparation of the manuscript.
Disclosure
Jori S Pesonen has received a lecture honorarium from Astellas, Boston Scientific, and Ferring and attended a scientific congress as a guest for Orion. Teuvo Tammela has worked as a consultant for Astellas, Pfizer and Bayer AG. The other authors have no relevant financial or non-financial interests to disclose for this work.
References
1. Irwin DE, Kopp ZS, Agatep B, Milsom I, Abrams P. Worldwide prevalence estimates of lower urinary tract symptoms, overactive bladder, urinary incontinence and bladder outlet obstruction. BJU Int. 2011;108(7):1132–1138. doi:10.1111/j.1464-410X.2010.09993.x
2. He Q, Wang Z, Liu G, Daneshgari F, MacLennan GT, Gupta S. Metabolic syndrome, inflammation and lower urinary tract symptoms: possible translational links. Prostate Cancer Prostatic Dis. 2016;19(1):7–13. doi:10.1038/pcan.2015.43
3. Gacci M, Vignozzi L, Sebastianelli A, et al. Metabolic syndrome and lower urinary tract symptoms: the role of inflammation. Prostate Cancer Prostatic Dis. 2013;16(1):100–105. doi:10.1038/pcan.2012.44
4. Pesonen JS, Cartwright R, Vernooij RWM, et al. The impact of nocturia on mortality: a systematic review and meta-analysis. J Urol. 2020;203(3):486–495. doi:10.1097/JU.0000000000000463
5. Åkerla J, Pesonen JS, Pöyhönen A, et al. Impact of lower urinary tract symptoms on mortality: a 21-year follow-up among middle-aged and elderly Finnish men. Prostate Cancer Prostatic Dis. 2019;22(2):317–323. doi:10.1038/s41391-018-0108-z
6. Gacci M, Corona G, Sebastianelli A, et al. Male lower urinary tract symptoms and cardiovascular events: a systematic review and meta-analysis. Eur Urol. 2016;70(5):788–796. doi:10.1016/j.eururo.2016.07.007
7. Nuotio M, Tammela TLJ, Luukkaala T, Jylha M. Urgency and urge incontinence in an older population: ten-year changes and their association with mortality. Aging Clin Exp Res. 2002;14(5):412–419. doi:10.1007/BF03324470
8. Matta R, Hird AE, Saskin R, et al. Is there an association between urinary incontinence and mortality? A retrospective cohort study. J Urol. 2020;203(3):591–597. doi:10.1097/JU.0000000000000574
9. Weng SF, Vaz L, Qureshi N, Kai J. Prediction of premature all-cause mortality: a prospective general population cohort study comparing machine-learning and standard epidemiological approaches. PLoS One. 2019;14(3):e0214365. doi:10.1371/journal.pone.0214365
10. Ajnakina O, Agbedjro D, Mccammon R, et al. Development and validation of prediction model to estimate 10-year risk of all-cause mortality using modern statistical learning methods: a large population-based cohort study and external validation. BMC Med. Res. Method. 2021;21:1. doi:10.1186/s12874-020-01204-7
11. Wilson PWF, D’Agostino RB, Levy D, Belanger AM, Silbershatz H, Kannel WB. Prediction of coronary heart disease using risk factor categories. Circulation. 1998;97(18):1837–1847. doi:10.1161/01.CIR.97.18.1837
12. Costantino JP, Gail MH, Pee D, et al. Validation studies for models projecting the risk of invasive and total breast cancer incidence. J Natl Cancer Inst. 1999;91(18):1541–1548. doi:10.1093/jnci/91.18.1541
13. Hippisley-Cox J, Coupland C, Robson J, Brindle P. Derivation, validation, and evaluation of a new QRISK model to estimate lifetime risk of cardiovascular disease: cohort study using QResearch database. BMJ. 2010;341(7788):93. doi:10.1136/BMJ.C6624
14. Koskimäki J, Hakama M, Huhtala H, Tammela T. Prevalence of lower urinary tract symptoms in Finnish men: a population-based study. Br J Urol. 1998;81(3):364–369. doi:10.1046/j.1464-410x.1998.00565.x
15. Häkkinen JT, Hakama M, Shiri R, Auvinen A, Tammela TLJ, Koskimäki J. Incidence of nocturia in 50 to 80-year-old Finnish men. J Urol. 2006;176:2541–2545. doi:10.1016/j.juro.2006.08.017
16. Hansen BJ, Flyger H, Brasso K, et al. Validation of the self-administered Danish prostatic symptom score (DAN-PSS-1) system for use in benign prostatic hyperplasia. Br J Urol. 1995;76(4):451–458. doi:10.1111/j.1464-410X.1995.tb07744.x
17. Esteva A, Kuprel B, Novoa RA, et al. Dermatologist–level classification of skin cancer with deep neural networks. Nature. 2017;542(7639):115. doi:10.1038/NATURE21056
18. Gulshan V, Peng L, Coram M, et al. Development and validation of a deep learning algorithm for detection of diabetic retinopathy in retinal fundus photographs. JAMA. 2016;316(22):2402–2410. doi:10.1001/jama.2016.17216
19. Weng SF, Reps J, Kai J, Garibaldi JM, Qureshi N. Can machine-learning improve cardiovascular risk prediction using routine clinical data? PLoS One. 2017;12(4):e0174944. doi:10.1371/JOURNAL.PONE.0174944
20. Young J, Kempton MJ, McGuire P. Using machine learning to predict outcomes in psychosis. Lancet Psychiatry. 2016;3(10):908–909. doi:10.1016/S2215-0366(16)30218-8
21. Yu KH, Zhang C, Berry GJ, et al. Predicting non-small cell lung cancer prognosis by fully automated microscopic pathology image features. Nat Commun. 2016;7. doi:10.1038/ncomms12474
22. Yun K, Oh J, Hong TH, Kim EY. Prediction of mortality in surgical intensive care unit patients using machine learning algorithms. Front Med. 2021;8:406. doi:10.3389/FMED.2021.621861/BIBTEX
23. Spooner A, Chen E, Sowmya A, et al. A comparison of machine learning methods for survival analysis of high-dimensional clinical data for dementia prediction. Sci Rep. 2020;10(1):1–10. doi:10.1038/s41598-020-77220-w
24. Breiman L. Random Forests. Machine Learning. 2001;45(1):5–32. doi:10.1023/A:1010933404324
25. Speiser JL, Wolf BJ, Chung D, Karvellas CJ, Koch DG, Durkalski VL. BiMM forest: a random forest method for modeling clustered and longitudinal binary outcomes. Chemom Intell Lab Syst an Int J Spons by Chemom Soc. 2019;185:122. doi:10.1016/J.CHEMOLAB.2019.01.002
26. Speiser JL, Wolf BJ, Chung D, Karvellas CJ, Koch DG, Durkalski VL. BiMM tree: a decision tree method for modeling clustered and longitudinal binary outcomes. Commun Stat Simul Comput. 2020;49(4):1004–1023. doi:10.1080/03610918.2018.1490429
27. Hajjem A, Bellavance F, Larocque D. Mixed-effects random forest for clustered data. J Stat Comput Simul. 2014;84(6):1313–1328. doi:10.1080/00949655.2012.741599
28. Breiman L Manual for setting up, using, and understanding random forest V4.0; 2003. Available from: https://www.stat.berkeley.edu/~breiman/Using_random_forests_v4.0.pdf.
29. Hosmer DW, Lemeshow S, Sturdivant RX. Applied Logistic Regression. Hoboken, N.J.: Wiley; 2013:177.
30. Reps JM, Rijnbeek PR, Ryan PB. Identifying the DEAD: development and validation of a patient-level model to predict death status in population-level claims data. Drug Saf. 2019;42(11):1377–1386. doi:10.1007/s40264-019-00827-0
31. Funada S, Tabara Y, Setoh K, et al. Impact of nocturia on mortality: the nagahama study. J Urol. 2020;204(5):996–1002. doi:10.1097/JU.0000000000001138
32. Pashootan P, Ploussard G, Cocaul A, De Gouvello A, Desgrandchamps F. Association between metabolic syndrome and severity of lower urinary tract symptoms (LUTS): an observational study in a 4666 European men cohort. BJU Int. 2015;116(1):124–130. doi:10.1111/bju.12931
33. Russo GI, Castelli T, Privitera S, et al. Increase of Framingham cardiovascular disease risk score is associated with severity of lower urinary tract symptoms. BJU Int. 2015;116(5):791–796. doi:10.1111/bju.13053
34. Coyne KS, Kaplan SA, Chapple CR, et al. Risk factors and comorbid conditions associated with lower urinary tract symptoms: epiLUTS. BJU Int. 2009;103:24–32. doi:10.1111/j.1464-410X.2009.08438.x
 © 2024 The Author(s). This work is published and licensed by Dove Medical Press Limited. The full terms of this license are available at https://www.dovepress.com/terms.php and incorporate the Creative Commons Attribution - Non Commercial (unported, v3.0) License.
By accessing the work you hereby accept the Terms. Non-commercial uses of the work are permitted without any further permission from Dove Medical Press Limited, provided the work is properly attributed. For permission for commercial use of this work, please see paragraphs 4.2 and 5 of our Terms.
© 2024 The Author(s). This work is published and licensed by Dove Medical Press Limited. The full terms of this license are available at https://www.dovepress.com/terms.php and incorporate the Creative Commons Attribution - Non Commercial (unported, v3.0) License.
By accessing the work you hereby accept the Terms. Non-commercial uses of the work are permitted without any further permission from Dove Medical Press Limited, provided the work is properly attributed. For permission for commercial use of this work, please see paragraphs 4.2 and 5 of our Terms.