")
Back to Journals » Journal of Blood Medicine » Volume 15
Establishment of Reference Intervals of Blood Parameters Among the Healthy Afghan Population
Authors Sherzay N, Azimi Z , Sheikh Abdul Kadir SH, Mohd Nor NS
Received 19 October 2023
Accepted for publication 29 January 2024
Published 15 February 2024 Volume 2024:15 Pages 69—75
DOI https://doi.org/10.2147/JBM.S437594
Checked for plagiarism Yes
Review by Single anonymous peer review
Peer reviewer comments 2
Editor who approved publication: Dr Martin H Bluth
Najia Sherzay,1– 3 Ziauddin Azimi,1,2 Siti Hamimah Sheikh Abdul Kadir,1,4 Noor Shafina Mohd Nor1,4
1Institute for Pathology, Laboratory and Forensic Medicine (I-PPerForM), Universiti Teknologi MARA, Cawangan Selangor, Sungai Buloh, Selangor, 47000, Malaysia; 2Department of Biochemistry, Faculty of Pharmacy, Kabul University, Karte Sakhi, Kabul, Afghanistan; 3Laboratory of Electrophiles and Genome Operation, Institute of Chemical Sciences and Engineering, École Polytechnique Fédérale de Lausanne (EPFL), Lausanne, Switzerland; 4Faculty of Medicine, Universiti Teknologi MARA, Sungai Buloh, Selangor, 47000, Malaysia
Correspondence: Najia Sherzay; Siti Hamimah Sheikh Abdul Kadir, Email [email protected]; [email protected]
Purpose: This study was designed and conducted to validate the reference values of hematological parameters for healthy adult male and female residents of Kabul city, Afghanistan.
Methodology: In this cross-sectional study, the samples were collected according to a non-random sampling method. Blood samples were collected from students and employees of Kabul University. The study included 166 males and 125 females, aged 18– 45 years. The selection and exclusion of participants were carried out according to a questionnaire and the assessment of serum ferritin and vitamin B12 levels. Candidates with lower serum ferritin and vitamin B12, a history of chronic disease, females with menstruation or pregnancy, and those with chronic abdominal pain were excluded.
Results: Reference ranges for all blood parameters were determined by a non-parametric method. The determined reference values were compared between males and females by the Z-test. Reference intervals for hemoglobin (4.5– 6.3 g/dL for males and 3.66– 5.67 g/dL for females) and hematocrit (36.23– 55.93% for males and 30.20– 53.86% for females) were significantly (p< 0.05) higher in males. No significant (p< 0.05) differences were observed between the reference intervals for the red blood cell count.
Conclusion: Therefore, we conclude that the commonly used reference intervals should be revised for the Afghan population, as our findings indicated higher reference values for the hemoglobin and hematocrit indices.
Keywords: reference range, blood parameters, Afghan population
Introduction
Successful therapy is the basic aim of a healthcare system. Scientists are working hard to invent new medicines and more effective treatment strategies. But all of these efforts can only be successful when there is an accurate diagnosis of the disease. For accurate diagnosis, along with the signs and symptoms of disease, medical laboratories play a pivotal role. Good laboratory practices ensure more accurate results. All of the strategies of good laboratory practices aim to establish the patient as a patient and the healthy individual as healthy. To achieve this aim, although the laboratory equipment, standards and qualified staff are important, the presence of correct reference ranges is equally important.1
The reference range or reference interval is the range of values of a specific analyte found in 95% of the healthy reference population. Historically, the term used was the “normal range”, but according to ISO 15189, the use of the term normal range is now considered incorrect. This is because, first, 5% of healthy individuals do not meet the criteria or their results are outside the range, and second, “normal” is the term used for the normal distribution in statistics, but the distribution of findings in the reference interval is not always normally distributed.2
A number of factors can affect the results of any analyte while comparing it with the reference range. These include, age, sex, ethnic group, certain conditions such as pregnancy, athletic lifestyle, and environmental influences. Individual history and personal information are important to enable comparison of an individual’s results with the right reference interval. Therefore, it is important that a distinct reference interval is used for each group of people.2,3
An accurate reference interval is important not only for diagnostic purposes but also for screening purposes. In Afghanistan, anemia is a common problems in women of reproductive age and in children; therefore, screening tests are usually running continuously in different parts of the country to assess the need for new treatments and preventive strategies.4 However, hematological parameters can be affected by different factors, such as age, body build, ethnic group, nutritional habits, and living environment, especially altitude.5 It is therefore crucial to find out the reference ranges for the Afghan population.
In Afghanistan, medical laboratories use either the reference intervals from textbooks, usually originating in western countries, or the reference intervals provided by manufacturing companies, which are imported from different regions of the world. So far, there has been no validation of reference intervals for the Afghan population.6 Thus, in this study, we investigated the ranges of hematological parameters among the Afghan population and compared them with the reference intervals.
Subjects and Method
The study was performed in accordance with the ethical standards laid down in the Declaration of Helsinki. The methodology was reviewed and approved by the research committee of the Faculty of Pharmacy, Kabul University, and the academic council of the Faculty of Pharmacy, Kabul University. For validation purposes, we used the reference intervals of three well-known laboratories in Kabul city; each of these laboratories uses different reference intervals, although they cover the same population. Then, according to the CLSI guideline, we analyzed the blood samples of 20 reference individuals to analyze the validity of the existing reference intervals. More than 10% (more than two) were outside these reference intervals. We collected the blood samples of 20 more reference individuals, and the results of more than 10% fell outside the existing reference intervals. Thus, we decided to establish the reference intervals of hematological parameters for the Afghan population. This study is the first to be conducted in Afghanistan for the analysis of reference intervals of hematological parameters.
The study was designed as a cross-sectional study and conducted from October 2017 to March 2018. Sampling was performed using a non-random sampling method (convenience sampling), and subjects were selected from the male and female students and workers at Kabul University. Recruitment was carried out by placing written posters about the research in different parts of university. Informed written consent forms were signed by all volunteers, and they were interviewed using a written precoded questionnaire. Candidates with the following criteria were selected for sampling:
- Aged 18–45 years
- Do not have a chronic disease, eg, cardiovascular disease, hypertension, diabetes
- Have not had a blood transfusion in the past 3 months
- Have not donated blood in the past 3 months
- Do not have internal or external bleeding
- Females without pregnancy or menstruation
- Do not have a history of abdominal pain (a sign of intestinal parasites)
- Should not be a smoker or an addict.
Blood Sampling
Blood samples were collected using Vacutainers in two distinct tubes (EDTA and gel tubes, 3 mL in each) following standard phlebotomy techniques.
Determination of Blood Parameters
In blood samples obtained in EDTA tubes, the hemoglobin (Hb), hematocrit (HCT), red blood cell (RBC) count, and blood indices (mean corpuscular volume [MCV], mean corpuscular hemoglobin [MCH], mean corpuscular hemoglobin concentration [MCHC]) were determined using a Medonic hematology analyzer. The procedure was carried out three times for each test and the mean of all three results was selected. If a blood sample was damaged, the candidate was requested to give another blood sample.
Determination of Ferritin and Vitamin B12
The blood samples obtained in gel tubes were centrifuged and then stored at −20°C until further analysis. On the day of analysis, the blood the serum was brought up to room temperature, and serum ferritin and vitamin B12 levels were determined by the ELISA method with an RT2100C microplate reader, following the manufacturer’s guidelines.
Statistical Analysis
The data were arranged in Microsoft Excel and reference intervals were determined using MedCalc (MedCalc statistical software version 15.2). Reference intervals were determined by a non-parametric method; for data with a normal distribution, the reference interval was determined as the mean±2SD, and for data that were not normally distributed, the central 95% of numbers was selected as the reference interval.
Normality was assessed by the Shapiro–Wilk normality test, which is considered the best test of normality for the data frequency more than 50. For the determination of outliers, the method of Reed 1971 was used. Differences between males and females were analyzed by the Z test at a significance level of p<0.05.7 The reference ranges are shown as box-and-whisker plots.
Results
In this study, 240 males and 198 females participated; 63 males and 54 females were excluded as a result of the questionnaire, and 11 males and 19 females were excluded because of low levels of ferritin. The level of vitamin B12 was normal in all participants. Therefore, the results of 166 males and 125 females were analyzed for determination of the reference ranges.
First, we determined the reference ranges for Hb, HCT, and RBC count for both the male and female population. We used the non-parametric method for the determination of the reference range; for normally distributed data, the reference range was selected as mean±2SD, and for data that were not normally distributed the reference range was determined as the middle 95% of data. We also compared the difference of reference ranges of each parameter for both groups of male and female to determine whether the difference was significant. According to the skewness, kurtosis, results of the Shapiro–Wilk test, and p values, HCT and RBC were normally distributed for the female population, and HCT was normally distributed for the male population, while the distribution of other parameters was not normal (Figure 1).
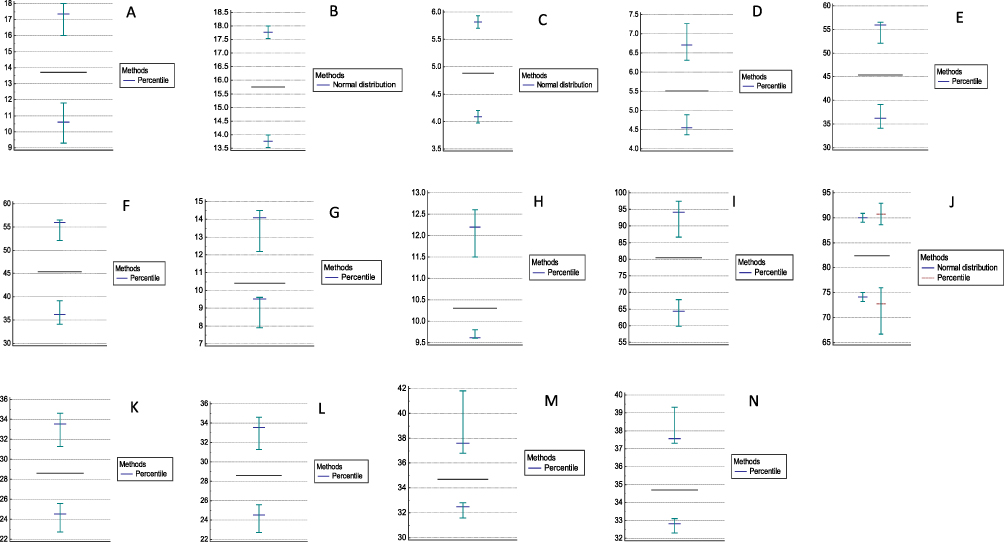 |
Figure 1 Box-and-whisker graphs of blood parameters obtained by MedCalc statistical software. (A) is belong to female hemoglobin, most of the data is between 11.9 to 16, (B) is belong to male Hb, the data is normally distributed therefore the length of whiskers are similar and from graph it is clearly can be observed that the reference interval is between 13.7-17.7, (C) is belong to the female RBCs the data is normally distributed and the reference range clearly observed from the middle point of whiskers. (D) is representing the RBCs of male candidates, the majority of data is situated between 4.9 to 6.5. (E) is belonging to the female HCT, most of the data is situated between 34 to 47 and the data is not distributed normally. (F) is representative of male HCT the data is not distributed normally and most of the data is situated between 38 to 52. (G) is belong to the female RDW, the data is not distributed normally, (H) is representative of male RDW, the data is not distributed normally. (I) represents female MCV, data is not distributed normally, (J) represents MCV for male population, (K) represents MCH for female population, (L) represents MCH for male population, (M) represents MCHC for female population, (N) represents MCHC for female population. |
In the male population, the lowest recorded values were Hb 13.4 g/dL, RBC 4.3 million/µL, red blood cell distribution width (RDW) 9.6%, and HCT 34.1%, while the highest values were Hb 19 g/dL, RBC 7.2 million/µL, RDW 12.6%, and HCT 56.5%. According to the kurtosis, skewness, and Shapiro–Wilk test using MedCalc software, only the distribution of Hb was normal, and the reference ranges were determined by the non-parametric method. In female candidates, the lowest recorded values were Hb 9.3 g/dL, RBC 3.6 million/µL, RDW 7.9%, and HCT 26.5%, while the highest recorded values were Hb 18 g/dL, RBC 6.2 million/µL, RDW 14.5%, and HCT 56.3%. The results of these parameters are listed in Table 1.
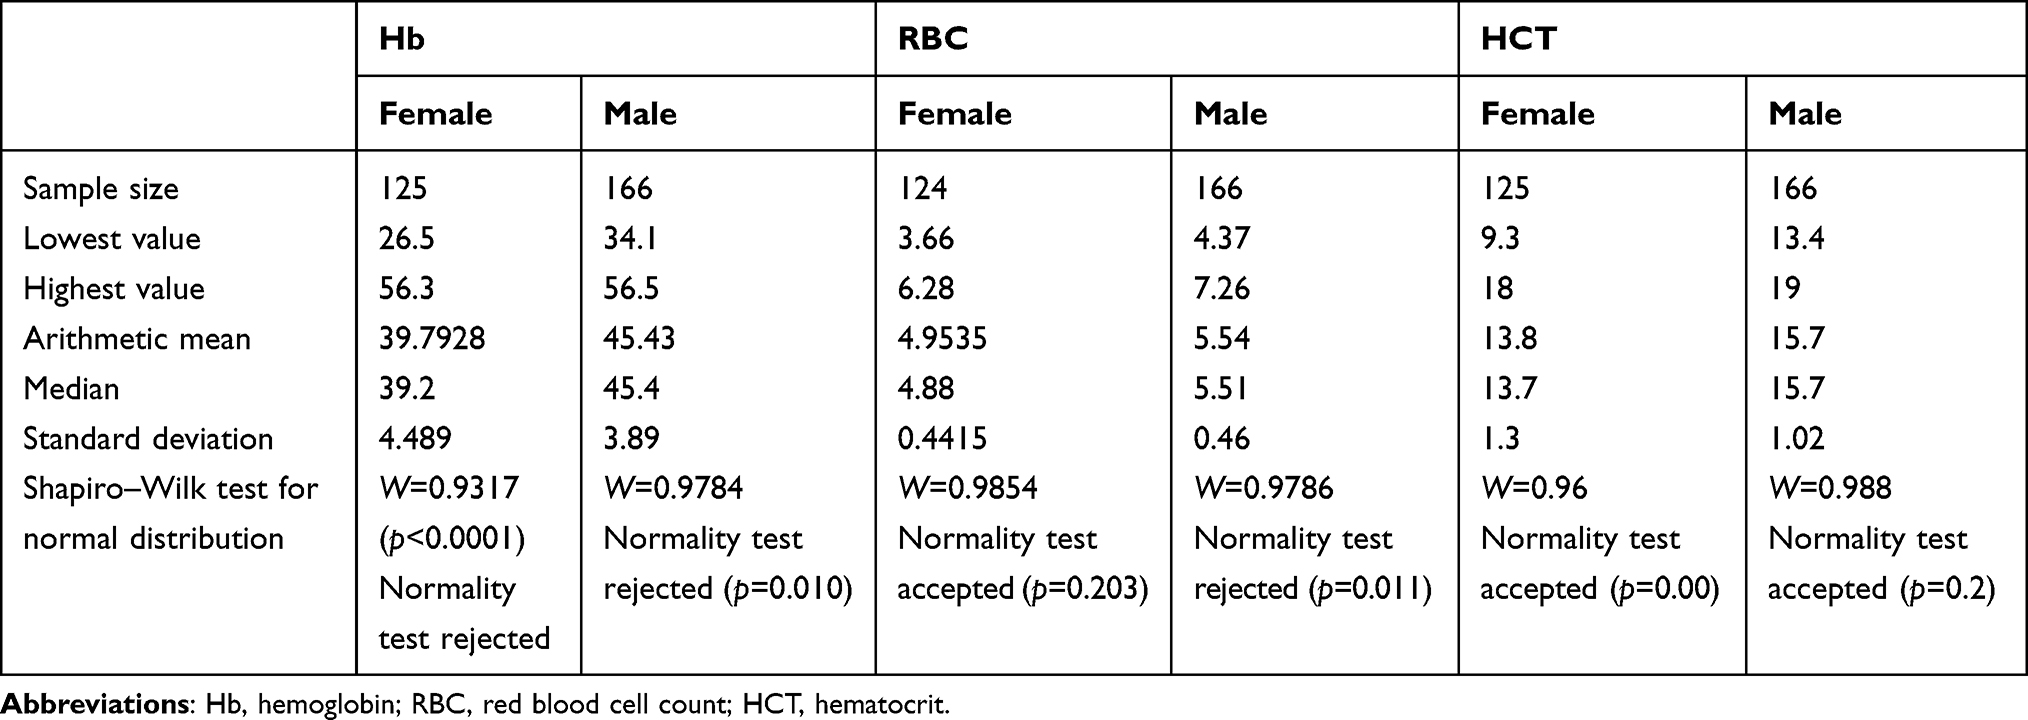 |
Table 1 Statistical Analysis of Blood Parameters for the Determination of Reference Intervals |
According to the analyses of kurtosis, skewness, and the Shapiro–Wilk test, the data for all three parameters (Hb, RBC and HCT) in both male and female candidates, were not normally distributed (Table 1). The results for RBCs were normally distributed, while all other parameters rejected the normality test; hence, it was preferred to define the reference range according to the non-parametric method. Therefore, the reference intervals of Hb, RBC, and HCT were determined by MedCalc software as 90% reference intervals (Table 2).
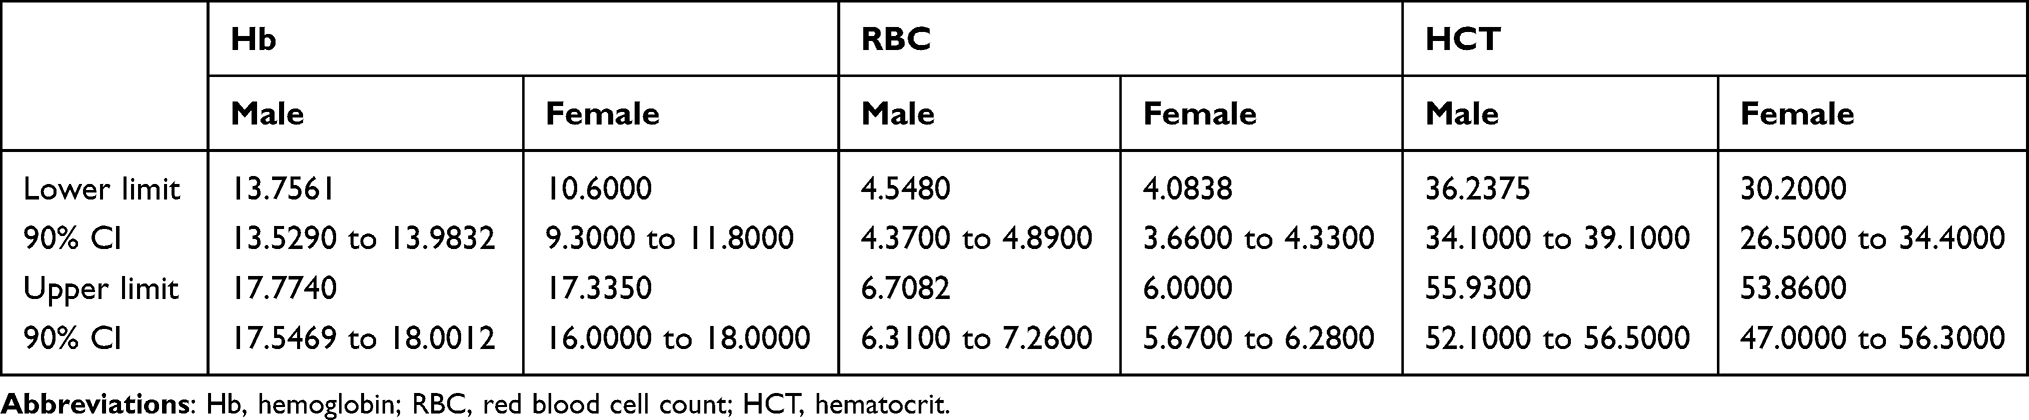 |
Table 2 Lower Limit and Upper Limit of Reference Intervals of Blood Parameters, with 90% Confidence Intervals |
Levels of blood indices were determined automatically using a Medonic hematology analyzer. For male candidates, the lowest values of blood indices were recorded as MCV 22.7 fL, MCH 22.7 pg, and MCHC 31.6 g/dL, and the highest recorded values were MCV 92 fL, MCH 33.8 pg, and MCHC 39.3 g/dL. For female candidates, the lowest recorded numbers were MCV 59.8 fL, MCH 19.9 pg, and MCHC 32.3g/dL, and the highest recorded numbers were MCV 97.4 fL, MCH 33.4 pg, and MCHC 32.3g/dL. The results are listed in Table 3. For the determination of reference ranges of blood indices, the same statistics were measured. All of the determined blood indices, MCV, MCHC, and MCH, rejected the Shapiro–Wilk test.
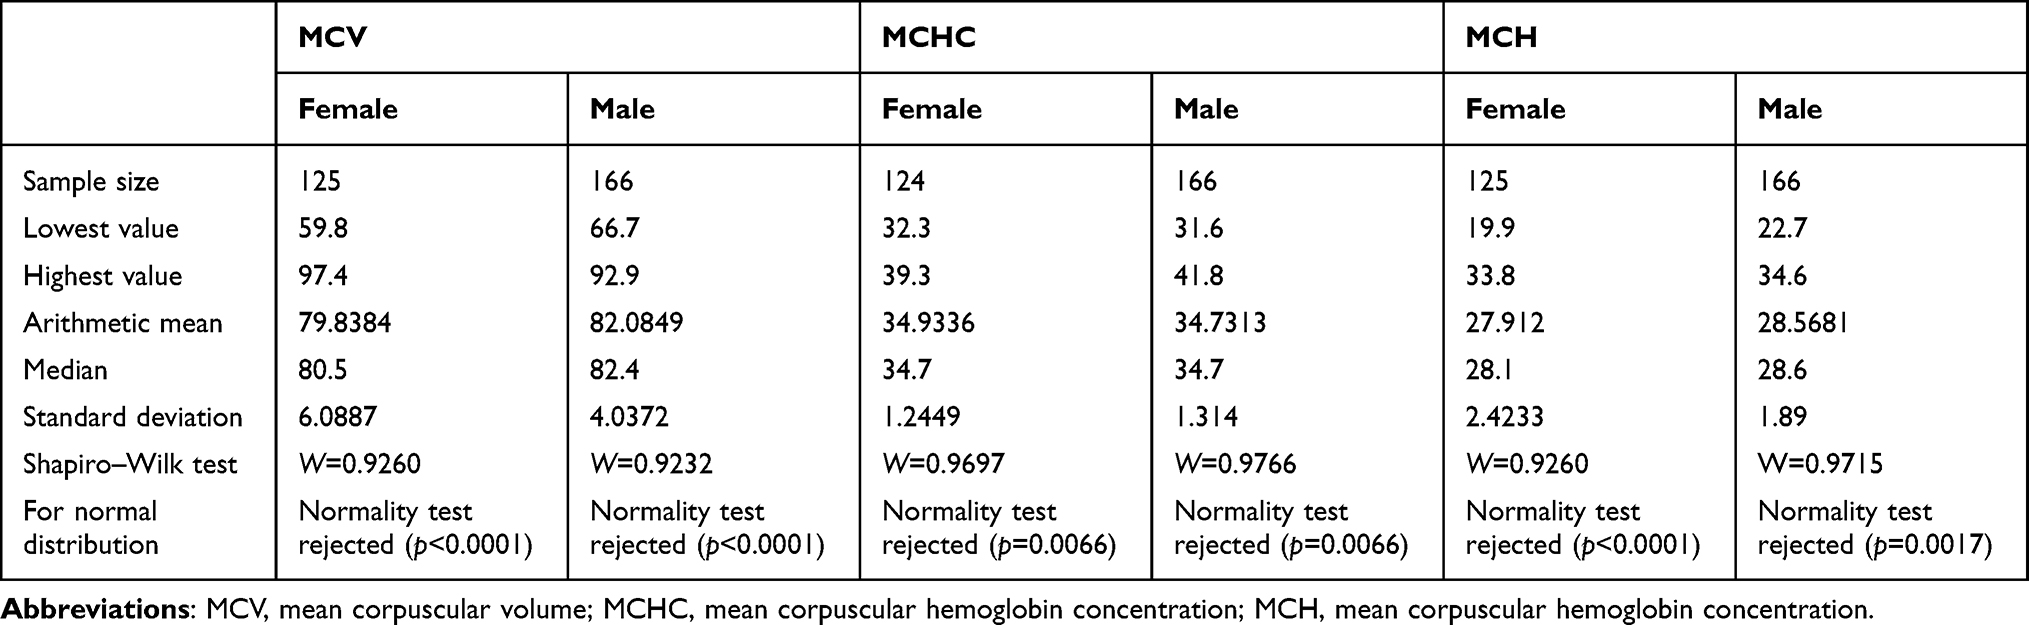 |
Table 3 Statistical Analysis of Blood Indices for the Determination of Reference Intervals |
The reference ranges of the blood indices were determined by a non-parametric method using MedCalc software as 90% confidence intervals (Table 4).
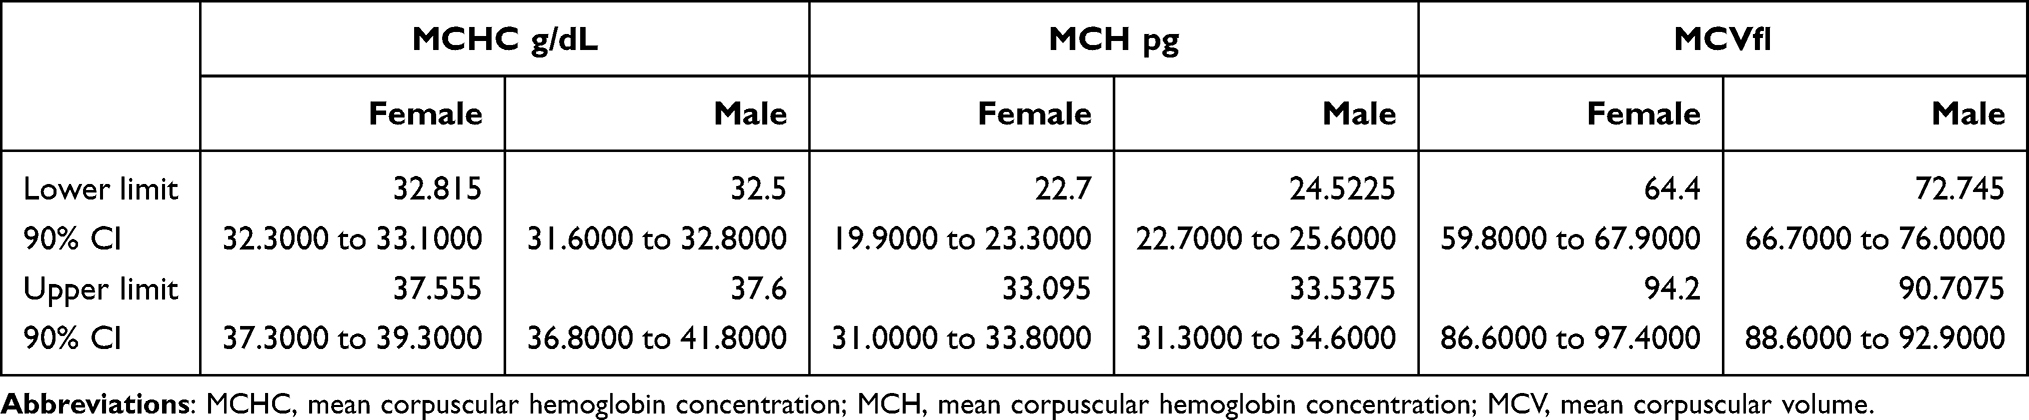 |
Table 4 Lower Limit and Upper Limit of Reference Intervals of Blood Indices, with 90% Confidence Intervals |
Discussion
The aim of reference values is to categorize an individual in a real-world health situation as being a patient or a healthy individual, or to show the real health situation according to the specific parameter; for example, if a person is suspected as having diabetes, the blood glucose level should really show the difference between the healthy individual and diabetic patients. According to the CLSI guideline (C28-A3), laboratories may adapt existing references that have been validated by donor laboratories or manufacturers. For this purpose, a laboratory should analyze a parameter of interest in a small sample size (n=20) of its covered population, and if no more than two (10%) fall outside the reference interval, the reference interval can be adopted; if more than two fall outside, then another 20 samples should be obtained, and then if no more than two fall outside the existing reference range it can be adopted; otherwise, the laboratory should establish a reference interval for its covered population.8
Several studies have been conducted and their results have shown that reference intervals are different for different populations. For example, the reference ranges for African-American, African and Afro-Caribbean populations are lower than for Caucasians.5 Furthermore, climate and altitude are also known as factors having an effect on blood parameters.9
Kabul, the capital city of Afghanistan, is situated at an altitude of 1800 meters, and the population living in Afghanistanconsists of numerous ethnolinguistic groups: mainly the Pashtun, Tajik, Hazara, and Uzbek and several minorities.10 Until now, no research has been conducted to verify whether the reference ranges which are used in laboratories in Kabul city are valid. Even the reference ranges used in laboratories in the same area were different from those of the manufacturers of their machines. This research is the first study undertaken in Afghanistan; however, similar research has been conducted in Iran, Pakistan, Iraq, Turkey, Africa, and Indonesia.
The reference range for RBC in our research was greater than those determined in Pakistan, Uganda, and South Africa, while it was similar to that in Turkey. Differences between the reference range of males and females were significant.9,11,12
The reference range of hemoglobin was significantly different (p<0.05) for males and females; therefore, we suggest different reference intervals for the two genders. The reference range of the hemoglobin level of the male Afghan population is higher than the results from populations in Pakistan and Uganda, while it was similar to the reference ranges of Turkey, Kenya, and South Africa. In the female population, the reference range was higher than in Pakistan and South Africa, but wider than in Turkey, Kenya, and Uganda, meaning that the lower limit is lower and the higher limit is higher than in these countries.9,11
The reference range for hematocrit was significantly different for the male and female populations, and it was higher than in Pakistan and Uganda and similar to those in Turkey, Kenya, and South Africa.6,12,13 For RDW, the difference between the male and female populations was not significant; therefore, the same reference interval can be used for both sexes. RDW was measured only in the population from Turkey, and their reference range was higher than the Afghan population and also suggested the same reference interval for both sexes (Ozarda et al, 2017).6 The reference range of MCV was not significantly different between the genders. In our study, the lower limit for the male population was higher than in Uganda and the higher limit was lower than in Uganda, and in the female population the reference range was lower than in Uganda. The reference ranges for East Kenya and South Africa were wider than our results.6,1213 For MCH, the difference between the sexes was significant, and the reference range was lower than in Pakistan and was similar to that in Turkey. The difference in the reference range of MCHC was not significant between the sexes, and the results for Pakistan and Turkey were lower than our result.
Conclusion
The reference intervals for hematological parameters have not been validated in the Afghan population. Even well-known laboratories are using the reference ranges suggested by the manufacturers of machines and reagents. According to our results, these reference intervals are not accurate or valid for the Afghan population. We have established reference intervals for hematological parameters for the Afghan population, particularly those living in Kabul city. However, further studies are needed with a bigger sample size and random sampling method.
Disclosure
The authors report no conflicts of interest in this work.
References
1. Ceriotti EF, Fleming JK, Greenberg N, et al. Reference intervals: strengths, weaknesses, and challenges Q & A. Chem Chem. 2016;62(7):916–923. doi:10.1373/clinchem.2016.256511
2. Sikaris KA. Physiology and its importance for reference intervals. Clinc Biochem Rev. 2014;35(1):3–14.
3. Płaczkowska S, Terpińska M, Piwowar A. The importance of establishing a refernce interval,is it still a Current Problem for Laboratory and Doctors? Clin Lab. 2020;66(8):1–8. doi:10.7754/Clin.Lab.2020.191120
4. Oskorouchi HR, Nie P, Sousa-Poza A. The effect of floods on anemia among reproductive age women in Afghanistan. PLoS One. 2018;13(2):1–15. doi:10.1371/journal.pone.0191726
5. El-hazmi MAF, Warsy AS. Normal reference values for hematological parameters, red cell indices, Hb A2 and Hb F from early childhood through adolescence in Saudis. Ann Saudi Med. 2014;2(3–4):165–169. doi:10.5144/0256-4947.2001.165
6. Ozarda Y. Reference intervals: current status, recent developments and future considerations. Biochem Med. 2016;26(1):5–16. doi:10.11613/BM.2016.001
7. Reed AH, Henry RJ, Mason WB Influenceof statistical method used on the resultingestimate of normal range. Clin Chem. 1971;17. Available from: https://academic.oup.com/clinchem/article-abstract/17/4/275/5675726.
8. Ozarda Y, Kiyoshi Ichihara EB, Polat H, et al. A nationwide multicentre study in Turkey for establishing reference intervals of haematological parameters with novel use of a panel of whole blood. Biochemia Media. 2017;27(2):350–377. doi:10.11613/BM.2017.038
9. Usman K, Syed ZA, Rao AA. Reference ranges values of haematological parameters in healthy pakistani adults. Pak J Physiol. 2007;3(1):19–22.
10. Dupaigne B. Afghan Genetic Mysteries. Hum Biol. 2011;83(6):735–746. doi:10.3378/027.083.0605
11. Karita E, Ketter N, Price MA, et al. CLSI-derived hematology and biochemistry reference intervals for healthy adults in Eastern and Southern Africa. PLoS One. 2009;4(2):e4401. doi:10.1371/journal.pone.0004401
12. Lugada ES, Mermin J, Kaharuza F, et al. Population-based hematologic and immunologic reference values for a Healthy Ugandan Population. Clin Vaccin Immunol. 2004;11(1):29–34. doi:10.1128/CDLI.11.1.29-34.2004
13. Zeh C, Amornkul PN, Inzaule S, et al. Population-based biochemistry, immunologic and hematological reference values for adolescents and Young Adults in a Rural Population in Western Kenya. PLoS One. 2011;6(6):e21040. doi:10.1371/journal.pone.0021040
 © 2024 The Author(s). This work is published and licensed by Dove Medical Press Limited. The full terms of this license are available at https://www.dovepress.com/terms.php and incorporate the Creative Commons Attribution - Non Commercial (unported, v3.0) License.
By accessing the work you hereby accept the Terms. Non-commercial uses of the work are permitted without any further permission from Dove Medical Press Limited, provided the work is properly attributed. For permission for commercial use of this work, please see paragraphs 4.2 and 5 of our Terms.
© 2024 The Author(s). This work is published and licensed by Dove Medical Press Limited. The full terms of this license are available at https://www.dovepress.com/terms.php and incorporate the Creative Commons Attribution - Non Commercial (unported, v3.0) License.
By accessing the work you hereby accept the Terms. Non-commercial uses of the work are permitted without any further permission from Dove Medical Press Limited, provided the work is properly attributed. For permission for commercial use of this work, please see paragraphs 4.2 and 5 of our Terms.