")
Back to Archived Journals » Research and Reports in Forensic Medical Science » Volume 11
Exploration of Rhythmic Patterns of Gene Expression to Estimate the Time of Day a Bloodstain Was Created
Received 3 July 2021
Accepted for publication 31 October 2021
Published 17 November 2021 Volume 2021:11 Pages 1—11
DOI https://doi.org/10.2147/RRFMS.S327044
Checked for plagiarism Yes
Review by Single anonymous peer review
Peer reviewer comments 2
Editor who approved publication: Professor Henrik Druid
Dianne Kirk,1 Robert Allen2
1Schools of Biomedical Sciences, Oklahoma State University CHS, Tulsa, OK, USA; 2Forensic Sciences, Oklahoma State University CHS, Tulsa, OK, USA
Correspondence: Robert Allen Email [email protected]
Introduction: Interest in the analysis of RNA in forensically relevant body fluid stains has increased in recent years and we have shown that a correlation exists between the state of degradation of mRNA transcripts in dried stains and their age. In addition to estimating the age of a forensic sample, instances exist in which being able to estimate the time of day a biological sample was deposited at a crime scene would advance the investigation.
Methods: In this study, a panel of 10 RNA transcripts, suspected to fluctuate in abundance during a daily circadian rhythm, were quantified by qPCR in blood stains collected from unrelated donors over a 24-hour period. The abundance of a transcript in the circadian marker panel was normalized against the abundance of either S100A12 or CLOCK transcripts expressed among blood cell populations. These studies aimed to detect and explore patterns of abundance changes in transcripts during a 24-hour daily cycle. The reference pattern could then be matched against the pattern of transcript abundance produced from a crime scene bloodstain in an attempt to estimate the time of day the stain was deposited.
Results: Transcript abundance did not vary significantly in blood stains prepared from donors collected repeatedly at the same time of day on different days. Likewise, the age of the donor did not seem to significantly affect the transcript profile in stains collected at one time of day. Of 10 transcripts in the panel evaluated, PER3 in females showed a statistically significant change in abundance over a 24-hour cycle if qPCR results were normalized against the CLOCK transcript and changes in transcript abundance suggested a rhythmic pattern. Although some patterns of transcript abundance suggested a rhythmic pattern, they did not achieve statistical significance using repeated measures ANOVA, likely due to the variance in gene expression among individuals over a 24-hour period.
Discussion: The change in PER3 abundance in females suggests that the expression of this gene follows a circadian rhythm. The pattern of PER3 expression could allow a blood stain deposited by a female during the afternoon to be distinguished from one deposited in the early morning based upon these qPCR results. The results also underscore the importance of normalizing qPCR data against the appropriate target. Analysis of the transcriptome in blood stains from males and females through RNA sequencing may allow other gene transcripts to be identified that cycle in abundance in a way comparable to PER3 in blood from females.
Keywords: circadian rhythm, bloodstains, biological clock, RNA analysis, crime scene investigation
Introduction
In recent years, the value of molecular analysis of RNA recovered from biological evidence collected from a crime scene has been suggested.2,3 It has been reported that the analysis of RNA in evidence can reveal the tissue source of a sample.3–11 In addition, the state of RNA degradation within biological evidence can provide an estimate of sample age, a question sometimes important for establishing the relevance of evidence to the crime being investigated.12–17 The typical approach in such studies is to extract total RNA from a sample and reverse transcribe it into a library of cDNA molecules, representative of the transcriptome, that are more stable for storage and subsequent analysis.4–6 Individual transcripts of interest within the cDNA library are then analyzed, usually by quantifying their abundance using PCR/capillary electrophoresis or qPCR.3,4,6,13
One common approach involving qPCR is to quantify the transcript of interest and to normalize that quantity against the quantity of a second RNA whose abundance is unchanging (such as rRNA or a housekeeping transcript).4,6–11 Normalizing qPCR reactions in this way reduces variance among individual reaction results and allows changes in abundance for the transcript of interest to be identified and quantified. Peripheral blood consists of several unrelated populations of cells. If one is trying to detect changes in the abundance of a particular transcript, it is crucial to use a normalizing transcript that is expressed by the same cell population. In other words, the abundance of a transcript expressed in macrophages would be best normalized against a transcript also expressed in macrophages.
The degradation state of RNA in body fluid stains has also been suggested to correlate with sample age and qPCR has been used to follow the degradation process. For example, Fu and Allen1 used the degradation of RNA transcripts in bloodstains as an indicator of sample age. It was possible using their approach to estimate the age of dried bloodstains with a window of accuracy of 2–4 weeks for stains aged up to 6 months and 4–6 weeks for stains aged up to one year.1 Beyond estimating the age of biological evidence recovered from a crime scene, it might also be important to know when during the day biological evidence was deposited.
The circadian rhythm consists of repeated patterns of biochemical change and behavior over a defined period of time. Biologic rhythms have been observed in microorganisms, plants, and animals, some species sharing orthologous control genes.18 Included in the circadian rhythm are changes in gene expression that alter the body’s metabolism in response to the light or feeding cycles, and the question arises as to whether it might be possible to exploit these rhythmic changes during the day to estimate the time of day biological evidence was deposited at a crime scene.
The feasibility of using rhythmic gene expression as a forensic tool would depend on the pattern of gene expression “freezing in place” immediately or shortly after an evidentiary sample is deposited at a crime scene. Although this question has not been studied extensively, Kimura et al19 quantified the expression of several genes associated with the circadian rhythm in murine tissues. RNA was extracted from heart, liver, and brain immediately following sacrifice and up to 48 hours after death. Results demonstrated that the abundance of mRNAs transcribed from core circadian rhythm genes did not change after death.19 Likewise, Lech et al20,21 implied that when a bloodstain is created at a crime scene, the levels of RNA transcripts in the dried stain are reflective of gene expression at the time the stain was created.
Most studies on circadian changes in gene expression have studied mRNA abundance levels in tissues of largely homogeneous cell type.19 Blood, while considered a “tissue” is in fact a mixture of numerous hematopoietic cell types and therefore circadian patterns of gene expression are more difficult to define. Such patterns undoubtedly exist inasmuch as some of the white cell populations in blood exhibit a daily cycling in numbers or immune status.
As the circadian rhythm proceeds during the day, mRNAs will appear as a result of transcription and likely disappear through RNA degradation. Quantifying transcripts whose abundance cycles during the day affords one possible approach to estimate the time of day a stain was created. In 2014 Lech et al20 analyzed blood stains for microRNA (miRNA) degradation rates and tried to correlate rate changes with the deposition time for the stain. In this study, no correlation of miRNA degradation with the circadian rhythm was identified.20 However, in a later study, Lech et al21 did suggest that rhythmic patterns of gene expression identified in dried blood stains could indicate when the stain was created if RNA levels were analyzed together with levels of melatonin and cortisol.21 Unfortunately, this approach is not an option in a forensic blood stain.
There are several transcription factors that drive and maintain the rhythmicity of gene expression within the circadian rhythm. Brain and Muscle ARNT-Like 1 (BMAL1) and Circadian Locomotor Output Cycles Kaput (CLOCK) proteins act as the central conductors of the circadian rhythm. BMAL1 and CLOCK proteins heterodimerize and bind to E-box activation sites on many genes that participate in circadian rhythm and initiate transcription.22 Two families of genes in particular, PER and CRY, are activated by the BMAL1/CLOCK heterodimer. The polypeptides encoded by the PER and CRY families of genes also associate into a heterodimer that feeds back negatively by disrupting the BMAL1/CLOCK heterodimer, thereby down regulating transcription.23–25
The core clock genes (BMAL1, CLOCK, PER1-3, CRY1-2) represent the first level of control in the circadian rhythm. CLOCK and BMAL1 genes are activated in the morning followed later by activation of PER1-3 and CRY1-2 genes whose products disrupt the BMAL1/CLOCK heterodimer and thereby downregulate their transcription. These genes therefore follow regular daily patterns of expression, with CLOCK and BMAL1 exhibiting peak levels of expression in the morning that slowly diminishes throughout the day.26
In the study presented here, the expression of a collection of genes that are reportedly associated with the circadian rhythm in various tissues was studied.22–25 These transcripts were quantified as a panel of markers in dried bloodstains collected over a 24-hour period. Stains were created from a cohort of volunteer blood donors composed of males and females of varying ages. The broadly defined daily activities and sleep patterns of the donors were recorded and were similar but not identical. Quantitation of individual mRNA transcripts extracted from the dried stains was performed using qPCR and abundance data were normalized against one of two transcripts (CLOCK or S100A12).
Whereas most of the circadian markers studied did not show a discernable rhythmic pattern of abundance over a 24-hour period, PER3 transcript abundance did exhibit a significant difference in abundance for blood stains created in the morning versus stains created with samples collected in late afternoon or evening.
Materials and Methods
Collection of Blood Samples and Preparation of Blood Spots
This study was conducted in compliance with the Declaration of Helsinki and all capillary and venous blood samples were collected from volunteers who consented in compliance with the IRB oversight of this project. The project was approved by the Oklahoma State University-CHS IRB (IRB approval #2018010, April 24, 2018) before blood donors were recruited. Capillary blood was collected by finger stick from 47 volunteers. The transcript abundance data produced from the bloodstains was grouped in various ways to address the research questions being asked. For example, for studies on the variance in transcript abundance in stains collected on different days from a single donor, quantity data for circadian transcripts in bloodstains from 8 donors were compared (samples collected at ~1 pm Central Standard Time (CST) on 3 or 4 different days spread over 2–3 weeks). For studies on the effect of donor age or donor sex on gene expression, transcript abundance was determined in stains from a total of 40 donors collected at 1 pm CST. Finally, for studies on the changes in gene expression during a 24-hour cycle, 13 donors (7 females and 6 males) volunteered to collect finger stick samples every 4 hours over a 24-hour period.
Capillary blood samples were collected by finger stick using SurgiLance™ 2.8 mm 21-gauge safety lancets (MediPurpose™, Duluth, GA). Capillary samples were spotted in circles of minimum 20 mm diameter onto nuclease-free 705™ Classic Specimen Cards (Fitzco®, Spring Park, MN). For some experiments, larger volumes of blood were needed and phlebotomy was performed to collect ~10 mL of anticoagulant free blood that was spotted immediately onto the specimen cards and dried. Specimen cards were stored in the dark at room temperature in the laboratory while awaiting processing.
Donors were chosen based upon age and sex, and all completed a basic questionnaire asking about daily habits and sleep patterns. The donors could be grouped by age from ages 20–60 for a total of 4 groups (10 members in each 10-year age span). Donors could also be grouped by sex and there were about equal numbers of males and females among the 47 total donors (22 males and 25 females).
RNA Extraction and Quantification
Total RNA was extracted from bloodstains excised from the stored specimen card using TRIzol reagent (Thermo Fisher, Waltham, MA) following instructions from the supplier. Total RNA was recovered from the TRIzol extract using the RNA Clean and Concentration Kit™ (Zymo Research, Irvine, CA) following instructions from the manufacturer. Recovered nucleic acids were eluted in 15 μL of DNase/RNase-free water. RNA extracts underwent DNase digestion using the Invitrogen™ EZ DNase™ System (Invitrogen, Carlsbad, CA) per the manufacturer’s protocol. The entire RNA extract was treated using the ezDNase™ protocol and then was placed on ice while preparing for immediate reverse transcription.
RNA was quantified with the Qubit RNA HS Assay Kit (Invitrogen, Carlsbad, CA) following instructions supplied with the kit and measured using a Qubit™ Fluorometer 2.0 (Invitrogen, Carlsbad, CA). Quantification of RNA with the HS reagents assures measurement of RNA with minimal interference of double stranded or single stranded DNA. An average of ~300 ng of total RNA was recovered from each bloodstain.
Reverse Transcription of RNA into cDNA
Reverse transcription of RNA extracts was performed with Invitrogen SuperScript IV VILO Master Mix (Invitrogen, Carlsbad, CA) according to the supplier protocol. The kit uses a combination of random and oligo dT primers for reverse transcription catalyzed with a reverse transcriptase engineered to exhibit reduced RNase H activity and high processivity (Thermo Fisher, Waltham, MA). The entire RNA extract (~300 ng) was reverse transcribed. Incubations were performed with an MJ Mini Personal Thermocycler (BioRad, Hercules, CA).
Quantitative PCR (qPCR)
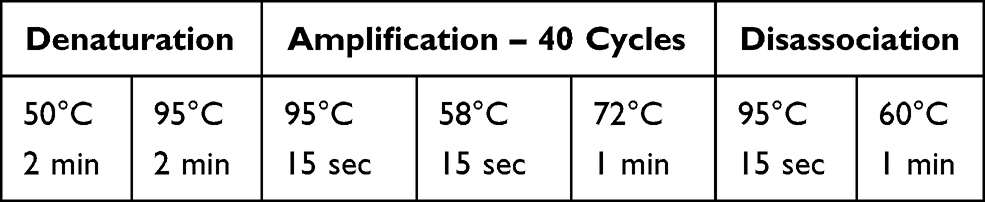
All qPCR reactions were analyzed in MicroAmp®Fast 96-well reaction plates (0.1 mL) (Life Technologies, Carlsbad, CA). Each reaction consisted of ~10 ng of cDNA in 4 µL nuclease free water containing 0.8 µM (final concentration) qPCR primers. Five microliters of PowerUp™SYBR™Green Master Mix (Life Technologies, Carlsbad, CA) was added to the reaction for a 10 µL final reaction volume. All reactions were performed in triplicate. Results were produced with a 7500 Real Time PCR System platform (Life Technologies, Carlsbad, CA) using the cycling program shown below:
 |
|
Design of qPCR Primers
The synthesis of qPCR primers to quantify transcripts from rhythmically expressed genes generally followed primer designs published by others.20,27–33 Genes in the marker panel and the primers used to amplify their transcripts are listed in Table 1.
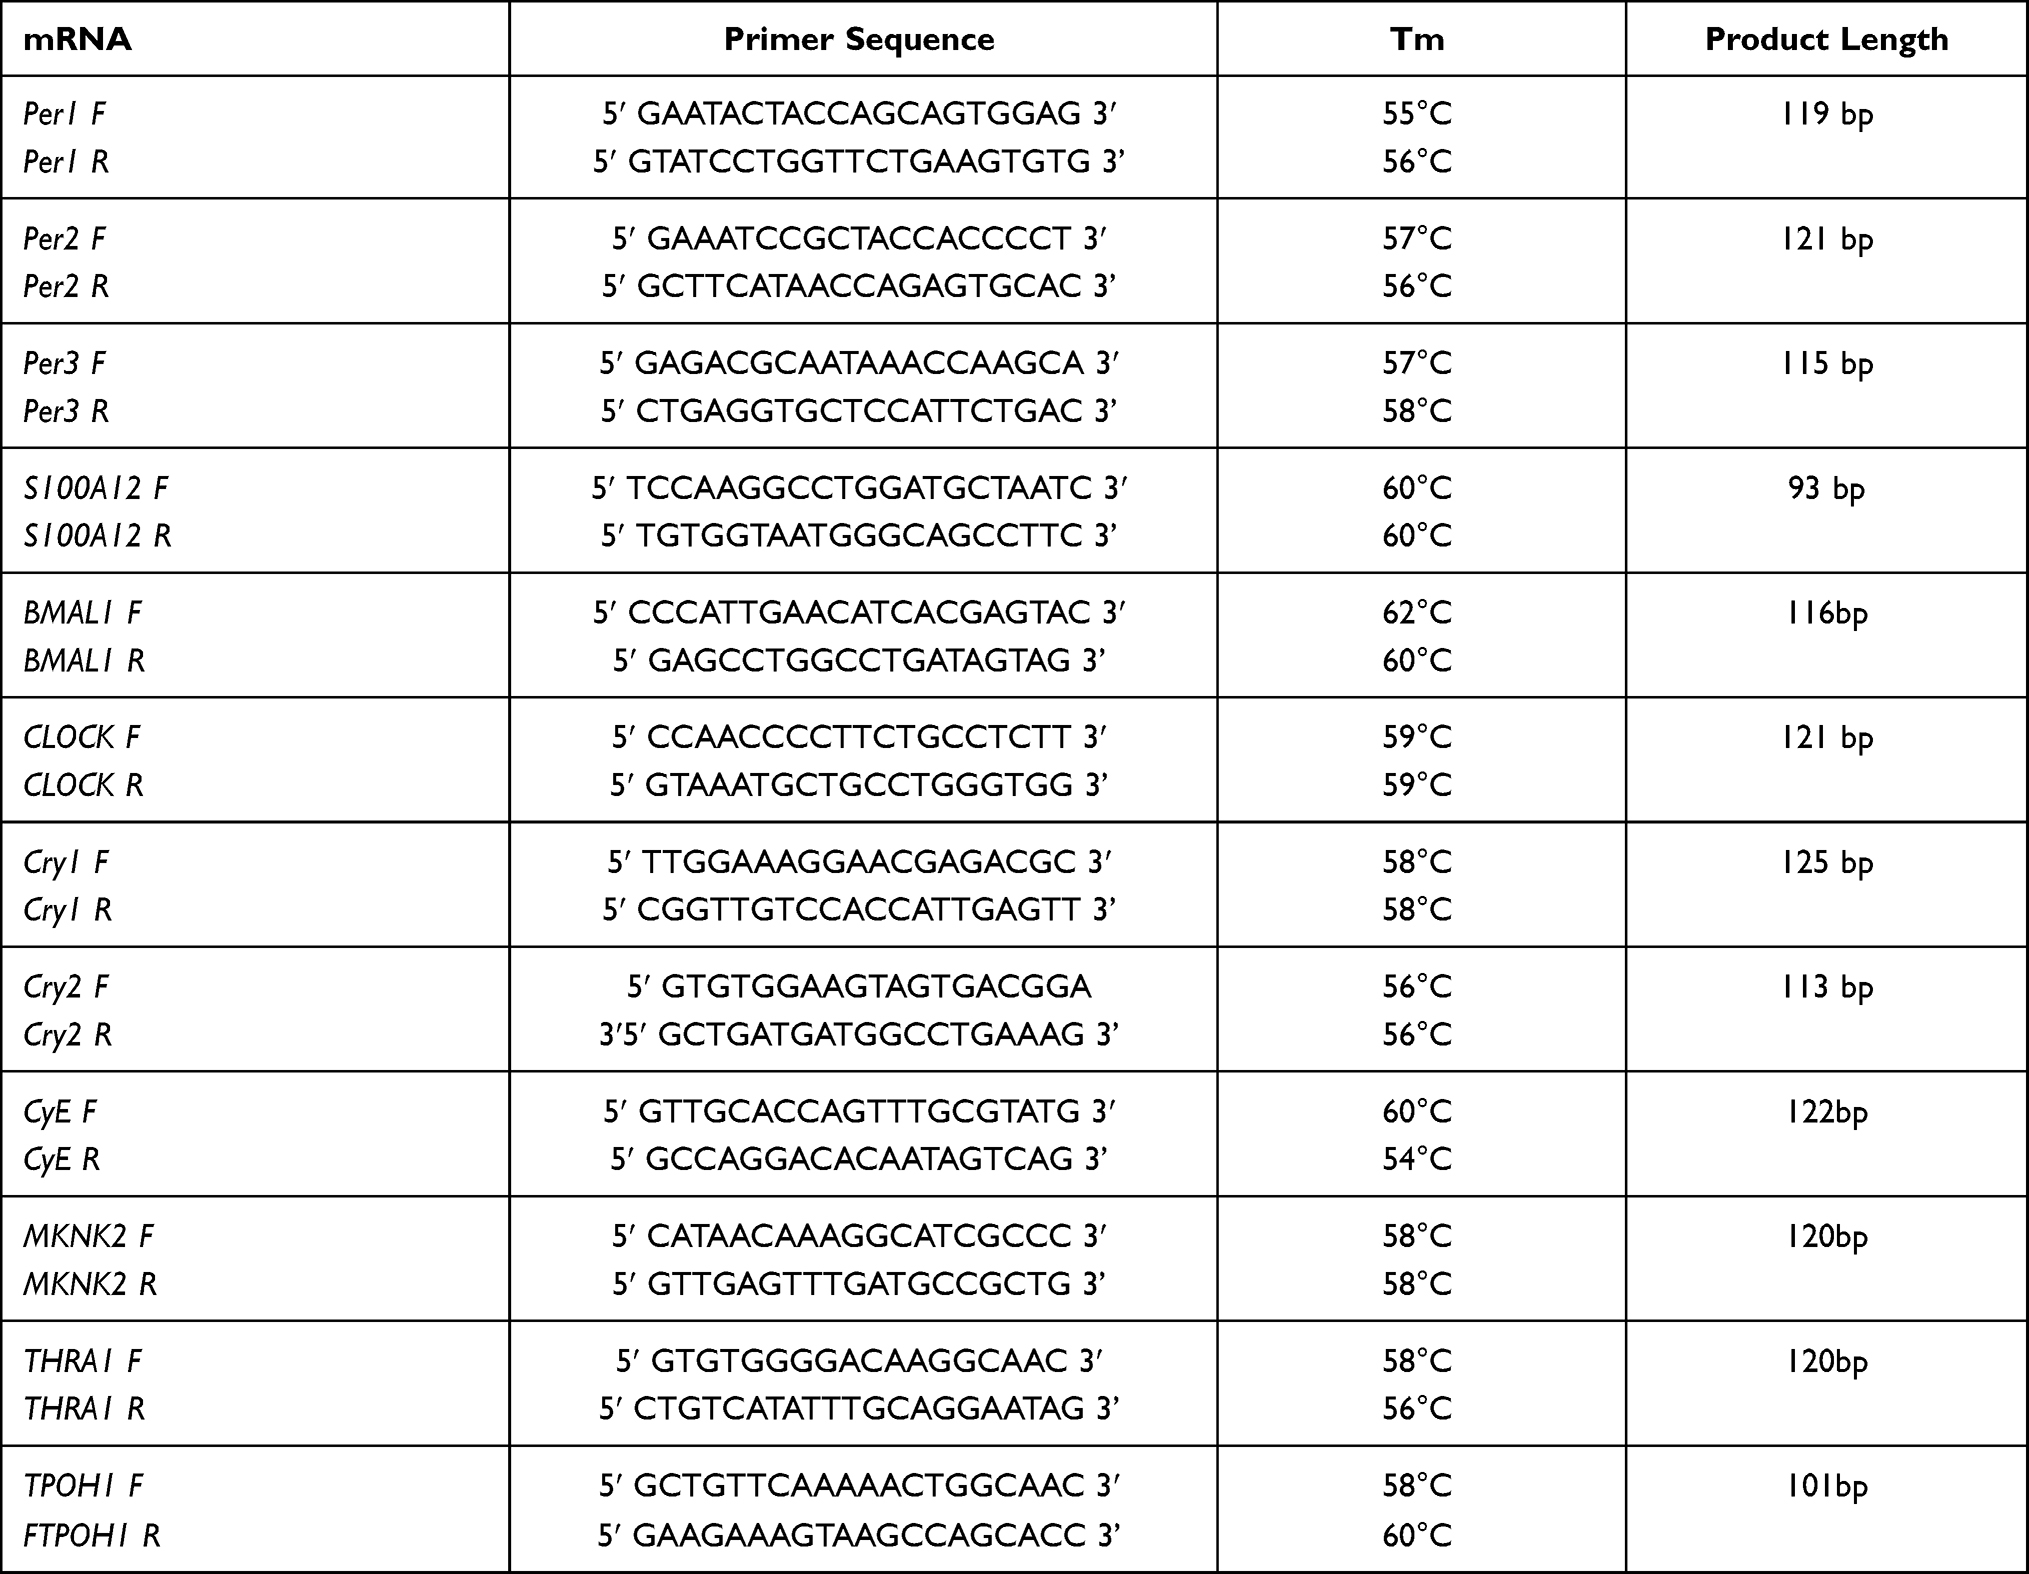 |
Table 1 qPCR Primers to Quantify Expression of Genes During the Circadian Rhythm |
The abundance of the transcript from the S100A12 gene was included in the study as one of two normalization standards used to quantify abundance levels from mRNA markers in the circadian panel. Previous work from this laboratory has shown the abundance of S100A12 transcript to be stable in dried bloodstains stored at room temperature for periods of up to one week.1 The abundance of the S100A12 mRNA in dried bloodstains produced quantification cycle (Cq) values in the 18 to 20-range whereas the markers constituting the circadian panel exhibited Cq values ranging from 27 to 32, depending upon the marker. S100A12 is primarily expressed in neutrophils.34
Transcript abundance for markers in the circadian panel were also normalized against the abundance of the CLOCK transcript. The CLOCK transcript is present in blood in lower amounts than S100A12 and expression of this gene is largely confined to the lymphoid cell population. CLOCK was included in the panel for its central role in regulating the circadian rhythm in many tissues. Cq values for CLOCK averaged 27.2.
All primers were designed with a G/C content of ~50% and primer specificity to the transcript of interest was confirmed using BLAST software available on the National Center for Biotechnology Information (NCBI) site (https://blast.ncbi.nlm.nih.gov/Blast.cgi). Melting curves for amplicons produced with each primer set during qPCR verified that only one amplified product was produced. Efficiency tests for primers showed that all pairs amplified with comparable and acceptable efficiency.
Data Analysis
Default settings for the ABI7500 qPCR platform were used to establish cycle threshold (Cq) values. Each qPCR reaction was performed in triplicate (technical replicates) for transcripts extracted from bloodstains from each donor. The Cq values produced for each marker were normalized against the abundance of the S100A12 transcript. Cq values for each marker (quantified in triplicate) were also normalized against the abundance of the CLOCK transcript. The normalized values (i.e., ΔCq) was calculated by subtracting the Cq for either the S100A12 or the CLOCK transcript from the Cq produced for the transcripts composing the circadian marker panel. Normalized and averaged ΔCq values for the stain from each donor were then averaged with the normalized ΔCq values for other donors in the pool (i.e., biological replicates). The extent of variability in ΔCq values for each collection time point during the day is shown as standard error (SE), coincidence of variation (CV), or as standard error bars in the data plots. Assessing the significance of results involved an analysis of variance (one way ANOVA) for repeated measures with a post hoc Tukey’s test that was performed using Prism 8™ GraphPad (GraphPad Software, San Diego, CA).
Results
The rationale for this study was rooted in the belief that it would be possible to estimate the time of day a bloodstain was deposited at a crime scene if a rhythmic pattern of gene expression could be defined and used as a reference framework for comparison against the transcript abundance pattern produced from a crime scene sample. The abundance pattern produced from an evidentiary stain could be matched against the reference pattern and allow the time of day the evidence was deposited to be estimated.
There are many factors that can affect the timing of the circadian rhythm among members of the population. There can also be variation in gene expression between individuals due to age-related changes in gene expression, or sex-linked differences.35,36
Variability can exist in the inherent levels of gene expression in a single individual on different days. The day-to-day variance in the levels of gene expression in a single individual and among members of the population was analyzed by quantifying panel transcripts in stains prepared using blood collected at the same time on multiple days from 8 donors. Transcripts in the marker panel were quantified as well as the S100A12 or CLOCK transcripts for data normalization, and the variance in ΔCq values is expressed as the coincidence of variation (CV) (Table 2).
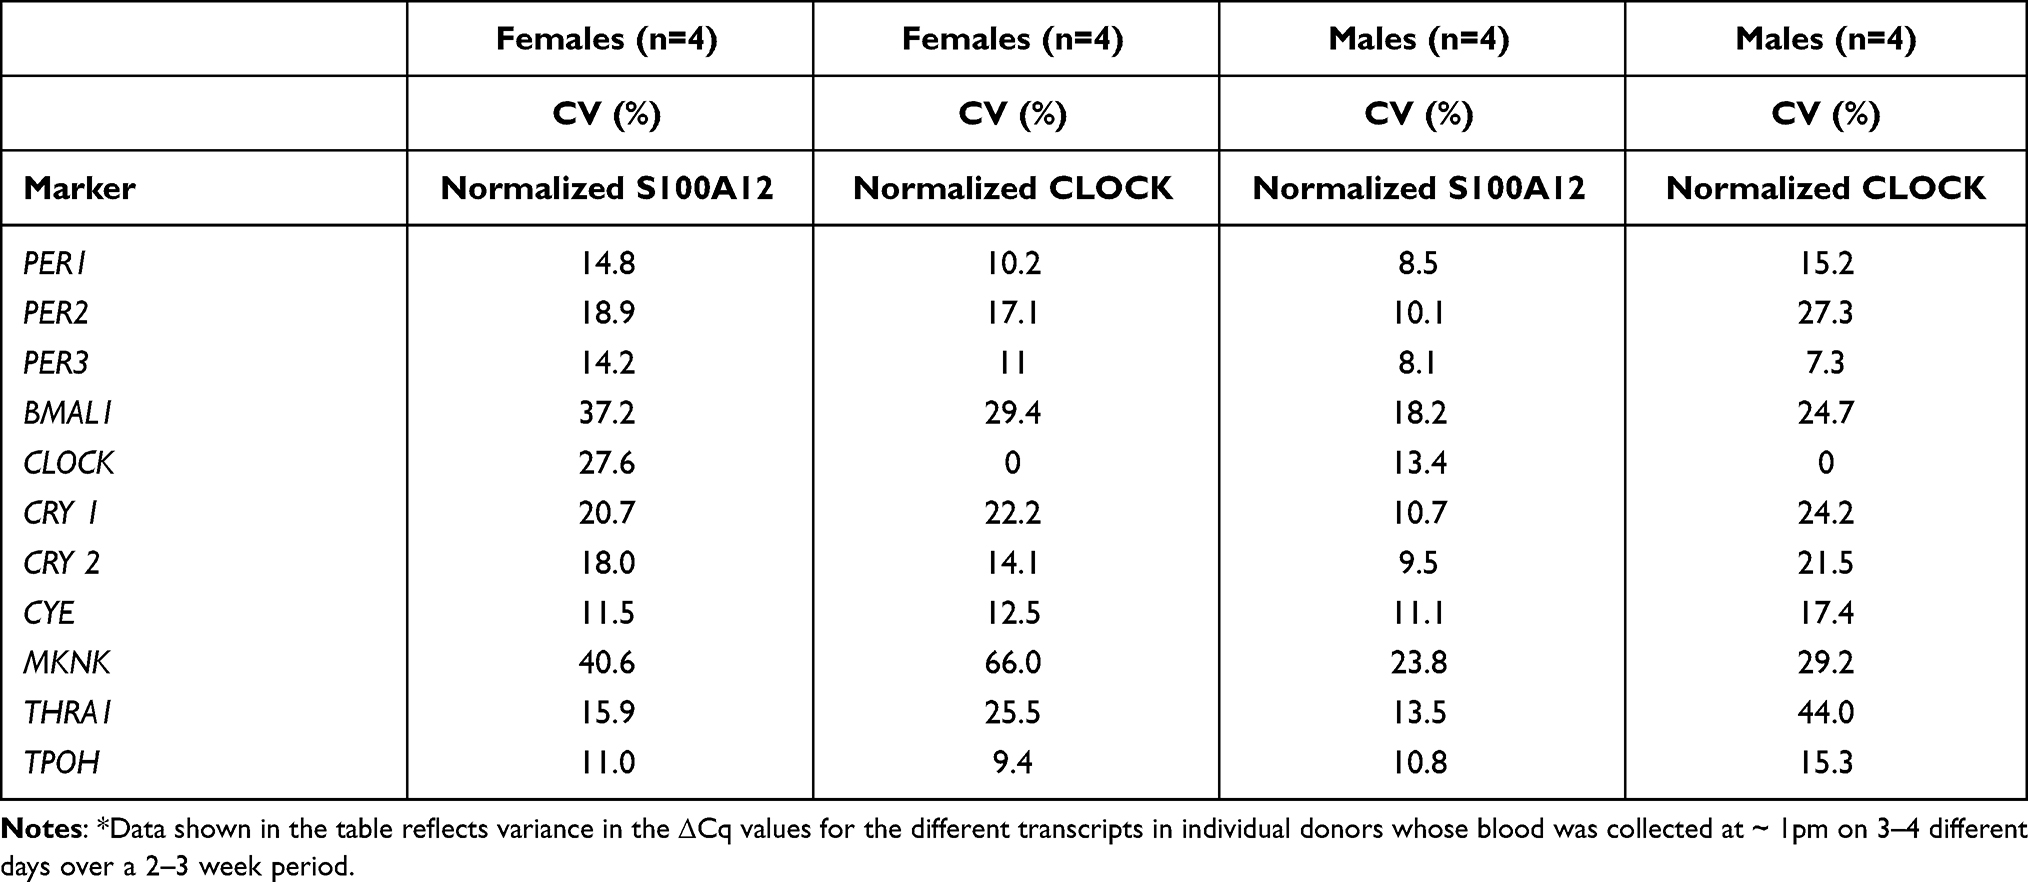 |
Table 2 Variation in Transcript Abundance Levels in Bloodstains Collected from a Single Individual at the Same Time on Different Days* |
There can also be variation in gene expression between individuals due to age-related changes in gene expression, or sex-linked differences.35,36 ΔCq values, produced through normalization against S100A12 or CLOCK, were grouped according to the age range of the donor. ΔCq values were grouped among donors in one of four age categories (20–29, 30–39, 40–49, and 50–59). Again, stains were created from blood samples collected at about ~1 pm CST. When considered as a total population (i.e., males and females of all ages), the abundance of most mRNAs did not differ significantly when compared with data exhibited by each individual age group as shown in Figures 1 and 2, regardless of whether panel transcripts were normalized against S100A12 (Figure 1) or CLOCK (Figure 2). The spread of datapoints reflects the variance in expression among the individuals and the lack of a systematic order in the datapoint colors from the highest to lowest ΔCq values underscores the lack of any correlation in transcript abundance between male and female donors of the different age groups. Expression of most markers (at least at the single time point chosen to create the stain) did not differ significantly among the donors grouped by age.
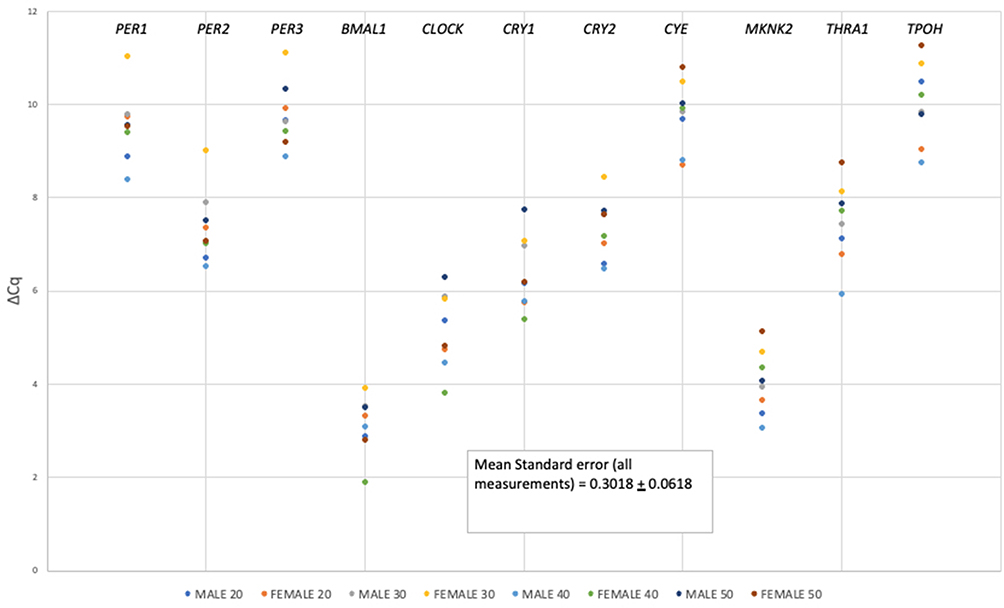 |
Figure 1 Mean abundance values (expressed as (ΔCq)) for circadian panel transcript markers (labeled atop each row of datapoints in the figure) for each age group of males and females normalized against S100A12 transcript. |
An examination of data normalized against CLOCK (Figure 2) shows greater variance in replicates and generally lower ΔCq values, consistent with lower basal abundance of the CLOCK marker in the transcriptome (i.e., Cq of ~ 27 for CLOCK versus ~20 for S100A12).
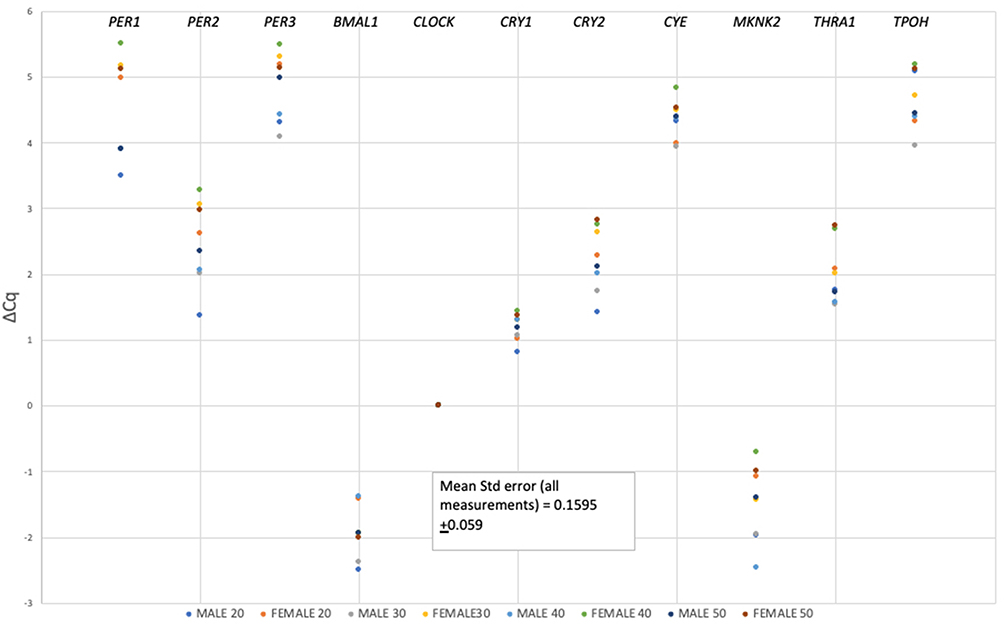 |
Figure 2 Mean abundance values (expressed as (ΔCq)) for circadian panel transcript markers (labeled atop each row of datapoints in the figure) for each age group of males and females normalized against CLOCK transcript. |
Transcripts such as PER1, 2, 3, CRY2, and MKNK2 exhibited differences in abundance between males and females when expression was normalized against CLOCK, and statistical analysis of the data revealed the sex-linked differences in the ΔCq values to be significant (Table 3). In contrast, these significant differences disappear when transcript abundances for panel markers are normalized against S100A12. From the results shown in Table 3, we can conclude that the transcript used to normalize qPCR data can have a significant effect on revealing potentially informative patterns of gene expression in dried bloodstains. For a study in which the goal is to quantify the effect of a condition on gene expression (i.e., an accurate fold-change determination in RNA abundance for example), the use of a gene whose expression is steady for normalization is ideal if not mandatory. However, if the goal is simply to identify a pattern of relative gene expression that changes during the daily cycle, normalization to a transcript like S100A12 fails to reveal useful pattern for time of day estimates in practice, at least with our collection of stains created at 1 pm CST.
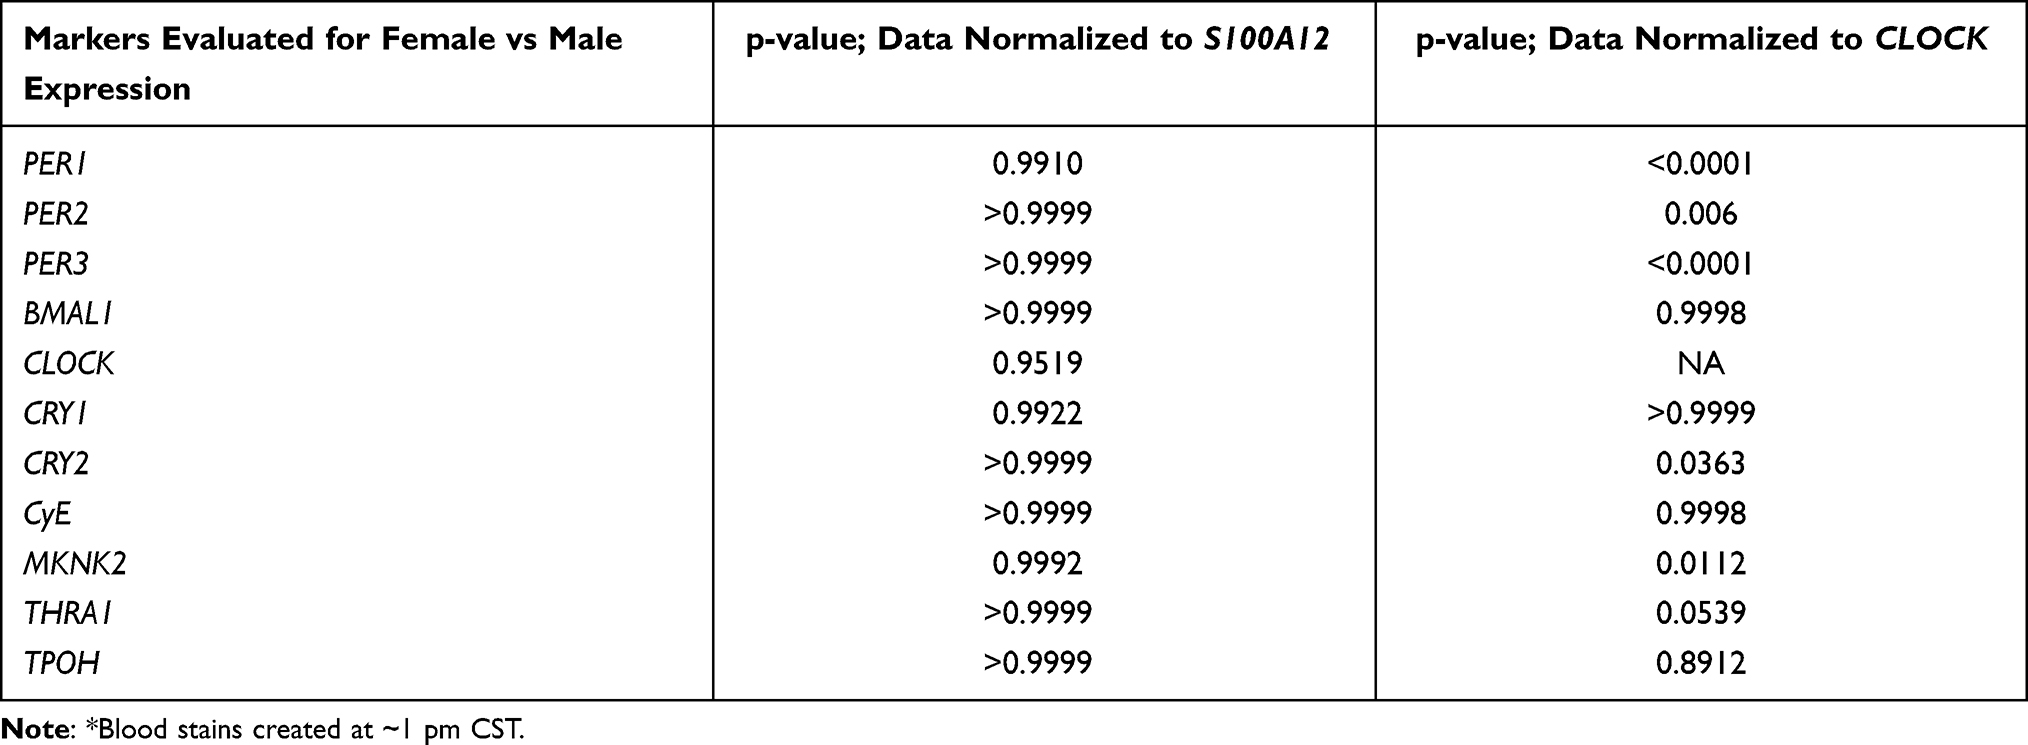 |
Table 3 Relative Expression of Circadian Rhythm Genes in Blood Stains from Males versus Females with Δcq Values Produced Using S100A12 or CLOCK* |
The analysis of transcript abundance values produced from stains collected at 4-hour intervals throughout the day was performed in the same way as data collected from stains produced at 1 pm CST. ΔCq values reflecting relative transcript abundance for genes in the marker panel were produced through normalization against either S100A12 or CLOCK. Sample transcript abundance plots are shown in Figures 3 and 4. Plots are shown for females and males for the PER3 marker normalized against CLOCK. PER3 abundance in females shifts from low ΔCq values in the early morning to significantly higher values in the afternoon and evening (p < 0.05) (Figure 3). In contrast, PER3 abundance varies so much among the male donor pool over the day that no transcript abundance changes such as those seen in females can be detected (Figure 4). This was the case for the abundance profiles in males and females for most panel transcripts in this study (not shown). In addition, none of the transcripts exhibited a change in relative abundance when data was normalized against S100A12. Interestingly, the change in abundance for PER3 in females disappears if data for males and females are combined and normalized against CLOCK (not shown).
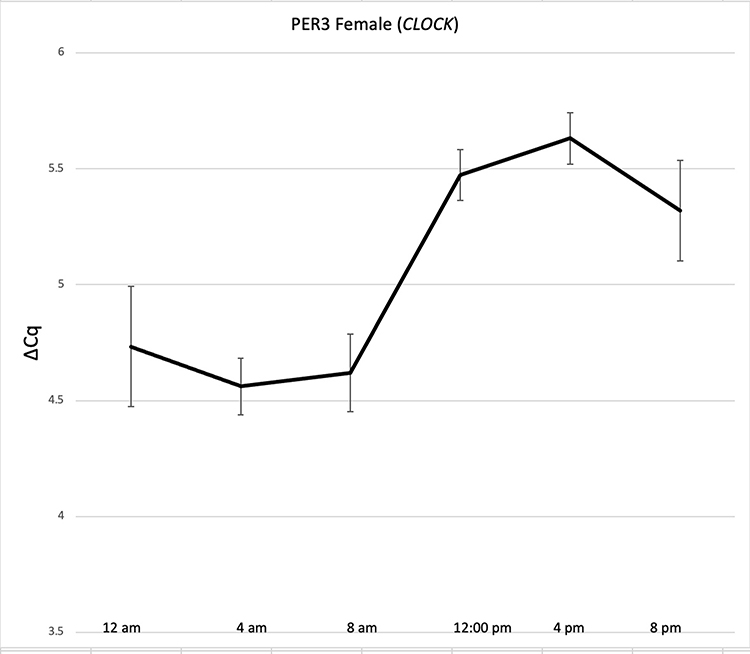 |
Figure 3 24-hour expression of PER3 (normalized to CLOCK) in blood stains collected from females every 4 hours for 24 hours. Standard error bars indicate the variance in normalized ΔCq values at sample collection times during a 24-hour period. |
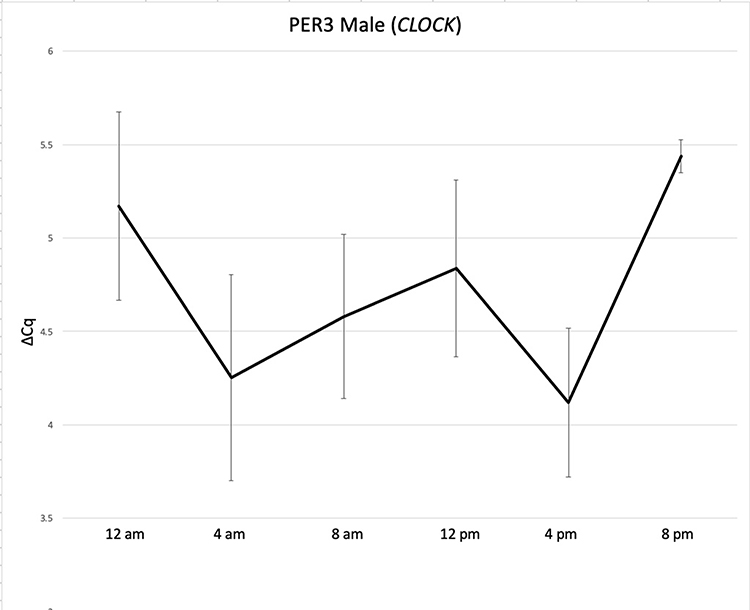 |
Figure 4 24-hour expression of PER3 (normalized to CLOCK) in blood stains collected from males every 4 hours for 24 hours. Standard error bars indicate the variance in normalized ΔCq values at sample collection times during a 24-hour period. The higher variance of PER3 ΔCq values in males obscures any abundance pattern. |
The change in abundance of the PER3 transcript in males came close to significance between morning and afternoon blood collections (p = 0.07). Expansion in the number of blood stain donors willing to collect samples every 4 hours could reveal a cyclic pattern of PER3 gene expression in males.
Discussion
The circadian rhythm is characterized by patterns of gene expression resulting in changing abundance levels for select transcripts. The goal of this study was to detect rhythmic changes in the abundance levels of a panel of mRNAs using qPCR. Several studies have quantified circadian rhythm changes in mRNA transcript levels but have failed to detect predictable levels in relation to time.26,31,33
Exploitation of the circadian rhythm as a forensic tool has been attempted and more than one investigator has suggested that RNA levels associated with the cycle should theoretically have the capacity to predict the time of day.19,21 The panel of transcript markers chosen for this study includes genes that have been identified as changing in expression during the daily cycle in some tissues.21,23,24 One might raise as a concern with this study due to the fact that the specifics of the daily lives of our blood donor pool were largely unknown beyond asking general questions about sleep and meals. The fact that we do not collect detailed information about the daily lives of our blood donors enhances the potential for studies like these to reveal markers that will demonstrate cycling changes in the abundance of select RNA transcripts in spite of likely differences in the details of daily lives.
Transcripts like PER3 in exhibit a rhythm among female donors in spite of likely differences in the details of their daily lives. One complication in our study is the heterogeneous nature of blood as a source of RNA. Cell lineages from all hematopoietic progenitors are present in a dried bloodstain and the numbers of cells from some lineages are known to cycle daily. Cell populations will also change in response to infectious threats.
In order to identify and characterize changes in the relative abundance of particular mRNAs during the daily cycle, it was important to establish the extent to which the expression of targeted genes fluctuates within an individual on different days. Results suggest that many of the transcripts examined in blood stains created at one time during the day, but on different days, exhibit a variance in transcript abundance of ≤~20%. Contributing to the variance in gene expression are the limitations in the precision of the qPCR assay. The standard error in ΔCq values produced for all markers among technical replicates was about 0.14 which would correspond to a “technical” variance of about 5% (unpublished observation). Changes in transcript levels would need to exceed this technical variance to detect rhythmic changes in abundance.
Transcript abundance in our bloodstain panel was also analyzed according to the sex and/or age of the donor. No significant age-related difference in the abundance of most RNA transcripts in the panel was detected in the study, regardless of which transcript, S100A12 or CLOCK, was used for data normalization.
An analysis of transcript abundance levels in stains created at 1 pm CST identified some transcript markers that varied little among the combined or separated sexes at any age as long as the data were normalized against S100A12. However, normalization of the same transcript abundance data against CLOCK did identify mRNAs whose abundance level varied widely among males and females, regardless of age. Five genes in particular (PER1, 2, and 3, CRY2, and MKNK2) showed significant transcript quantity differences between male and female blood stains collected at the 1 pm CST when data is normalized against CLOCK (Table 3).
The variance among replicate ΔCq values for PER3 mRNA in females at each point in the 24-hour collection period was low and that uniformity allowed a rhythmic profile of RNA abundance to be revealed when results are normalized against CLOCK. The relative abundance of these transcripts differed significantly in stains collected from 12 am until 8 am versus counterparts collected during the remainder of the 24 hour cycle. While at first glance it might appear that normalization of Cq data against the CLOCK transcript should be avoided, in fact normalization against CLOCK revealed the changing pattern for the PER3 marker. It is possible that both the CLOCK and PER3 transcripts change subtly in abundance during the cycle. When examined individually, the abundance levels of CLOCK and PER3 do not change sufficiently to reveal a pattern. But subtle changes in transcript abundance moving in opposite directions are detectable using qPCR. Thus, sensitivity to detect changes in transcript abundance during the daily cycle is enhanced by normalizing to a marker that also cycles. Analysis of a panel of markers like PER3, CLOCK, and others that likely exist could create a patchwork pattern at any particular time point with which the pattern from biological evidence could be compared to estimate time of deposition.
When one considers the possible application of transcriptome analysis in the forensic lab, it is clear that much more investigation is needed to identify other transcript markers that show rhythmic changes in abundance in blood. RNA sequencing of bloodstains collected during the daily cycle could identify additional candidate transcript markers more informative for blood. Additional cycling transcripts should increase the accuracy of time estimates. Our study does demonstrate the feasibility of using RNA analysis if accounting for sex and normalizing with an appropriate transcript. Because of the nature of multiplexing, one could envision a qPCR assay developed for application in the forensic laboratory that not only quantifies the amount of human DNA present in the sample but also quantifies a small panel of RNA transcripts that define when during the day the stain was created.
Disclosure
Dianne Kirk reports that this work was performed in partial fulfillment of the requirements for the PhD degree. Dr Robert Allen reports a patent Estimation of the age of body fluid stains using RNA degradation and a novel qPCR approach pending to Robert Allen and Oklahoma State University. The authors report no other conflicts of interest in this work.
References
1. Counsil T, McKillip JL. Forensic blood evidence analysis using RNA targets and novel molecular tools. Biologia. 2010;65(2):175–182. doi:10.2478/s11756-010-0001-2
2. Lindenbergh A, Maaskant P, Sijen T. Implementation of RNA profiling in forensic casework. For Sci Int Genet. 2013;7:159–166.
3. Juusola J, Ballentyne J. mRNA profiling for body fluid identification by multiplex quantitative RT-PCR. J For Sci. 2007;52:1252–1262. doi:10.1111/j.1556-4029.2007.00550.x.
4. Bauer M, Patzelt D. Protamine mRNA molecular marker for spermatozoa in semen stains. Int J Leg Med. 2003;117:175–179. doi:10.1016/j.fsigen.2011.09.007OI:
5. Haas C, Klesser B, Maake C, War W, Kratzer A. mRNA profiling for body fluid identification by reverse transcription endpoint PCR and realtime PCR. For Sci Int Genet. 2009;3:80–88. doi:10.1016/j.fsigen.2008.11.003
6. Zubakov D, Kokshoom M, Kloosterman A, Kayser M. New markers for old stains: stable mRNA markers for blood and saliva identification from up to 16 year old stains. Int J Leg Med. 2009;123:71–74. doi:10.1007/s00414-008-0249-z
7. Visser M, Zubakov D, Ballantyne K, Kayser M. mRNA-based skin identification for forensic applications. Int J Leg Med. 2011;125:253–263. doi:10.1007/s00414-010-0545-2
8. Roeder AD, Haas C. mRNA profiling using a minimum of 5 mRNA markers per body fluid and a novel scoring method for body fluid identification. Int J Leg Med. 2013;127:707–721. doi:10.1007/s00414-012-0794-3
9. Lindenbergh A, de Pagter M, Ramdayal G, et al. A multiplex (m)RNA-profiling system for the forensic identification of body fluids and contact traces. For Sci Int Genet. 2012;6:565–577. doi:10.1016/j.fsigen.2012.01.009
10. Richard MII, Harper KA, Craig RL, Onorato AJ, Robertson JM, Donfack J. Evaluation of mRNA marker specificity for the identification of five human body fluids by capillary electrophoresis. For Sci Int Genet. 2012;6:452–460.
11. Cordula H, Neubauer J, Salzmann AP, Hanson E, Ballantyne J. Forensic transcriptome analysis using massively parallel sequencing. For Sci Int Genet. 2021;52:102486. doi:10.1016/j.fsigen.2021.102486
12. Fu J, Allen RW. A method to estimate the age of bloodstains using quantitative PCR. For Sci Int Genet. 2019;39:103–108. doi:10.1016/j.fsigen.2018.12.004
13. Anderson S, Howard B, Hobbs GR, Bishop CP. A method for determining the age of a bloodstain. For Sci Int. 2005;148:37–45. doi:10.1016/j.forsciint.2004.04.071
14. Anderson S, Hobbs GR, Bishop CP. Multivariate analysis for estimating the age of a bloodstain. J For Sci. 2010;56:186–193. doi:10.1111/j.1556-4029.2010.01551.x
15. Sampaio-Silva F, Magalhaes T, Carvalho F, Dinis-Oliverira RJ, Silvestre R. Profiling of RNA degradation for estimation of post mortem interval. PLOS One. 2013;8:10. doi:10.1371/journalpone.0056507
16. Weinbrecht KD, Fu J, Payton M, Allen RW. Time-dependent loss of mRNA transcripts from forensic samples analyzed using next-generation sequencing. Res Rep For Med Sci. 2017;7:1–12. doi:10.2147/RRFMS.S125782
17. Kohlmeier F, Schneider PM. Successful mRNA profiling of 23 years old blood stains. For Sci Int Genet. 2012;6:274–276. doi:10.1016/j.fsigen.2011.04.007
18. Bjarnason GA, Jordan RCK, Sothern RB. Circadian variation in the expression of cell-cycle proteins in human oral epithelium. Am J Path. 1999;154(2):613–622. doi:10.1016/S0002-9440(10)65306-0
19. Kimura A, Ishida Y, Hayashi T, Nosaka M, Kondo T. Estimating time of death based on the biological clock. Int J Legal Med. 2011;125:385–391. doi:10.1007/s00414-010-0527-4
20. Lech K, Ackermann K, Wollstein A, Revell VL, Skene DJ, Kayser M. Assessing the suitability of miRNA-142-5p and miRNA-541 for bloodstain deposition timing. For Sci Intl Genet. 2014;12:181–184. doi:10.1016/j.fsigen.2014.06.008
21. Lech K, Ackermann K, Revell VL, Lao O, Skene DJ, Kayser M. Dissecting daily and circadian expression rhythms of clock-controlled genes in human blood. J Biol Rhythms. 2015;31:68–81. doi:10.1177/0748730415611761
22. Gekakis N, Staknis D, Nguyen HB, et al. Role of CLOCK protein in the mammalian circadian mechanism. Science. 1998;280:1564–1569. doi:10.1126/science.280.5369.1564
23. Sangoram AM, Saez L, Antoch MP, et al. Mammalian circadian autoregulatory loop: a timeless ortholog and mPer1 interact and negatively regulate CLOCK-BMAL1-Induced transcription. Neuron. 1998;21:1101–1113. doi:10.1016/s0896-6273(00)80627-3
24. Kume K, Zylka MJ, Sriram S, et al. mCRY1 and mCRY2 are essential components of the negative limb of the circadian clock feedback loop. Cell. 1999;98:193–205. doi:10.1016/s0092-8674(00)81014-4
25. Lee C, Etchegaray JP, Cagampang FRA, Loudon ASI, Reppert SM. Posttranslational mechanisms regulate the mammalian circadian clock. Cell. 2001;107:855–867. doi:10.1016/s0092-8674(01)00610-9
26. Takahashi JS. Transcriptional architecture of the mammalian circadian clock. Nat Rev Genet. 2017;18:164–179. doi:10.1038/nrg.2016.150
27. Yang MY, Chang JG, Lin PM, et al. Down regulation of circadian clock genes in chronic myeloid leukemia: alternative methylation pattern of hPER3. Cancer Sci. 2006;97:1298–1307. doi:10.1111/j.1349-7006.2006.00331.x
28. Ebert-Zavos E, Horvat-Gordon M, Taylor A, Bartell PA. Biological clocks in the duodenum and the diurnal regulation of duodenal and plasma serotonin. PLoS One. 2013;8:e58477. doi:10.1371/journal.pone.0058477
29. Masri S, Cervantes M, Sassone-Corsi P. The circadian clock and cell cycle: interconnected biological circuits. Curr Opinion Biol. 2013;25:730–734. doi:10.1016/j.ceb.2013.07.013
30. Champier J, Claustrat B, Besançon R, et al. Evidence for tryptophan hydroxylase and hydroxy-indol-o-methyl-transferase mRNAs in human blood platelets. Life Sci. 1997;60:2191–2197. doi:10.1016/S0024-3205(97)00234-8
31. Kusanagi H, Hida A, Satoh K, et al. Expression profiles of 10 circadian clock genes in human peripheral blood mononuclear cells. Neurosci Res. 2008;61:136–142. doi:10.1016/j.neures.2008.01.012
32. Salani R, Davidson B, Fiegl M, et al. Measurement of cyclin E genomic copy number and strand length in cell-free DNA distinguish malignant versus benign effusions. Clin Cancer Res. 2007;13:5805. doi:10.1158/1078-0432
33. Liu S, Cay Y, Sothern RB, Guan Y, Chan P. Chronobiological analysis of circadian patterns in transcription of seven key clock genes in six peripheral tissues in mice. Chronobiol Int. 2007;24:793–820. doi:10.1080/07420520701672556
34. Vogl T, Pröpper C, Hartmann M, et al. S100A12 is expressed exclusively by granulocytes and acts independently from MRP8 and MRP14. J Biol Chem. 1999;274:25291–25296. doi:10.1074/jbc.274.36.25291
35. Hood S, Amir S. The aging clock: circadian rhythms and later life. J Clin Invest. 2017;127:437–446. doi:10.1172/JCI90328
36. Yu M, Hazelton WD, Luebeck GE, Grady WM. Epigenetic aging: more than just a clock when it comes to cancer. Cancer Res. 2019. doi:10.1158/0008-5472.can-19-0924
 © 2021 The Author(s). This work is published and licensed by Dove Medical Press Limited. The full terms of this license are available at https://www.dovepress.com/terms.php and incorporate the Creative Commons Attribution - Non Commercial (unported, v3.0) License.
By accessing the work you hereby accept the Terms. Non-commercial uses of the work are permitted without any further permission from Dove Medical Press Limited, provided the work is properly attributed. For permission for commercial use of this work, please see paragraphs 4.2 and 5 of our Terms.
© 2021 The Author(s). This work is published and licensed by Dove Medical Press Limited. The full terms of this license are available at https://www.dovepress.com/terms.php and incorporate the Creative Commons Attribution - Non Commercial (unported, v3.0) License.
By accessing the work you hereby accept the Terms. Non-commercial uses of the work are permitted without any further permission from Dove Medical Press Limited, provided the work is properly attributed. For permission for commercial use of this work, please see paragraphs 4.2 and 5 of our Terms.