")
Back to Journals » Vascular Health and Risk Management » Volume 19
Factors Associated with Hypertension Among Adults: A Cross-Sectional Analysis of the Indonesian Family Life Survey
Authors Alfaqeeh M , Alfian SD , Abdulah R
Received 2 October 2023
Accepted for publication 30 November 2023
Published 11 December 2023 Volume 2023:19 Pages 827—836
DOI https://doi.org/10.2147/VHRM.S438180
Checked for plagiarism Yes
Review by Single anonymous peer review
Peer reviewer comments 2
Editor who approved publication: Dr Daniel Duprez
Mohammed Alfaqeeh,1 Sofa D Alfian,1– 3 Rizky Abdulah1,2
1Department of Pharmacology and Clinical Pharmacy, Faculty of Pharmacy, Universitas Padjadjaran, Jatinangor, Indonesia; 2Center of Excellence in Higher Education for Pharmaceutical Care Innovation, Universitas Padjadjaran, Jatinangor, Indonesia; 3Center for Health Technology Assessment, Universitas Padjadjaran, Jatinangor, Indonesia
Correspondence: Sofa D Alfian, Department of Pharmacology and Clinical Pharmacy, Faculty of Pharmacy, Universitas Padjadjaran, Jl. Raya Jatinangor, KM 21, Jatinangor, Sumedang, Indonesia, Tel/Fax +62-022-7796200, Email [email protected]
Purpose: Hypertension (HTN) poses a significant health risk for Indonesia’s large population. Underlying factors contributing to this disease are not fully understood at a national level. Therefore, this study aimed to evaluate factors associated with HTN in Indonesia.
Patients and Methods: This study used data from the Indonesian Family Life Survey-5, a 2014 national cross-sectional population-based survey of individuals aged 15 years and older. The mean arterial pressure (MAP) value was determined from three blood pressure measurements taken by trained nurses using Omron digital sphygmomanometers. The respondent was classified as hypertensive when the MAP value was at least 100. The study summarised the socio-demographic factors (age, gender, marital status, ethnicity and occupation status) and lifestyle habits (smoking, sleep quality, physical activity) with descriptive statistics. The potential associations between these factors and HTN were assessed using logistic regression analysis. The results were reported in terms of odds ratios (OR) with a 95% confidence interval (CI).
Results: The study included 32,670 respondents; 31.2% of them had HTN. Factors that were more likely associated with HTN were being < 65 years old, being married (OR 1.257, 95% CI 1.170– 1.352) and being smoker (OR 1.297, 95% CI 1.198– 1.404), while being male (OR 0.677, 95% CI: 0.625– 0.733) and doing no physical activity (OR 0.870, 95% CI: 0.813– 0.930) were less likely to be associated with HTN.
Conclusion: This study indicates that there are associations between certain socio-demographic factors and lifestyle habits with HTN in Indonesia. This information may help policymakers and healthcare providers to develop effective strategies in order to control HTN in Indonesia, thereby improving the overall health and well-being of the population.
Keywords: hypertension, lifestyle, socio-demographic, Indonesian Family Life Survey
Introduction
Hypertension (HTN) is a serious cardiovascular disease that can cause several potentially fatal conditions.1,2 Stroke, dementia, chronic kidney disease, coronary artery disease, coronary heart disease and heart failure are significantly exacerbated by HTN.3 Pre-hypertensives (120–139 mmHg systolic; 80–89 mmHg diastolic) and stage 1 hypertensives (140–159 mmHg systolic; 90–99 mmHg diastolic) account for most of the rising prevalence of HTN-linked events.3 It is estimated to be responsible for 13 to 19% of all deaths in the world annually,2,4–6 and it is predicted that by 2025, 1.56 billion people will be hypertensive.7 Several factors contribute to the rising incidence of the disease including the ongoing nutritional transition and increasingly sedentary lifestyle. Populations in low- and middle-income countries may experience a greater burden of the disease,8 reflecting a shift that has occurred over the past three decades. Raised Blood Pressure (BP) was initially a significant burden in high-income countries, now it is prevalent in South and East Asia and Sub-Saharan Africa.9 In Southeast Asia, HTN is currently diagnosed in one-third of adults and causes over one million deaths a year.10 Indonesia, the largest and most populous country in Southeast Asia, has the highest prevalence of HTN in the region (42.7% of men and 39.2% of women). Additionally, there is still a lack of understanding and access to care, and the management of HTN is poor.11–13 A study using data from the 2007 Indonesia Family Life Survey-5 (IFLS-5) examined socio-demographic disparities in the diagnosis and treatment of HTN in Indonesian adults. It found that 67% of those with HTN were unaware of their condition, less than 30% were taking medication for it and only 25% had their BP under control.14 The early detection of BP levels enables classification into normal, prehypertension or hypertension. This classification highlights the possibility of early detection of prehypertension and advanced hypertension and illustrates the progressive nature of HTN.15
Identifying factors that influence HTN risk may improve decision-making.16 High BP has several influences, including lifestyle and demographic factors.17 Some studies indicate that significant alterations in lifestyle habits have an impact on the prevalence of HTN;18,19 these include smoking,20 poor sleep quality,21 and lack of physical activity.22 Moreover, recent studies demonstrate that socio-demographic factors are responsible for gaps in the management of HTN.23–25 An earlier study suggested that racial differences in HTN prevalence were influenced by demographic factors,26 such as age,27 gender,28 marital status,29 ethnicity,30 and occupation status.31
Despite global recognition of the significant roles that these factors play in HTN development, few studies have investigated their specific impact in the Indonesian context.32 Furthermore, there are critical gaps in the existing literature. Notably, few previous studies have examined the association between sleep quality and HTN. A multifaceted approach that addresses the root causes of HTN will be essential to reducing its prevalence in Indonesia and improving the overall health of the population.
To address the existing gaps, this study aimed to identify the association between socio-demographic factors (age, gender, marital status, ethnicity and occupation status) and lifestyle factors (smoking, sleep quality, physical activity) with HTN, using data from the IFLS-5. By understanding these factors, policymakers can formulate and implement effective policies to address HTN’s incidence.
Methods
Study Design
A cross-sectional study design using secondary data from IFLS-5 was conducted in 2015.32 The community surveys gathered information on households, individuals and communities using a multistage stratified sample. The IFLS-5 accurately represents 83% of Indonesians.33 The data can be accessed free of charge at https://www.rand.org/labor/FLS/IFLS.html. The research was sponsored by Survey METER and RAND Corporation (US).12 More in-depth information about the survey and sampling methodology can be accessed at https://www.rand.org/well-being/social-and-behavioural-policy/data/FLS/IFLS/ifls5.html.34
Variables and Measurements
We limited our analysis to the IFLS-5 cross-sectional survey of adults, which is the most current national survey available providing a cross-sectional assessment of HTN. Data of respondents younger than 15 years old or incomplete responses on the HTN factor were excluded from this study (Figure 1). In constructing our multiple regression model for HTN, we chose variables based on theoretical and practical significance. We drew insights from previous studies outside Indonesia to validate their relevance. We prioritized variables with low missing data percentages to enhance analysis robustness. Additionally, we exclude variables like cholesterol levels due to reliance on self-reporting, opting for more objectively measured data to uphold model integrity.
 |
Figure 1 Flow diagram of the sample-selection process. |
Hypertension
Respondents older than 15 years had their BP checked three times at home by specially trained nurses using Omron digital self-inflating sphygmomanometers.33 The American Heart Association standard was used as the basis for the IFLS-5 BP measurement database.35 Before the first measurement, respondents sat in silence in a reclined chair with their legs uncrossed, both feet flat on the floor and their forearms resting on a table at heart level.33 The first measurement was taken at the start of the interview, and the next two were taken during the interview. The average of the three measurements was used for this study.12 While both systolic and diastolic measurements are crucial for diagnosis and treatment, clinical studies indicate that among individuals aged 50 and above, systolic BP might be a more significant predictor of adverse events. Conversely, in individuals under 50, diastolic BP may exhibit slightly greater predictiveness.36 Elevated systolic BP without a concurrent increase in diastolic BP is prevalent in the elderly, yet other research emphasizes the essential role of diastolic BP in younger populations.37–43 Due to the varying emphasis on systolic and diastolic BP in the literature, Kundu et al44 propose the use of mean arterial pressure (MAP) for a more accurate prediction of BP compared to relying on systolic or diastolic BP alone. MAP, representing the average arterial BP over a single cardiac cycle, emerges as a potentially superior option for diagnosing and statistically analyzing BP.45 This suggestion finds support in studies examining the association of BP with potential causative factors,44 demonstrating an improved ability to identify mild cases of hypertension.45 For categorizing the respondents as hypertensive or non-hypertensive, a MAP value less than 100 is considered non-hypertensive.44 The HTN variable was categorized as hypertensive or non-hypertensive.
Lifestyle Habits
Three health risk behaviours were investigated: smoking, sleep quality and physical activity. Smoking was assessed with the question “Have you ever chewed tobacco, smoked a pipe, smoked self-rolled cigarettes or smoked cigarettes/cigars?”33 Sleep quality was assessed with the statement “My sleep quality is very bad, fair, good, and very good”.33 The first three categories were coded as (0) indicating poor sleep quality while the last category was coded as (1) indicating good sleep quality.46 Physical activity over the previous seven days was assessed using a modified version of the International Physical Activity Questionnaire (IPAQ), short version (IPAQ-S7S). The IPAQ manual instructions were followed, and physical activity was classified into low, moderate and high categories based on the official IPAQ scoring protocol.47 The question was “During the last 7 days, did you do any vigorous, moderate or walking activities for at least 10 minutes continuously?”33 A ‘Yes’ response was categorised as good physical activity, while a “No” response was categorised as a lack of physical activity.
Socio-Demographic Factors
The socio-demographic factors assessed were age, gender (male and female), marital status, (currently unmarried/married), ethnicity (Javanese and non-Javanese) and occupational status (unemployed and employed).33
Statistical Analysis
All responses were grouped into two categories, except for age. The categories were collapsed to ensure sufficient numbers in each and enable meaningful analysis.48 The variable characteristics were analyzed using descriptive statistics, while the univariate association between the potential factors and outcome was evaluated using a chi-square test. Multivariable logistic regression was used to evaluate the association between assessed factors and HTN. The odds ratio (OR) with a 95% confidence interval (CI) was reported. The analysis was performed using the SPSS program (SPSS version 26, IBM Corporation, Armonk, NY, USA).49
Results
Baseline Characteristics
In total, 32,670 respondents were included in this study (Figure 1). Approximately half were female (53.3%), non-Javanese (56.1%) and employed (57.9%). Most respondents were married (71.4%), non-smokers (63.9%), had poor sleep quality (95.9%), had no physical activity (78%) and were aged 25–34 years (26.1%). Among all respondents, 31.2% had HTN (Table 1).
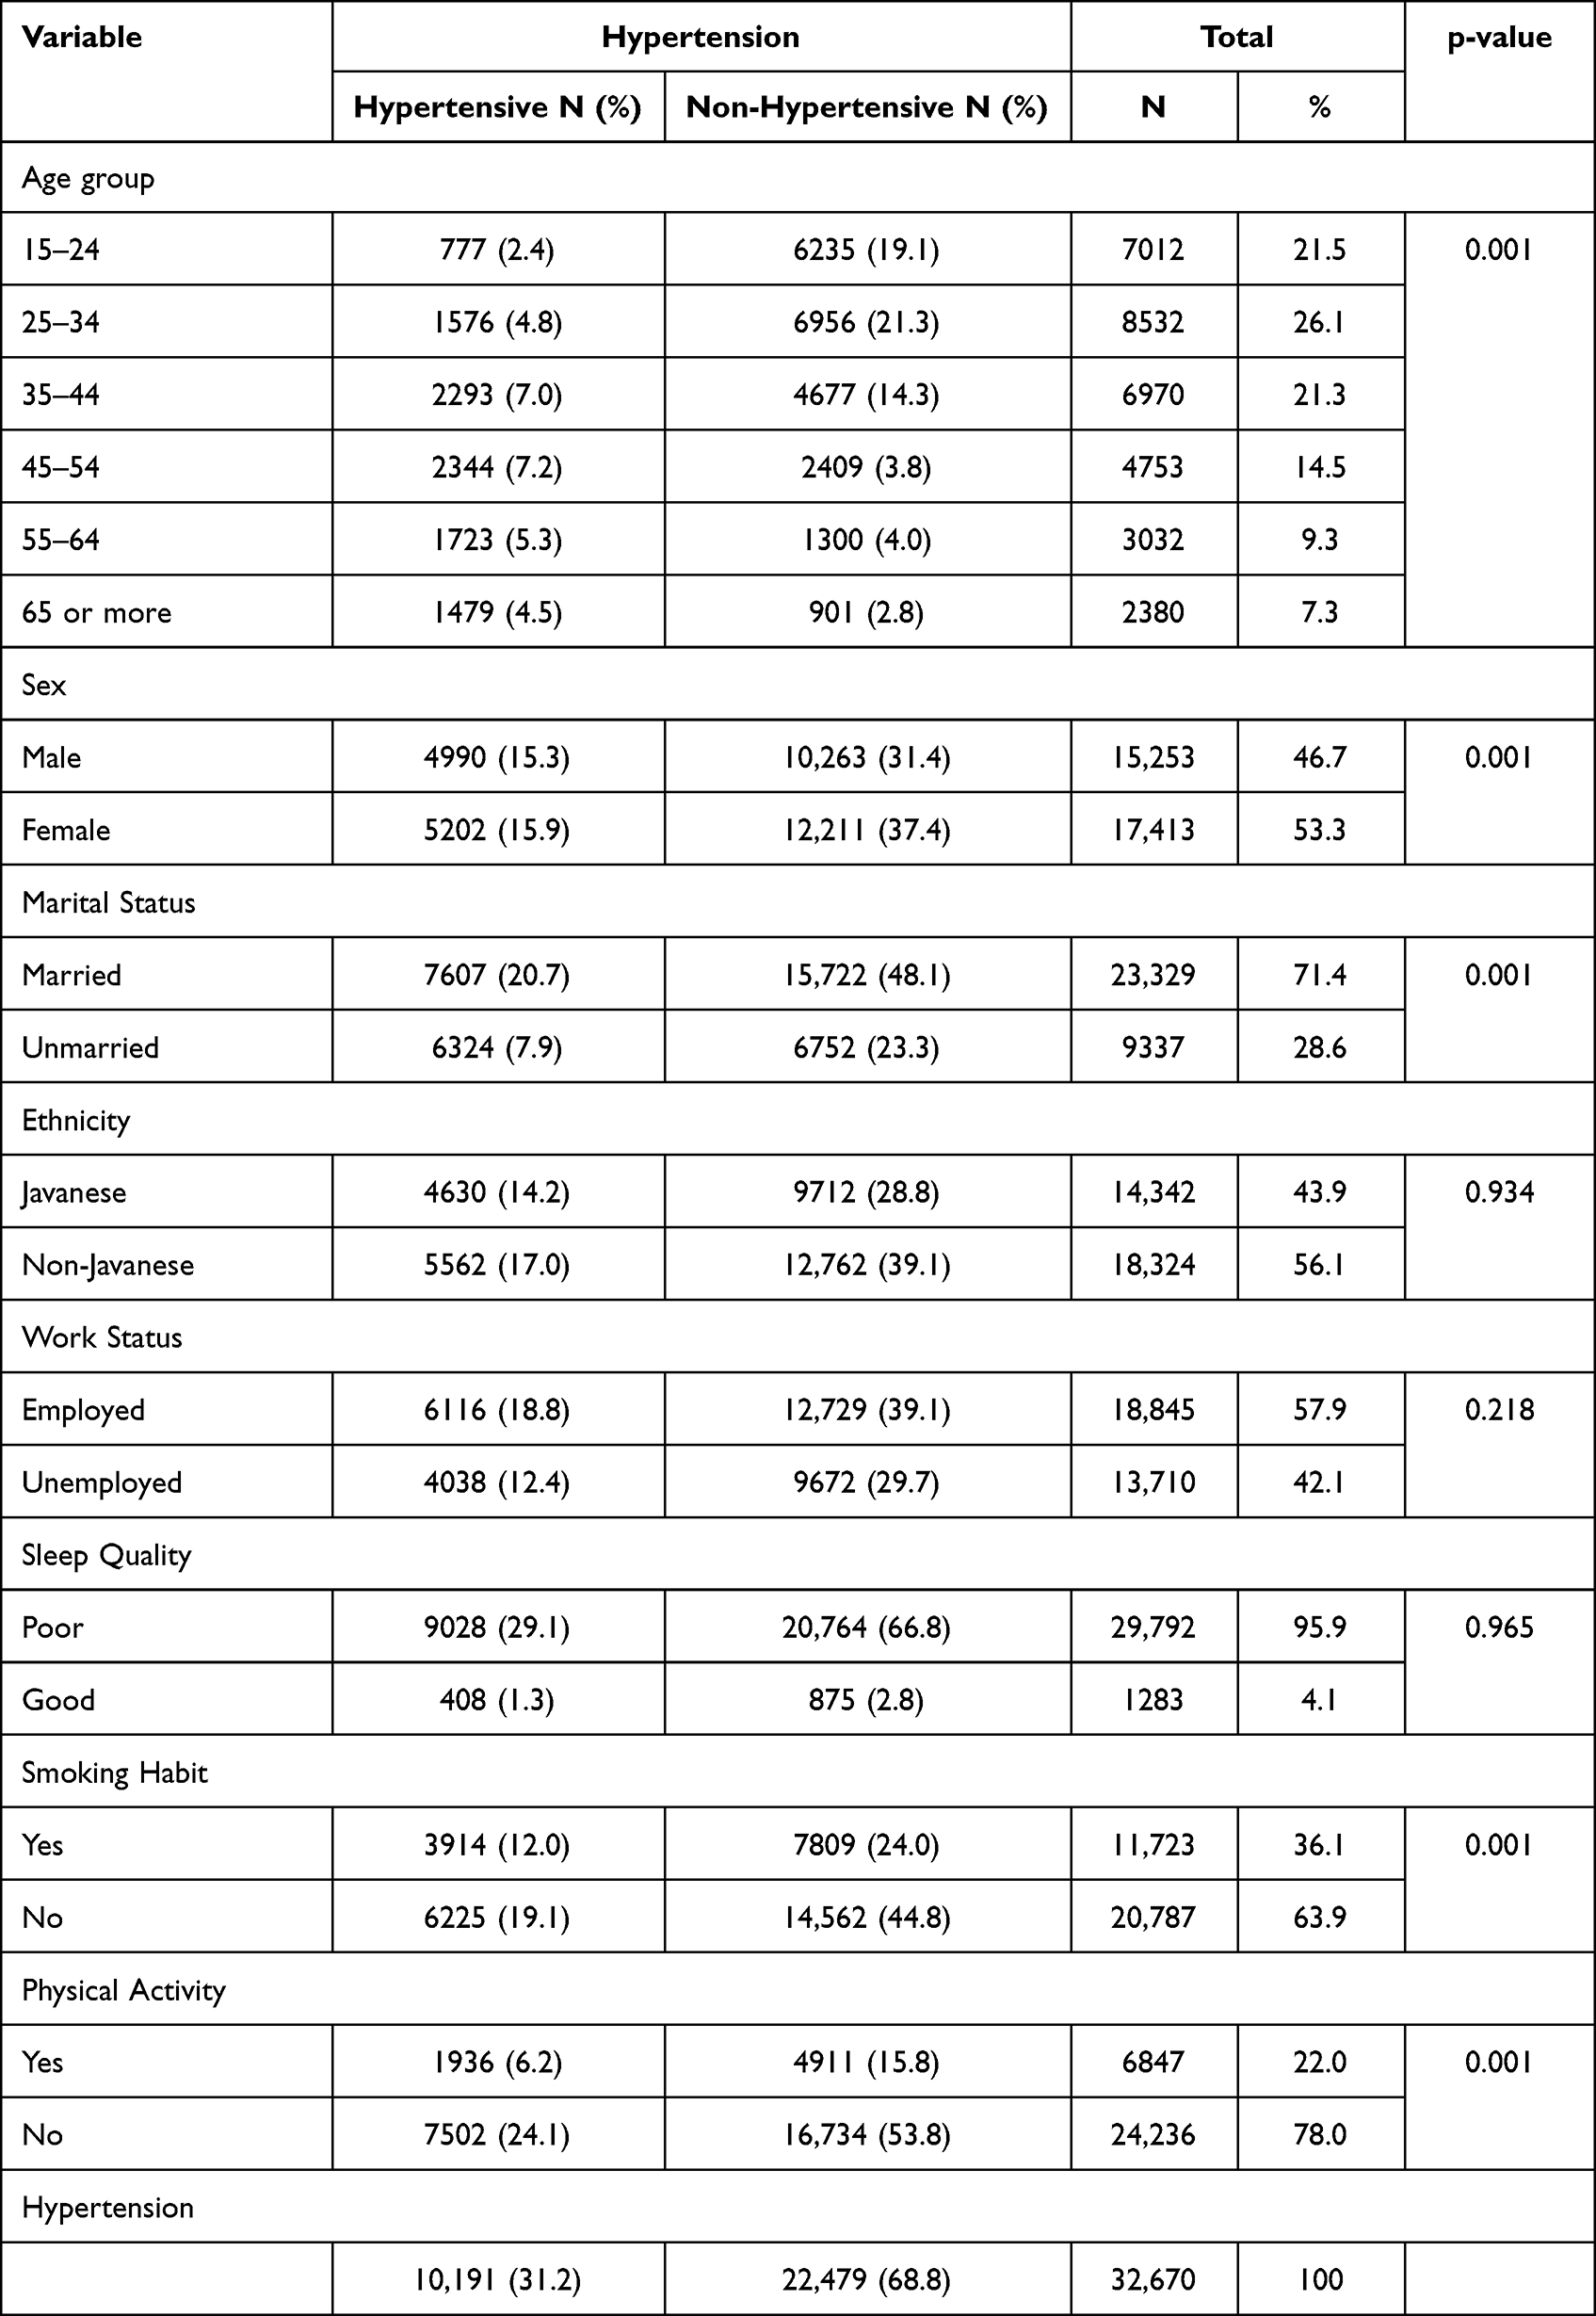 |
Table 1 Characteristics of Respondents (n=32,670) |
Association Between Potential Factors and Hypertension
In the multivariable logistic regression analysis, all age groups were found to have statistically significant associations with HTN. Specifically, respondents aged <65 years had higher odds of developing HTN than those aged 65 or older. Marital status was also associated with HTN, with being married showing a significant association (OR 1.257, 95% CI 1.170–1.352). Furthermore, smokers had higher odds of having HTN (OR 1.297, 95% CI 1.198–1.404) than non-smokers. Conversely, being male was less associated with an increased risk of HTN (OR 0.677, 95% CI: 0.625–0.733) compared to females. Additionally, not doing physical activity reduced the risk of HTN (OR 0.870, 95% CI: 0.813–0.930) (Table 2).
 |
Table 2 Multivariable Regression Analysis of Study Variables Associated with Hypertension |
Discussion
Of all 32,670 respondents, more than a quarter experienced HTN, which was highest in the 45–54-year age group. All age groups, marital status and smoking factors showed an increased risk of having HTN, while gender and physical activity factors reported fewer associations with HTN.
This study showed a relatively high prevalence of HTN. Similarly, a study conducted in Myanmar in 2009 found that the prevalence of HTN in 15–64-year-olds was 30.1%.50 Another study conducted in China in individuals aged 18 years and older had a prevalence of 29.6%.51 A study conducted in Indonesia, using IFLS-4, found that the prevalence of HTN among Indonesian adults ≥40 Years was 47.8%,12 which is comparable to the age-specific prevalence reported in our own study.
Indonesia is one of the largest markets in the world for tobacco.52 Like ours, a study in China with the same measurements of smoking and HTN revealed that former smokers had an increased risk of having HTN with ORs 1.48 (95% CI: 1.01–2.18). Also, in line with our findings, a Swedish cohort study demonstrated that women who currently smoke have higher adjusted mean BP than non-smokers have.53 According to another study, smoking causes elevated BP mostly by stimulating the sympathetic nervous system.54 Our study also found that individuals who performed no physical activity had a lower likelihood of experiencing HTN. The relationship between physical activity and HTN is complex. The specific mechanisms by which physical activity prevents HTN are not yet fully understood due to the multifactorial nature of the condition.55 The authors of a study of the potential mechanisms underlying the blood pressure-lowering effects of physical activity propose that physical activity can reduce BP by decreasing vascular resistance, involving the sympathetic nervous system and the renin-angiotensin system. This suggests that physiological pathways influenced by physical activity play a role in modulating BP levels.56 These studies show that physical activity’s impact on HTN is a complex interplay of many factors.
Ages less than 65 years exhibited a statistically significant association with HTN in our study. The involvement of various social, nutritional and psychological factors in HTN has been reported.57 A longitudinal study reporting an in-depth analysis of psychosocial variables, including elevated levels of time urgency, impatience and hostility revealed an association with the risk of developing HTN over a 15-year period in a cohort of young adults aged 18–30 years.58 Regarding gender, our study did not find a significant association with HTN. However, one study found that Chinese and Indian people but not Malays, showed significant associations between gender and HTN.23 Since part of the Indonesian population consists of Malays, these findings may explain the absence of gender-related associations in our study. Furthermore, another study exploring the impact of gender on HTN, explained that gender can be a risk factor for developing HTN due to the influence of sex hormones on renal sodium regulation and vascular resistance. The study suggested that male sex hormones, such as androgens, may contribute to higher BP levels in men, while female sex hormones appear to have a protective effect against salt-induced increases in BP.59 Surprisingly, the marital status factor in this study showed an association with HTN; we do not fully understand the mechanics underlying this. Psychopathological factors, neuroendocrine pathways, health habits (exercise, nutrition and adherence), biological mediators and immunological pathways have all been proposed in studies as potential explanations for the impacts of marital status on BP.60
This study had many respondents, which provided robust findings and bolstered the statistical power of the analysis. Additionally, the HTN data was gathered by measuring the respondents’ right and left arms three times each to make sure the data collected was more reliable. Furthermore, previous studies did not address quality of sleep as a potential risk factor for HTN. Conversely, this study was cross-sectional and causal association cannot be proven. Moreover, it is important to consider the influence of social desirability bias on the results, as individuals may provide answers that conform to societal norms or expectations, rather than providing truthful or precise responses.
The development of suitable interventions for HTN in Indonesia is a big concern. Interventions should focus on promoting healthy lifestyles and early detection and treatment of HTN in all age groups. Social support networks, stress reduction techniques and counselling may be effective in reducing HTN risk in married individuals. Smoking cessation programs and nicotine replacement therapy may help reduce HTN risk in smokers. Healthcare providers should emphasize the importance of these interventions and provide resources to assist in their implementation to promote healthier lifestyles in Indonesia. Future studies should also explore the potential impact of additional factors, such as obesity and sedentary habits, as these lifestyle factors may play a significant role in contributing to HTN.
Conclusion
Our study findings suggest an association between certain socio-demographic and lifestyle factors and HTN, indicating a need for policy interventions aimed at reducing HTN rates. These interventions should focus on addressing the factors identified in this study.
Data Sharing Statement
The data used in this study are publicly available from the Indonesia Family Life Survey (IFLS), which is a collaborative effort between RAND Corporation, University of Gadjah Mada and Survey METER. The data can be accessed at https://www.rand.org/labor/FLS/IFLS.html.
Ethical Approval
The ethics review committees of RAND and the Indonesian University of Gadjah Mada have authorized the IFLS.
Acknowledgments
The authors express their gratitude to Survey METER and RAND Corporation for granting permission to use the Indonesian Family Life Survey database.
Author Contributions
All authors made a significant contribution to the work reported, whether that is in the conception, study design, execution, acquisition of data, analysis and interpretation, or in all these areas; took part in drafting, revising or critically reviewing the article; gave final approval of the version to be published; have agreed on the journal to which the article has been submitted; and agree to be accountable for all aspects of the work.
Funding
There is no fund to report.
Disclosure
The authors declare no conflicts of interest in this work.
References
1. Choi Y, Choi J. Hypertension Prediction Using Machine Learning Technique. Int J Strategic Decision Sci. 2020;11(3):52–62. doi:10.4018/IJSDS.2020070103
2. Dzau VJ, Balatbat CA. Future of Hypertension. Hypertension. 2019;74(3):450–457. doi:10.1161/HYPERTENSIONAHA.119.13437
3. Nicoll R, Henein MY. Hypertension and lifestyle modification: how useful are the guidelines? Br J General Practice. 2010;60(581):879–880. doi:10.3399/BJGP10X544014
4. Stanaway JD, Afshin A, Gakidou E, et al. Global, regional, and national comparative risk assessment of 84 behavioural, environmental and occupational, and metabolic risks or clusters of risks for 195 countries and territories, 1990–2017: a systematic analysis for the Global Burden of Disease Study 2017. Lancet. 2018;392(10159):1923–1994. doi:10.1016/S0140-6736(18)32225-6
5. Unger T, Borghi C, Charchar F, et al. International Society of Hypertension Global Hypertension Practice Guidelines. Hypertension. 2020;75(6):1334–1357. doi:10.1161/HYPERTENSIONAHA.120.15026
6. Thomas H, Diamond J, Vieco A, et al. Global Atlas of Cardiovascular Disease 2000-2016: the Path to Prevention and Control. Glob Heart. 2018;13(3):143–163. doi:10.1016/j.gheart.2018.09.511
7. Kearney PM, Whelton M, Reynolds K, Muntner P, Whelton PK, He J. Global burden of hypertension: analysis of worldwide data. Lancet. 2005;365(9455):217–223. doi:10.1016/S0140-6736(05)17741-1
8. Sarki AM, Nduka CU, Stranges S, Kandala N-B, Uthman OA. Prevalence of Hypertension in Low- and Middle-Income Countries: a Systematic Review and Meta-Analysis. Medicine. 2015;94(50):e1959. doi:10.1097/MD.0000000000001959
9. Schutte AE, Srinivasapura Venkateshmurthy N, Mohan S, Prabhakaran D. Hypertension in Low- And Middle-Income Countries. Circ Res. 2021;128(7):808–826. doi:10.1161/CIRCRESAHA.120.318729
10. Mohammed Nawi A, Mohammad Z, Jetly K, et al. The Prevalence and Risk Factors of Hypertension among the Urban Population in Southeast Asian Countries: a Systematic Review and Meta-Analysis. Int J Hypertens. 2021;2021:1–14. doi:10.1155/2021/6657003
11. Zhou B, Carrillo-Larco RM, Danaei G, et al. Worldwide trends in hypertension prevalence and progress in treatment and control from 1990 to 2019: a pooled analysis of 1201 population-representative studies with 104 million participants. Lancet. 2021;398:957–980.
12. Hussain MA, Mamun A, Reid C, Huxley RR; Prevalence. Awareness, Treatment and Control of Hypertension in Indonesian Adults Aged ≥40 Years: findings from the Indonesia Family Life Survey (IFLS). PLoS One. 2016;11(8):e0160922. doi:10.1371/journal.pone.0160922
13. Krishnan A, Garg R, Kahandaliyanage A. Hypertension in the South-East Asia Region: an overview. Spec issue blood press. Tak Control. 2013;17:7–14.
14. Mashuri YA, Ng N, Santosa A. Socioeconomic disparities in the burden of hypertension among Indonesian adults - a multilevel analysis. Glob Health Action. 2022;15(1). doi:10.1080/16549716.2022.2129131
15. den TC, Yen AMF, Chiu SYH, Chen LS, Chen HH, Chang SH. A Predictive Model for Risk of Prehypertension and Hypertension and Expected Benefit After Population-Based Life-Style Modification (KCIS No. 24). Am J Hypertens. 2012;25(2):171–179. doi:10.1038/AJH.2011.122
16. Echouffo-Tcheugui JB, Batty GD, Kivimäki M, Kengne AP. Risk Models to Predict Hypertension: a Systematic Review. PLoS One. 2013;8(7):e67370. doi:10.1371/JOURNAL.PONE.0067370
17. Sun D, Liu J, Xiao L, et al. Recent development of risk-prediction models for incident hypertension: an updated systematic review. PLoS One. 2017;12(10):e0187240. doi:10.1371/journal.pone.0187240
18. Chobanian AV, Bakris GL, Black HR, et al. Seventh Report of the Joint National Committee on Prevention, Detection, Evaluation, and Treatment of High Blood Pressure. Hypertension. 2003;42(6):1206–1252. doi:10.1161/01.HYP.0000107251.49515.c2
19. Antman EM, Appel LJ, Balentine D, et al. Stakeholder discussion to reduce population-wide sodium intake and decrease sodium in the food supply a conference report from the American heart association sodium conference 2013 planning group. Circulation. 2014;129(25). doi:10.1161/CIR.0000000000000051
20. Thuy AB, Blizzard L, Schmidt MD, Luc PH, Granger RH, Dwyer T. The association between smoking and hypertension in a population-based sample of Vietnamese men. J Hypertens. 2010;28(2):245–250. doi:10.1097/HJH.0b013e32833310e0
21. Liu RQ, Qian Z, Trevathan E, et al. Poor sleep quality associated with high risk of hypertension and elevated blood pressure in China: results from a large population-based study. Hypertension Research. 2016;39(1):54–59. doi:10.1038/hr.2015.98
22. Paffenbarger RS, Jung DL, Leung RW, Hyde RT. Physical Activity and Hypertension: an Epidemiological View. Ann Med. 1991;23(3):319–327. doi:10.3109/07853899109148067
23. Liew SJ, Lee JT, Tan CS, Koh CHG, van Dam R, Müller-Riemenschneider F. Sociodemographic factors in relation to hypertension prevalence, awareness, treatment and control in a multi-ethnic Asian population: a cross-sectional study. BMJ Open. 2019;9(5):e025869. doi:10.1136/bmjopen-2018-025869
24. Baldisserotto J, Kopittke L, Nedel FB, et al. Socio-demographic caracteristics and prevalence of risk factors in a hypertensive and diabetics population: a cross-sectional study in primary health care in Brazil. BMC Public Health. 2016;16(1). doi:10.1186/s12889-016-3230-7
25. Mika M, Kenneth S, Orvalho A, et al. The prevalence of hypertension and its distribution by sociodemographic factors in Central Mozambique: a cross sectional study. BMC Public Health. 2020;20(1):56. doi:10.1186/s12889-020-09947-0
26. Adeke AS, Chori BS, Neupane D, Sharman JE, Odili AN. Socio-demographic and lifestyle factors associated with hypertension in Nigeria: results from a country-wide survey. J Hum Hypertens. 2022. doi:10.1038/s41371-022-00673-1
27. Manimunda SP, Sugunan AP, Benegal V, Balakrishna N, Rao MV, Pesala KS. Association of hypertension with risk factors & hypertension related behaviour among the aboriginal Nicobarese tribe living in Car Nicobar Island, India. Indian J Med Res. 2011;133(3):287.
28. Reckelhoff JF. Gender differences in hypertension. Curr Opin Nephrol Hypertens. 2018;27(3):176–181. doi:10.1097/MNH.0000000000000404
29. Tuoyire DA, Ayetey H. GENDER DIFFERENCES IN THE ASSOCIATION BETWEEN MARITAL STATUS AND HYPERTENSION IN GHANA. J Biosoc Sci. 2019;51(3):313–334. doi:10.1017/S0021932018000147
30. Deere BP, Ferdinand KC. Hypertension and race/ethnicity. Curr Opin Cardiol. 2020;35(4):342–350. doi:10.1097/HCO.0000000000000742
31. Grotto I, Huerta M, Sharabi Y. Hypertension and socioeconomic status. Curr Opin Cardiol. 2008;23(4):335–339. doi:10.1097/HCO.0B013E3283021C70
32. Mahiroh H, Astutik E, Pratama RA. The Association of Body Mass Index, Physical Activity and Hypertension in Indonesia. Int J Med. 2019;14(1):2811. doi:10.20473/jn.v13i1.12811
33. Strauss J, Witoelar F, Strauss SB, Witoelar JF, Sikoki B. “The Fifth Wave of the Indonesia Family Life Survey (IFLS5): overview and Field Report”. WR-1143/1-NIA/NICHD. 2016. Available from: www.rand.org/giving/contribute.
34. Faiza Yuniati SPM, Sudijanto Kamso S. Assessing the Quality of Life Among Productive Age in the General Population: a Cross-Sectional Study of Family Life Survey in Indonesia. Asia Pacific J Public Health. 2021. doi:10.1177/1010539520956411
35. Mulyanto J, Kringos DS, Kunst AE. Socioeconomic inequalities in the utilisation of hypertension and type 2 diabetes management services in Indonesia. Tropical Medicine and International Health. 2019;24(11):1301–1310. doi:10.1111/TMI.13303
36. Pinto E. Blood pressure and ageing. Postgrad Med J. 2007;83(976):109–114. doi:10.1136/PGMJ.2006.048371
37. Lee MLT, Rosner BA, Weiss ST. Relationship of Blood Pressure to Cardiovascular Death: the Effects of Pulse Pressure in the Elderly. Ann Epidemiol. 1999;9(2):101–107. doi:10.1016/S1047-2797(98)00034-9
38. Franklin SS, Larson MG, Khan SA, et al. Does the Relation of Blood Pressure to Coronary Heart Disease Risk Change With Aging? Circulation. 2001;103(9):1245–1249. doi:10.1161/01.CIR.103.9.1245
39. Khattar RS, Swales JD, Dore C, Senior R, Lahiri A. Effect of aging on the prognostic significance of ambulatory systolic, diastolic, and pulse pressure in essential hypertension. Circulation. 2001;104(7):783–789. doi:10.1161/HC3201.094227
40. Kannel WB, Gordon T, Schwartz MJ. Systolic versus diastolic blood pressure and risk of coronary heart disease: the Framingham study. Am J Cardiol. 1971;27(4):335–346. doi:10.1016/0002-9149(71)90428-0
41. Crea F. Fighting the pandemic of heart failure: better utilization of current treatments, new drugs, and new therapeutic targets. Eur Heart J. 2023;44(44):4607–4611. doi:10.1093/EURHEARTJ/EHAD765
42. Flint AC, Conell C, Ren X, et al. Effect of Systolic and Diastolic Blood Pressure on Cardiovascular Outcomes. N Engl J Med. 2019;381(3):243–251. doi:10.1056/NEJMOA1803180/SUPPL_FILE/NEJMOA1803180_DISCLOSURES.PDF
43. Li Y, Ff W, Wang S, Cheng YB, Wang JG. Cardiovascular Risks Associated With Diastolic Blood Pressure and Isolated Diastolic Hypertension. Curr Hypertens Rep. 2014;16(11):1–6. doi:10.1007/S11906-014-0489-X/METRICS
44. Nath Kundu R, Biswas S, Das M, de Michele M, Assistant D. Mean Arterial Pressure Classification: a Better Tool for Statistical Interpretation of Blood Pressure Related Risk Covariates. An Int J. 2017;6(1):1–7. doi:10.9734/CA/2017/30255
45. Kandil H, Soliman A, Alghamdi NS, Jennings JR, El-Baz A. Using Mean Arterial Pressure in Hypertension Diagnosis versus Using Either Systolic or Diastolic Blood Pressure Measurements. Biomedicines. 2023;11(3):849. doi:10.3390/BIOMEDICINES11030849
46. Indrahadi D, Wardana A, Pierewan AC. The prevalence of diabetes mellitus and relationship with socioeconomic status in the Indonesian population. Jurnal Gizi Klinik Indonesia. 2021;17(3):103. doi:10.22146/ijcn.55003
47. Craig CL, Marshall AL, Sjo¨stro¨m M, et al. International Physical Activity Questionnaire: 12-Country Reliability and Validity. Med Sci Sports Exerc. 2003;35(8):1381–1395. doi:10.1249/01.MSS.0000078924.61453.FB
48. Bailey JM, Regan TW, Bartlem KM, Wiggers JH, Wye PM, Bowman JA. A survey of the prevalence of modifiable health risk behaviours among carers of people with a mental illness. BMC Public Health. 2019;19(1). doi:10.1186/s12889-019-7577-4
49. IBM Corp. Released. IBM SPSS Statistics for Windows, Version 26.0. Armonk, NY: IBM Corp; 2019.
50. Bjertness MB, Htet AS, Meyer HE, et al. Prevalence and determinants of hypertension in Myanmar - A nationwide cross-sectional study. BMC Public Health. 2016;16(1):1–10. doi:10.1186/S12889-016-3275-7/TABLES/4
51. Wang J, Zhang L, Wang F, et al.; Group the CNS of CKDW. Prevalence, Awareness, Treatment, and Control of Hypertension in China: results From a National Survey. Am J Hypertens. 2014;27(11):1355–1361. doi:10.1093/AJH/HPU053
52. Holipah H, Sulistomo HW, Maharani A. Tobacco smoking and risk of all-cause mortality in Indonesia. PLoS One. 2020;15(12 December):e0242558. doi:10.1371/journal.pone.0242558
53. Janzon E, Hedblad B, Berglund G, Engström G. Changes in blood pressure and body weight following smoking cessation in women. J Intern Med. 2004;255(2):266–272. doi:10.1046/J.1365-2796.2003.01293.X
54. Virdis A, Giannarelli C, Fritsch Neves M, Taddei S, Ghiadoni L. Cigarette Smoking and Hypertension. Curr. Pharm. Des. 2010;16:2518–2525. doi:10.2174/138161210792062920
55. Cleven L, Krell-Roesch J, Nigg CR, Woll A. The association between physical activity with incident obesity, coronary heart disease, diabetes and hypertension in adults: a systematic review of longitudinal studies published after 2012. BMC Public Health. 2020;20(1):1–15. doi:10.1186/S12889-020-08715-4/TABLES/4
56. Cornelissen VA, Fagard RH. Effects of Endurance Training on Blood Pressure, Blood Pressure–Regulating Mechanisms, and Cardiovascular Risk Factors. Hypertension. 2005;46(4):667–675. doi:10.1161/01.HYP.0000184225.05629.51
57. De Venecia T, Lu M, Figueredo VM. Hypertension in young adults. Postgraduate Medicine. 2016;128(2):201–207. doi:10.1080/00325481.2016.1147927
58. Yan LL, Liu K, Matthews KA, Daviglus ML, Ferguson TF, Kiefe CI. Psychosocial Factors and Risk of Hypertension: the Coronary Artery Risk Development in Young Adults (CARDIA) Study. JAMA. 2003;290(16):2138–2148. doi:10.1001/JAMA.290.16.2138
59. Oparil S, Miller AP. Gender and blood pressure. J Clin Hypertens. 2005;7(5):300–309. doi:10.1111/J.1524-6175.2005.04087.X
60. Robles TF, Slatcher RB, Trombello JM, McGinn MM. Marital quality and health: a meta-analytic review. Psychol Bull. 2014;140(1):140–187. doi:10.1037/A0031859
 © 2023 The Author(s). This work is published and licensed by Dove Medical Press Limited. The full terms of this license are available at https://www.dovepress.com/terms.php and incorporate the Creative Commons Attribution - Non Commercial (unported, v3.0) License.
By accessing the work you hereby accept the Terms. Non-commercial uses of the work are permitted without any further permission from Dove Medical Press Limited, provided the work is properly attributed. For permission for commercial use of this work, please see paragraphs 4.2 and 5 of our Terms.
© 2023 The Author(s). This work is published and licensed by Dove Medical Press Limited. The full terms of this license are available at https://www.dovepress.com/terms.php and incorporate the Creative Commons Attribution - Non Commercial (unported, v3.0) License.
By accessing the work you hereby accept the Terms. Non-commercial uses of the work are permitted without any further permission from Dove Medical Press Limited, provided the work is properly attributed. For permission for commercial use of this work, please see paragraphs 4.2 and 5 of our Terms.