")
Back to Journals » Clinical Interventions in Aging » Volume 19
Frequentist, Bayesian Analysis and Complementary Statistical Tools for Geriatric and Rehabilitation Fields: Are Traditional Null-Hypothesis Significance Testing Methods Sufficient?
Authors Nascimento DDC , Rolnick N, da Silva Almeida I , Cipriano Junior G , Durigan JL
Received 18 October 2023
Accepted for publication 6 February 2024
Published 16 February 2024 Volume 2024:19 Pages 277—287
DOI https://doi.org/10.2147/CIA.S441799
Checked for plagiarism Yes
Review by Single anonymous peer review
Peer reviewer comments 2
Editor who approved publication: Prof. Dr. Nandu Goswami
Dahan da Cunha Nascimento,1,* Nicholas Rolnick,2,* Isabella da Silva Almeida,3,* Gerson Cipriano Junior,4,* João Luiz Durigan3,*
1Physical Education Department, Universidade Católica de Brasília, Brasília, DF, Brazil; 2The Human Performance Mechanic Department, Lehman College, Bronx, NY, USA; 3Laboratory of Muscle and Tendon Plasticity, Faculdade de Ceilândia, Universidade de Brasília, Brasília, DF, Brazil; 4Graduate Program in Rehabilitation Science, Faculdade de Ceilândia, Universidade de Brasília, Brasília, DF, Brazil
*These authors contributed equally to this work
Correspondence: João Luiz Durigan, Laboratory of Muscle and Tendon Plasticity, Faculdade de Ceilândia, Universidade de Brasília, Centro Metropolitano, conjunto A, lote 01, Brasília, DF, 72220-275, Brazil, Tel/Fax +55 (61) 3376-0252, Email [email protected]
Abstract: Null hypothesis significant testing (NHST) is the dominant statistical approach in the geriatric and rehabilitation fields. However, NHST is routinely misunderstood or misused. In this case, the findings from clinical trials would be taken as evidence of no effect, when in fact, a clinically relevant question may have a “non-significant” p-value. Conversely, findings are considered clinically relevant when significant differences are observed between groups. To assume that p-value is not an exclusive indicator of an association or the existence of an effect, researchers should be encouraged to report other statistical analysis approaches as Bayesian analysis and complementary statistical tools alongside the p-value (eg, effect size, confidence intervals, minimal clinically important difference, and magnitude-based inference) to improve interpretation of the findings of clinical trials by presenting a more efficient and comprehensive analysis. However, the focus on Bayesian analysis and secondary statistical analyses does not mean that NHST is less important. Only that, to observe a real intervention effect, researchers should use a combination of secondary statistical analyses in conjunction with NHST or Bayesian statistical analysis to reveal what p-values cannot show in the geriatric and rehabilitation studies (eg, the clinical importance of 1kg increase in handgrip strength in the intervention group of long-lived older adults compared to a control group). This paper provides potential insights for improving the interpretation of scientific data in rehabilitation and geriatric fields by utilizing Bayesian and secondary statistical analyses to better scrutinize the results of clinical trials where a p-value alone may not be appropriate to determine the efficacy of an intervention.
Keywords: statistics, statistical significance, effect size, p-value
Introduction
Statistical analyses are fundamental to clinical trials in the geriatric and rehabilitation fields, and it is important for researchers to identify whether the data is clinically important and objectively able to determine differences between groups. These analytical skills are essential for uncovering trends and assessing the efficacy of an intervention. Researchers routinely select and evaluate data using conventional approaches, focusing on mean responses between groups. However, although it is specifically addressed in only a comparatively small number of studies, inter-individual variability in response to an intervention is also expected.1,2 Furthermore, statistical significance testing (represented by the p-value) can be routinely misunderstood or misused as it is not a measure of effect size nor provides evidence of no effect,3,4 leading to challenges in interpretation of clinical trials.
For a didactical purpose, a Fisher’s p-value was created to calculate the probability of an event and evaluate this probability within the research context.5,6 Thus, the reader frequently encounters a statistical test followed by a probability statement, such as p ≤ 0.05; the researcher accepts the null hypothesis if an event occurs more often than 5% (eg, 0.051). However, if an event occurs 5% of the time or less (eg, 0.05), the null hypothesis is rejected in favor of the alternative. Furthermore, based on a reasonable significance level to make a sound statistical decision, the researcher also wants to be wrong if the null hypothesis is incorrectly rejected.7
Hence, a type I error occurs when the null hypothesis is rejected when it is true.7 The researcher concluded that a statistic reflected a real difference when it was a sampling error.7 This probability is called alpha level, or α, the level or significance previously cited.7 On the contrary, a type II error is made when a false null hypothesis is accepted when it is an actual event.7
Suppose a study fails to reveal differences between two interventions. In such cases, the findings might be routinely interpreted as evidence of no effect. However, it is essential to note that a clinically relevant question may yield a “non-significant” p-value (eg, p = 0.075). Conversely, findings are considered clinically relevant when a significant difference is observed between groups. In fact, smaller p-values themselves do not imply the presence of important and clinically relevant effects, while larger p-values do not indicate a lack of an important effect.8 Unfortunately, p values only give a dichotomous decision (eg, yes or no), but an alpha equal to 0.05 can impede researchers in the geriatric and rehabilitation fields from further scrutinizing their findings to determine clinical relevancy. For frequentist analysis, researchers are interested in the probability of certain data assuming the interventions are equal and are tasked with identifying appropriate statistical methodologies to consider that could be embedded into routine geriatric rehabilitation practices to monitor the impact of future changes in clinical management of falls.4
Accordingly, we believe that researchers performing clinical trials in geriatric and rehabilitation fields have focused too much on p-values and statistical significance, possibly underestimating another critical piece of information: clinical/practical significance. Thus, frequentist inferences approach as NHST might be limited in their clinical relevance and practical utility for rehabilitation professionals. Another important problem is that most studies display overconfidence in significant results while discounting nonsignificant results.9
Assuming that the p-value is not an exclusive indicator of an association or the existence of an effect, according to statistically significance or non-significance values, researchers should be encouraged to report other complementary statistical tools alongside the p-value (eg, effect size, confidence intervals, minimal clinically important difference, and magnitude-based inference) or the use of Bayesian analysis4,10–15 to improve scientific data interpretation and provide a more efficient and comprehensive analysis.16,17
We describe this point of view using a hypothetical randomized controlled study (RCT) (n = 15 in each group) investigating the response to a 15-week Pilates training (PT) intervention on handgrip strength (HGS) in untrained women octogenarians compared to a control group (CON). In addition, we present Bayesian and some secondary statistical methods that researchers can perform in conjunction with dichotomous p-value testing of the hypothetical data. This point of view is structured into three subsequent sections to develop a coherent statistical framework followed by a simulated practical example. The first section begins by looking at statistical significance testing, effect size and confidence intervals. Secondly, we demonstrate how minimal clinical important difference (MCID) can be combined with the concept of statistical significance testing to enhance comprehensive reporting of clinical trials. In the third section, we present the concepts of the magnitude-based inference (MBI) and the interpretation of a true change score confidence interval (CI) using an MCID-based threshold. Finally, we discuss the use of Bayesian analysis and how this approach can quantify evidence by comparing the same interventions (PT vs CON).
Data from the study with the simulated examples are included in the accompanying Supplementary Digital File (see Supplementary material 1, Supplementary material 2, Supplementary Table 1 and Supplementary Table 2). The goal of providing these files is that readers can incorporate their own data set and understand the procedures described within this point of view, and ultimately, improve reporting of outcomes following clinical trials through comprehensive statistical analyses beyond p-values.
Statistical Significance Testing, Effect Size and Confidence Interval
The hypothetical RCT compared 15-weeks of Pilates training (PT) with a control group (CON) on handgrip strength (HGS) in a group of untrained women octogenarians with a mean age of 85 years. The traditional frequentist statistical analysis performed was a two-way ANOVA6,18 using SPSS Statistics. The basic requirements of the two-way ANOVA assumptions (https://statistics.laerd.com/) described as one dependent variable that is measured at the continuous level (eg, HGS), two independent variables (eg, PT vs CON) where each independent variable consists of two or more categorical independent variables, independence of observations, and no significant outliers with normal distribution and homogeneity of variances.
According to the between-group comparison retrieved from the two-way ANOVA, the mean values for HGS post-training were 20.80 ± 1.42 (95% Confidence Interval [CI], 20.03–21.56) and 19.86 ± 1.50 (95% CI: 19.10–20.63) for PT and CON, respectively, and did not differ significantly (after adjustment for multiple comparisons: Bonferroni) between the groups (p = 0.262) (see Supplementary Material 1 and Supplementary Table 1). Regarding the within-group comparisons, only the PT group displayed a statistically significant increase of 1.70 kg for HGS (p = 0.003) between time points (eg, pre- and post). However, as no differences were observed in the between-group analysis, researchers would commonly interpret the result based solely on the p-value of the between-group analysis and report that the intervention effect was absent since it did not present statistical significance (p > 0.05).
Nevertheless, the researcher should appreciate that p-values will depend on the sample size, correct statistical and causal models, and absence of bias and confounding data.19 For example, our small sample size (n = 15 in each group) and low study power tend to refute the absence of an intervention effect between groups displayed in traditional statistical tests when further analyzed using secondary statistical tools beyond NHST. To determine the number of participants required to reduce type II error (eg, failure to observe a difference between groups despite an actual difference being present), a power analysis (eg, beta value > 0.80) is usually performed to determine minimum amount of participants needed in each experimental group to refute the null hypothesis (eg, no differences between groups). Considering the observed difference of 0.93 kg between the experimental groups at the post-time point, standard deviation (SD) within each group of 1.6, and sample size of 30, the sample size necessary to achieve an actual power of 0.80 for HGS in our hypothetical study was 40 participants (eg, 20 participants in each group).20 However, power analysis is part of null hypothesis significance test (NHST) and has the associated problems of NHST with over-emphasis on attaining statistical significance.21 Even though it is understandable knowing how many participants a researcher needs to achieve an appropriate level of power, factors such as participant attrition and dropouts quickly reduce power during the study.22 It is also suggested that if power analysis calls for 40 participants, the researcher should at least attempt to include a sample of 50 participants, and possibly even more.22 Depending on the scenario of the researcher and the populations investigated, this may be a difficult task, and dropouts (a common occurrence during research) are inevitable Considering this, it is possible to finish the study with 30 participants (as in this example provided), and a real effect can still be present despite NHST suggesting otherwise. However, to find this real effect, researchers should use a combination of secondary statistical analyses to reveal what p values cannot show.
In the worst-case scenario, if the interpretation of our theoretical study was based only on conventional statistical approaches, it would indeed have the capacity to produce some harm to older women who would be, incorrectly, discouraged from practicing Pilates.19 Conversely, if the researchers in our example considered more comprehensive statistical thinking,23 they may wonder how precise the estimate of their analysis was to conclude a lack of between-group differences. Furthermore, would the interpretation of the results be maintained if another statistical model such as Bayesian analysis and secondary statistical approaches were applied alongside the p-value approach?
One of the important criticisms of contemporary practice in statistics is the evaluation of the practical importance of the results.24 One of the disadvantages of NHST is that the significance level does not elucidate the importance of an effect. To analyze the clinical importance of the p-value, effect size (ES) estimates can be obtained from the results. However, readers and researchers should consider the high variable measures of effect sizes for differences between group designs, correlations, ANOVA, types of regression, and structural equation models and if the ES is correct for bias.25 For example, Hedges g ES corrects for bias in small sample studies, but Cohens’d does not correct.26 Thus, using Cohen’s in a small sample study overestimates the ES. Also, for ANOVA designs with low sample size, we provide omega squared (ω2) instead of eta squared (n2).26
Thus, if we calculate the effect size using the following formula (see Supplementary Table 2):
ES = (Pre-test mean – Post-test mean)/Pre-test SD24
ES can further be stratified into arbitrary values that attempt to classify the magnitude of treatment effects. For untrained participants, it is common to use the following ES guidelines: <0.50 (trivial), 0.50–1.25 (small), 1.25–1.90 (moderate), and >2.0 (large).24
We obtained the following results when utilizing this equation and inputting our data from the hypothetical study: ES of 1.16 for PT group and an ES of 0.46 for CON. Despite a lack of refuting the null hypothesis, a greater understanding of the magnitude of treatment effects can be inferred when ES is reported in conjunction with p-values. For example, stating “a superior ES (1.16, small) for PT group compared to CON (0.46, trivial) was observed although p > 0.05 for between-group differences” is a more comprehensive way to report results rather than simply reporting “no significant different between groups (p > 0.05) were observed”. Describing the ES provides further details regarding the potential clinical importance of the intervention despite a lack of p-value significance. This is particularly relevant as the ES in this example as the post-test means of PT group were greater than 1 SD from the pre-test means, whereas in CON, the post-test means were only 0.46 SD above the pre-test means. Reporting ES in conjunction with p-values allows the clinician to analyze the study results to determine the potential clinical significance of PT over CON.
However, as a reader, you can say that the applied ES was wrong (and statistically speaking you are right). Considering the kind of study design and statistical analysis applied (ANOVA), the type of ES that provides a better estimate for low sample size is the omega squared (ω2). When results are interpreted by omega squared analysis, the ES is small (0.01) for group*time interaction and medium for time effect (0.13).10,27 It is important to note that different thresholds for effect size exist and will depend on the statistical approach used.27
Furthermore, to minimize type II error in comparisons, an independent t-test was applied to verify possible differences among delta (Δ) change between groups, which were calculated as follows: Δ = post-training minus baseline. Surprisingly, a p = 0.001 was observed between groups when using this approach (see the Supplementary Table 2), with a higher Δ change observed for PT (1.70 ± 0.75, 95% CI 1.28–2.11) compared to CON (0.70 ± 0.52, 95% CI 0.40–0.99). In addition, when using the effect size calculations for an independent t-test (Cohen’s d), an ES value of 1.54 (large effect size) was observed.28 Thus, this means that a large effect (difference between groups) of the intervention probably exists.
One may consider the use of confidence intervals (CI) as displayed in the previous paragraph having the advantage of providing information about both precision and statistical significance. However, if the CIs between two different groups overlap, the effects are usually interpreted as statistically indistinguishable29 and that may not always be realistic in human trials.29 A statistically distinct effect (eg, p = 0.006) may sometimes have overlapping CIs29,30 despite refuting the NHST. Although the method of examining CI is simple and convenient, it should not be used for formal significance testing.30 For these reasons, data analysis should not end with calculating a p-value and CIs when other secondary analysis can be jointly used to further inform the interpretation of the study results.
Secondary Statistical Analyses
Minimal Clinical Important Difference
Researchers may prefer to use only the p-values because they provide a simple and objective answer as a “go or not go” to determine the importance of a finding.31 However, the p-value may not be helpful in a study with a low sample size (as in our example). Thus, one must focus only on the possible clinical significance of the findings.31 Given the need to assess the perceived benefit of an intervention based on individual/group improvements, the discussion about the minimal clinical important difference (MCID) has emerged as an alternative to analyze and define a specific threshold to serve as a treatment goal.32 The MCID can be defined as the minimum value required to be reached in the absence of side effects or high costs for a clinically important difference to occur.
The MCID has some practical uses in geriatric and rehabilitation research. It is necessary to stipulate the smallest sample to detect the MCID and verify whether the interpreted data have an effect that exceeds the MCID and justifies the application of the intervention.33 Thus, a change greater than the established MCID limit can be considered clinically significant.32,34
The MCID can be established based on the evidence of a clinically relevant change (eg, reduction of 10 mmHg in systolic blood pressure because this change is associated with a 34% reduction in stroke)35 or can be calculated when an evidence-based MCID is not available.2
In this case, since no clinical criteria for handgrip strength changes exist and considering the pre-exercise levels of handgrip strength, responders were classified based on a conservative effect of 0.8 (large effect) multiplied by the standard deviation. This method is recommended when evidence-based MCID is not available (eg, MCIDESTIMATE = ES*SDGROUP).36
Few studies in the literature have statistically estimated whether an intervention causes inter-individual differences in trainability.2 The use of the MCID is important for assessing inter-individual variability, reducing the risk of misclassifying participants who did not benefit from an intervention independently of a lack of statistical significance.2
To identify octogenarian participants who favorably responded to the treatment, denominated ‘responders’, we should identify participants whose observed change in a given outcome exceeds the MCID after accounting for random measurement error (here calculated as a technical error [TE]).2 This procedure is considered a conservative threshold because it considers TE and MCID, lowering the calculated response rates.2 The TE is a statistical procedure that considers the measurement error of the test or the aggregate of factors that collectively affect the true value of the measurement, including variances among technicians and ordinary day-to-day biological variations of the participant.
Using the Supplementary File (see Supplementary material 2), the calculated MCID for HGS was 1.18 kg for both groups (Figure 1), and the TE was 0.56 kg. Therefore, every participant who achieved an increment of HGS higher than or equal to 1.18 kg is considered a responder to the training, since the expected clinically significant change was achieved.
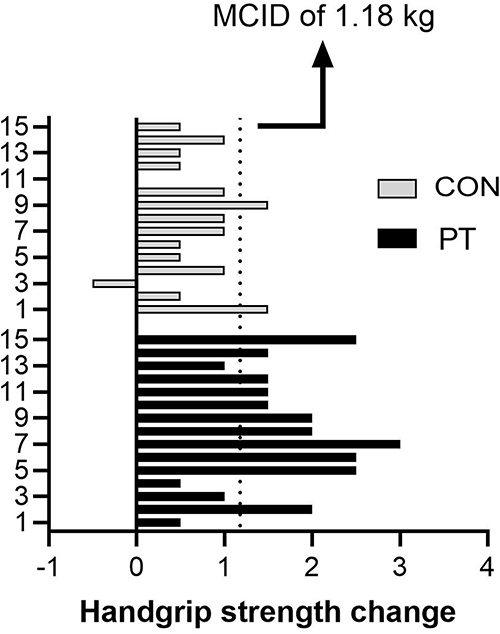 |
Figure 1 Minimal Clinical Important Difference (MCID) For Handgrip Strength Between Pilates Training (PT) And Control Group (CON). Abbreviations: MCID, minimal clinical important difference; CON, control group; PT, Pilates training. |
For responsiveness based on MCID, 12 participants in the PT group reached the MCID for HGS, while in CON, two participants reached the MCID. Therefore, our non-significant finding must be seen in the light of the compelling evidence that HGS is a risk marker for incident cardiovascular disease in many countries and populations.37 Reinforcing that HGS is a vital sign in this age group, among men, a 1kg increase in HGS is associated with a 0.07 second decrease in timed up and go test and a 1% decrease in chair rise time. For women, a 1kg increase is associated with a 0.13 second decrease in timed up and go test and a 1% decrease in chair rise time.38 Considering the above, although findings based on no statistical significance between the group are routinely taken as evidence of no effect, a clinical significance can have a “non-significant” p-value when a simple, underused but informative secondary statistical tool such as the MCID is used in conjunction with NHST. Thus, the researcher must understand that conclusions about practical importance based on the statistical significance or lack thereof need to be re-evaluated.
Magnitude-Based Inference
Another secondary analysis that may be performed in conjunction with the standard hypothesis test is the magnitude-based inference (MBI).39 The MBI can be clinical or non-clinical.40 The clinical MBI is determined based on CI concerning a previously calculated MCID (eg, 1.18 kg), for example, those calculated for PT and CON in our hypothetical study (see Supplementary Material 2). Thus, any increase or decrease larger than the MCID is considered relevant, while all changes smaller than the MCID are too small to be of practical relevance (eg, trivial) (Figure 2).
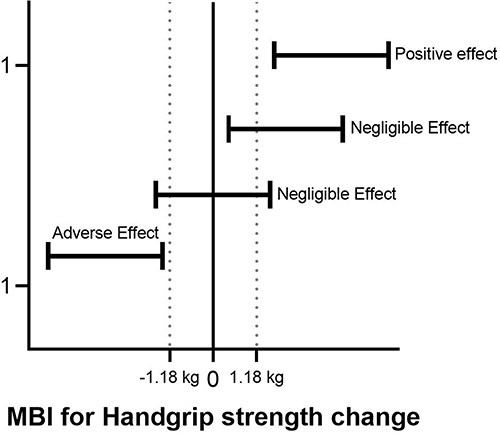 |
Figure 2 Magnitude-Based Inference (Mbi) For Handgrip Strength. |
According to the MBI approach, the results are classified into three categories of effect size, harmful (or adverse effect), trivial (or negligible effect), and beneficial (positive effect). In the PT group, seven individuals presented responses in the direction of improvement, and eight displayed negligible changes for HGS, while in the CON, 15 individuals showed negligible differences for HGS (see Supplementary Material 2). Although the use of the MBI seems very promising in the rehabilitation area, especially to avoid common errors of traditional statistical tests, MBI might increase the risk of false-positive results, and some statistics experts have raised concerns regarding the validity of the MBI.40–44 Thus, using the clinical MBI with a fully Bayesian analysis might be an option to mitigate the risks of false-positive results because it considers a previously calculated MCID.
Bayesian Statistical Analysis
One of the main differences between frequentist and Bayesian analysis is that the latter is more interested in the probability that PT is superior to CON for improving handgrip muscle strength (Bayesian probability) rather than the probability of obtaining certain data assuming the interventions are equal (frequentist null hypothesis).4,11–14,45 Bayesian analysis returns no p-values and alpha levels but reports the Bayes Factor values (thermometer for the intensity of the evidence). Bayes factor analysis can be considered anecdotal, moderate, strong, very strong and extreme relative evidence for a hypothesis (alternative or null) and may facilitate scientific communication (Figure 3).4,11–14,46 Bayes factor is adopted by the Jeffrey’s Amazing Statistics Program (JASP), a free multi-platform open-source statistic package.13
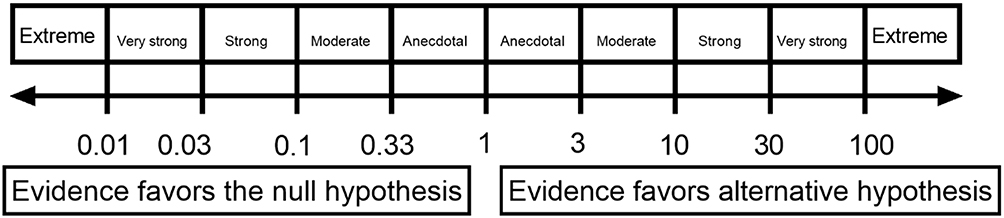 |
Figure 3 Jasp Classification Scheme For The Bayes Factor (BF10). Abbreviation: JASP: Jeffrey’s Amazing Statistics Program. |
As we did for frequentist analysis, when applying an analogous Bayesian test, assumptions of normality and homogeneity of variance should be met for the data. Using a Bayesian Two-Way ANOVA for HGS, we determined that the data was best represented by a model that included only time. The Bayes factor was (BF10) 13.78, indicating decisive evidence in favor of this model compared to the null model. Also, the Bayes factor for group was (BF10) 0.40, indicating anecdotal evidence compared to the null model. As such, post hoc comparisons were subsequently performed. For time, the adjusted posterior shows that there is strong evidence for a difference between post-exercise and baseline (posterior odds of 13.78). Additionally, for groups, the adjusted posterior shows that there is anecdotal evidence in favor of null hypothesis between PT and CON (posterior odds of 0.40). Refer to Table 1.
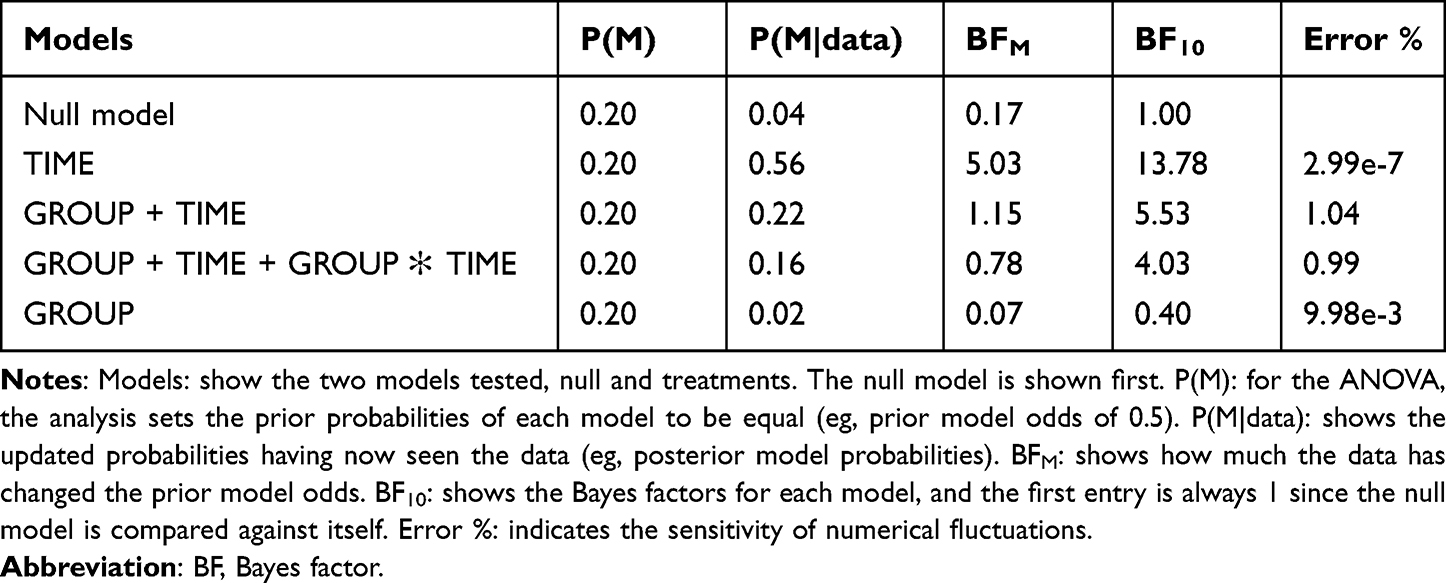 |
Table 1 Model Comparison |
Now, performing a Bayesian independent Sample t-test, the data are 103 times more likely under the alternative hypothesis (H1) than the null hypothesis (Figure 4). The dashed line shows the prior distribution and the solid line the posterior distribution (based on the dataset). The posterior distribution is shifted to the right over large positive effect sizes. Each of the distributions has a grey dot at the 0.0 effect size. If the dot on the prior distribution is higher than the one on the posterior distribution, then the Bayes factor supports the alternative hypothesis.11–14 Thus, following intervention, female octogenarians increased on average by 1.17 kg HGS compared to CON who increased by 0.70 kg. A two-sided analysis revealed a Bayes factor (BF10) that the data were 103 times more likely under the alternative than the null hypothesis, displaying extreme evidence in favor of the alternative hypothesis than the null hypothesis.
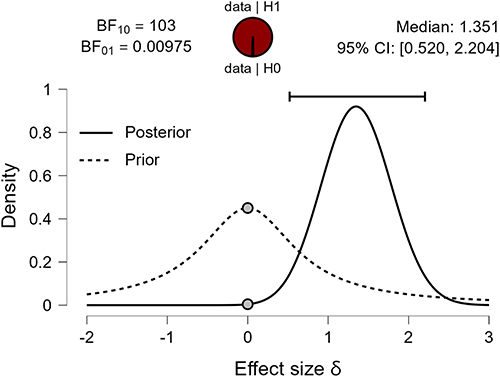 |
Figure 4 Bayesian Independent Sample T-Test. Note: BF = Bayes factor. Bayes factors supporting the alternative/null hypothesis (BF10) and null/alternative hypothesis (BF01). The pizza plot distribution shows the proportion of evidence for the H1 (red) and H0 (white) hypothesis. In this data set example, the pizza plot is completely red. The median effect size of 1.351 and 95% credible intervals are also shown. |
The following figure (Figure 5) shows a range of prior widths, which in this case are relatively consistent and do not greatly change the BF10 value with all values being over 100. Therefore, it can be concluded that this test is robust to changes in the prior width (Bayes factor robustness check).
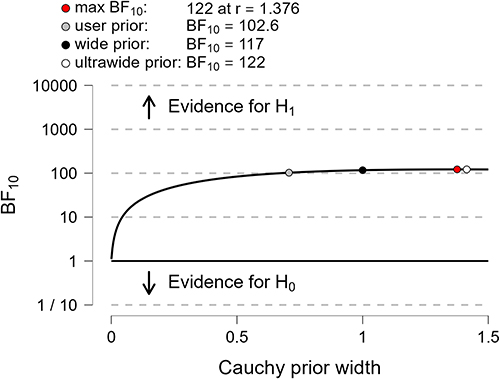 |
Figure 5 Bayes Factor Robustness Test. |
Considering this point of view, our goal is not to suggest that the appropriate path to publication is choosing an inferential method that potentially misrepresents weak evidence as strong evidence.40 Instead, our hypothetical study is an example of an underpowered study that could have resulted from several logistical or financial constraints commonly faced by researchers in real-world scientific life. Therefore, it would need to be carefully interpreted and acknowledged within the limitations section. Thus, the purpose is not to move researchers in the rehabilitation field away from p-values but to stimulate the use of statistical significance tests alongside Bayesian analysis,4,11–15 secondary analyses including MCID and MBI methods and many others.47
As researchers, we must present information and analyses of statistical results as transparently as possible to allow others to make an informed decision about findings. In addition, good statistical thinking involves understanding the phenomenon under study, interpreting results in context and complete reporting, and correctly understanding what data summaries mean.29 Furthermore, we believe that researchers must understand that no single index (eg, p-value) should substitute for scientific rationale.31 Thus, we should move further away from conclusions such as “The results of this study were unable to demonstrate significant differences between the PT and CON groups” to “Although no differences were displayed between the PT and CON groups, according to secondary statistical analysis [MCID and MBI], a higher proportion of clinically relevant changes were observed in the PT group compared to the CON”. Alternatively, according to delta analysis, PT was better than the control group to improve HGS with a large effect (Cohen’s d – for frequentist analysis) and a Bayes factor (BF10) that the data were 103 times more likely under the alternative than the null hypothesis, displaying extreme evidence in favor of alternative hypothesis than the null hypothesis.
Conclusion
Some may argue that the use of Bayesian and additional secondary analyses such as the MCID and MBI might represent the practice of manipulating data to produce effects that do not exist, like a “p-hacking” or “clinical-hacking”. However, to improve statistical practice in the geriatric and rehabilitation fields, we still must address statistical significance testing, alongside Bayesian analysis and other secondary methods to complement, not substitute, the statistical analysis, as in our previous study.48 Also, Bayesian analysis, for example, provides richer information for hypothesis testing, parameter estimation and is equally valid for all sample sizes.12 Otherwise, continued use of NHST without secondary statistical approaches has the potential to harm the field of geriatric and rehabilitation by causing researchers to draw overly pessimistic conclusions from their data, possibly contra-indicating an intervention with promising clinical results. We acknowledge that the debate regarding the use of new forms of statistical analysis such as Bayesian analysis and secondary data analysis and interpretation is ongoing, likely necessary, and should continue to be studied in future clinical trials. In addition, the findings of the present study demonstrate the application of different statistical tools rather than presenting promising results from an actual empirical study. However, our article serves as an introduction and a starting point of making the case to change statistical analytical practices in geriatric and rehabilitation fields for the better.
Data Sharing Statement
Additional/supporting files will be provided by the corresponding author upon reasonable request.
Acknowledgments
This research was funded by the Coordenação de Aperfeiçoamento de Pessoal de Nível Superior—Brasil (CAPES)—Finance Code 001, Fundação de Apoio a Pesquisa do Distrito Federal (FAPDF) (Grant Number 00193-00001613/2023-11), and the National Council for Scientific and Technological Development (CNPq; process numbers 141130/2023-7; 310269/2021-0; 402816/2023-4). The first author would like to thank his family and in particular his mother Rita Cunha and his son Nicolas Cunha.
Disclosure
The authors report no conflicts of interest in this work.
References
1. Mann TN, Lamberts RP, Lambert MI. High responders and low responders: factors associated with individual variation in response to standardized training. Sports Med. 2014;44:1113–1124. doi:10.1007/s40279-014-0197-3
2. Bonafiglia JT, Preobrazenski N, Gurd BJ. A systematic review examining the approaches used to estimate interindividual differences in trainability and classify individual responses to exercise training. Front Physiol. 2021;12:1–18. doi:10.3389/fphys.2021.665044
3. Wasserstein RL, Schirm AL, Lazar NA. Moving to a world beyond “p <0.05”. Am Stat. 2019;73(sup1):1–19. doi:10.1080/00031305.2019.1583913
4. Fornacon-Wood I, Mistry H, Johnson-Hart C, Faivre-Finn C, O’Connor JPB, Price GJ. Understanding the differences between bayesian and frequentist statistics. Int J Radiat Oncol Biol Phys. 2022;112(5):1076–1082. doi:10.1016/j.ijrobp.2021.12.011
5. Salsburg D. The Lady Tasting Tea: How Statistics Revolutionized Science in the Twentieth Century. Macmillan; 2001.
6. Field AP. Discovering Statistics Using IBM SPSS Statistics. sage; 2018.
7. Berg KE, Latin RW. Essentials of Research Methods in Health, Physical Education, Exercise Science, and Recreation. Lippincott Williams & Wilkins; 2008.
8. Wasserstein RL, Lazar NA. ASA Statement on Statistical Significance and p-values. In: The Theory of Statistics in Psychology. Springer International Publishing; 2020:1–10. doi:10.1007/978-3-030-48043-1_1
9. Perezgonzalez JD, Frías-Navarro MD. Retract p <0.005 and propose using JASP, instead. F1000Res. 2017;6:2122. doi:10.12688/f1000research.13389.1
10. Goss-Sampson M. Statistical Analysis in JASP - a Guide for Students. JASP; 2019.
11. Quintana DS, Williams DR. Bayesian alternatives for common null-hypothesis significance tests in psychiatry: a non-technical guide using JASP. BMC Psychiatry. 2018;18(1):178. doi:10.1186/s12888-018-1761-4
12. Wagenmakers EJ, Marsman M, Jamil T, et al. Bayesian inference for psychology. Part I: theoretical advantages and practical ramifications. Psychon Bull Rev. 2018;25(1):35–57. doi:10.3758/s13423-017-1343-3
13. Goss-Sampson M, van Doorn J, Wagenmakers EJ. Bayesian Inference in JASP: A Guide for Students. Jeffrey’s Amazing Statistics Program; 2020.
14. Kelter R. Bayesian alternatives to null hypothesis significance testing in biomedical research: a non-technical introduction to Bayesian inference with JASP. BMC Med Res Methodol. 2020;20(1). doi:10.1186/s12874-020-00980-6
15. van Doorn J, van den Bergh D, Böhm U, et al. The JASP guidelines for conducting and reporting a Bayesian analysis. Psychon Bull Rev. 2021;28(3):813–826. doi:10.3758/s13423-020-01798-5
16. Swinton PA, Hemingway BS, Saunders B, Gualano B, Dolan E. A statistical framework to interpret individual response to intervention: paving the way for personalized nutrition and exercise prescription. Front Nutr. 2018;5:1–14. doi:10.3389/fnut.2018.00041
17. da Cunha Nascimento D, Neto de S, Saraiva B, et al. Advancements and critical steps for statistical analyses in blood pressure response to resistance training in hypertensive older women: a methodological approach. Blood Press Monit. 2021;26(2):135–145. doi:10.1097/MBP.0000000000000505
18. laerd statistics. Two-way ANOVA using SPSS. Statistical Tutorials Software Guides Statistics; 2017. Available from: https://statistics.laerd.com/.
19. Stang A, Poole C, Kuss O. The ongoing tyranny of statistical significance testing in biomedical research. Eur J Epidemiol. 2010;25(4):225–230. doi:10.1007/s10654-010-9440-x
20. Faul F, Erdfelder E, Lang AG, Buchner A. G*Power 3: a flexible statistical power analysis program for the social, behavioral, and biomedical sciences. Behav Res Methods. 2007;39(2):175–191. doi:10.3758/BF03193146
21. Nakagawa S, Cuthill IC. Effect size, confidence interval and statistical significance: a practical guide for biologists. Biol Rev. 2007;82(4):591–605. doi:10.1111/j.1469-185X.2007.00027.x
22. Beck TW. The importance of a priori sample size estimation in strength and conditioning research. J Strength Cond Res. 2013;27(8):2323–2337. doi:10.1519/JSC.0b013e318278eea0
23. Ferrer RA, Ellis EM. Moving beyond categorization to understand affective influences on real world health decisions. Soc Personal Psychol Compass. 2019;13(11):1–16. doi:10.1111/spc3.12502
24. Rhea MR. Determining the magnitude of treatment effects in strength training research through the use of the effect size. J Strength Cond Res. 2004;18(4):918–920. doi:10.1519/14403.1
25. Fey CF, Hu T, Delios A. the measurement and communication of effect sizes in management research. Manag Organ Rev. 2023;19(1):176–197. doi:10.1017/mor.2022.2
26. Lakens D. Calculating and reporting effect sizes to facilitate cumulative science: a practical primer for t-tests and ANOVAs. Front Psychol. 2013;4:1–12. doi:10.3389/fpsyg.2013.00863
27. Serdar CC, Cihan M, Yücel D, Serdar MA. Sample size, power and effect size revisited: simplified and practical approaches in pre-clinical, clinical and laboratory studies. Biochem Med (Zagreb). 2021;31(1):27–53. doi:10.11613/BM.2021.010502
28. Cohen J. Statistical Power Analysis for the Behavioral Sciences.
29. Sainani KL. A closer look at confidence intervals. PM&R. 2011;3(12):1134–1141. doi:10.1016/j.pmrj.2011.10.005
30. Schenker N, Gentleman JF. On judging the significance of differences by examining the overlap between confidence intervals. Am Stat. 2001;55(3):182–186. doi:10.1198/000313001317097960
31. Sainani KL. Clinical versus statistical significance. PM&R. 2012;4(6):442–445. doi:10.1016/j.pmrj.2012.04.014
32. Copay AG, Subach BR, Glassman SD, Polly DW, Schuler TC. Understanding the minimum clinically important difference: a review of concepts and methods. Spine J. 2007;7(5):541–546. doi:10.1016/j.spinee.2007.01.008
33. Wright JG. The minimal important difference: who’s to say what is important? J Clin Epidemiol. 1996;49(11):1221–1222. doi:10.1016/S0895-4356(96)00207-7
34. Vet De HCW, Ostelo RW, Terwee CB, et al. Minimally important change determined by a visual method integrating an anchor-based and a distribution-based approach. Qual Life Res. 2007;16:131–142. doi:10.1007/s11136-006-9109-9
35. Lawes CMM, Bennett DA, Feigin VL, Rodgers A. Blood pressure and stroke: an overview of published reviews. Stroke. 2004;35(3):776–785. doi:10.1161/01.STR.0000116869.64771.5A
36. Samsa G, Edelman D, Rothman ML, Williams GR, Lipscomb J, Matchar D. Determining clinically important differences in health status measures: a general approach with illustration to the health utilities index mark II. Pharmacoeconomics. 1999;15(2):141–155. doi:10.2165/00019053-199915020-00003
37. Leong DP, Teo KK, Rangarajan S, et al. Prognostic value of grip strength: findings from the Prospective Urban Rural Epidemiology (PURE) study. Lancet. 2015;386:9990):266–273. doi:10.1016/S0140-6736(14)62000-6
38. Stevens PJ, Syddall HE, Patel HP, Martin HJ, Cooper C, Aihie Sayer A. Is grip strength a good marker of physical performance among community-dwelling older people? J Nutr Health Aging. 2012;16(9):769–774. doi:10.1007/s12603-012-0388-2
39. Hopkins WG, Batterham AM. Error rates, decisive outcomes and publication bias with several inferential methods. Sports Med. 2016;46(10):1563–1573. doi:10.1007/s40279-016-0517-x
40. Lohse KR, Lohse KR, Sainani KL, et al. Systematic review of the use of “magnitude-based inference” in sports science and medicine. PLoS One. 2020;15(6 June):1–22. doi:10.1371/journal.pone.0235318
41. Sainani KL, Lohse KR, Jones PR, Vickers A. Magnitude-based Inference is not Bayesian and is not a valid method of inference. Scand J Med Sci Sports. 2019;29(9):1428–1436. doi:10.1111/sms.13491
42. Nevill AM, Williams AM, Boreham C, et al. Can we trust “Magnitude-based inference”? J Sports Sci. 2018;36(24):2769–2770. doi:10.1080/02640414.2018.1516004
43. Welsh AH, Knight EJ. “Magnitude-based Inference” A statistical review. Med Sci Sports Exerc. 2015;47(4):874–884. doi:10.1249/MSS.0000000000000451
44. Curran-Everett D. Magnitude-based inference: good idea but flawed approach. Med Sci Sports Exerc. 2018;50(10):2164–2165. doi:10.1249/MSS.0000000000001646
45. Kruschke JK. Bayesian analysis reporting guidelines. Nat Hum Behav. 2021;5(10):1282–1291. doi:10.1038/s41562-021-01177-7
46. Jeffreys H. Theory of Probability.
47. Blume JD, Greevy RA, Welty VF, Smith JR, Dupont WD. An Introduction to Second-Generation p-values. American Statistician. 2019;73(sup1):157–167. doi:10.1080/00031305.2018.1537893
48. Almeida da IS, Souza Andrade L, Sousa AMM, et al. The effect of mat pilates training combined with aerobic exercise versus mat pilates training alone on blood pressure in women with hypertension: a randomized controlled trial. Phys Ther. 2022:1–5. doi:10.1093/ptj/pzab258
 © 2024 The Author(s). This work is published and licensed by Dove Medical Press Limited. The full terms of this license are available at https://www.dovepress.com/terms.php and incorporate the Creative Commons Attribution - Non Commercial (unported, v3.0) License.
By accessing the work you hereby accept the Terms. Non-commercial uses of the work are permitted without any further permission from Dove Medical Press Limited, provided the work is properly attributed. For permission for commercial use of this work, please see paragraphs 4.2 and 5 of our Terms.
© 2024 The Author(s). This work is published and licensed by Dove Medical Press Limited. The full terms of this license are available at https://www.dovepress.com/terms.php and incorporate the Creative Commons Attribution - Non Commercial (unported, v3.0) License.
By accessing the work you hereby accept the Terms. Non-commercial uses of the work are permitted without any further permission from Dove Medical Press Limited, provided the work is properly attributed. For permission for commercial use of this work, please see paragraphs 4.2 and 5 of our Terms.