")
Back to Journals » Clinical Ophthalmology » Volume 8
Influence of automated disc margin determination on Stratus OCT optic nerve head measurements
Authors de Camargo A, Melo Jr L, Hirai F, Tavares I
Received 8 October 2013
Accepted for publication 3 December 2013
Published 5 March 2014 Volume 2014:8 Pages 493—497
DOI https://doi.org/10.2147/OPTH.S55615
Checked for plagiarism Yes
Review by Single anonymous peer review
Peer reviewer comments 4
André Soares de Camargo, Luiz Alberto Soares Melo Jr, Flavio Eduardo Hirai, Ivan Maynart Tavares
Glaucoma Service, Department of Ophthalmology and Visual Sciences, Federal University of São Paulo, Paulista Medical School, São Paulo, Brazil
Purpose: To analyze the influence of manual correction of the automatically determined edge of the optic nerve head (ONH) in optic disc measurements in cases in which the optical coherence tomography did not identify the disc limits correctly.
Methods: The study included 127 eyes from 127 consecutive patients with glaucoma, suspects, and healthy individuals. In a retrospective analysis, eyes that underwent testing with the Stratus OCT (software version 4.0, Carl Zeiss Meditec, Dublin, CA, USA) Fast Optic Disc protocol were evaluated. Forty-seven eyes in which either the manual assignment was not necessary or the signal strength was below six were excluded. After image acquisition and processing, one expert examiner manually corrected the determination of the edge of the ONH, identified as the end of the retinal pigment epithelium/choriocapillaris complex. Disc area, cup area, rim area, and cup/disc area ratio results were compared before and after the optic disc margin manually corrected determination. Paired t-test was performed to evaluate the differences, and Bland–Altman plots were used to display the relationships between measurements.
Results: Eighty eyes from 80 individuals were included in the analyses. No statistically significant difference (P=0.538) was found when analyzing results obtained with automated and manual determination of rim area (mean ± standard deviation; 1.30±0.45 mm2 and 1.29±0.39 mm2, respectively). Cup area (1.39±0.58 mm2 and 1.31±0.55 mm2, respectively), cup/disc area ratio (0.50±0.16 mm2 and 0.49±0.15 mm2, respectively), and disc area results (2.69±0.55 mm2 and 2.60±0.51 mm2, respectively) were significantly different.
Conclusion: The Stratus OCT ONH Report results were little influenced when optic disc limits were manually determined. Therefore the standard automated Stratus OCT disc margin assignment is adequate, and manual correction is not necessary.
Keywords: optical coherence tomography, optic nerve head, glaucoma, diagnosis
Introduction
Optic nerve head (ONH) evaluation is crucial for the diagnosis of glaucoma. Qualitative analysis is performed by fundus biomicroscopy and photography of the ONH. Quantitative assessment can be performed through imaging tests, such as confocal scanning laser ophthalmoscopy (CSLO) and optical coherence tomography (OCT).1,2 It has the advantage of providing objective data and, therefore, reducing interobserver variability.3–5 OCT is an imaging modality that employs near-infrared light to create cross-sectional images of the retina and optic nerve, thereby allowing analysis of the ONH, macula, and retinal nerve fiber layer (RNFL).6 Although OCT has been used, for the most part, for the assessment of the RNFL thickness, the Stratus OCT is also capable of providing measurements of ONH topography and macular thickness.1,7
The purpose of this study was to analyze the influence of manual correction of the automatically determined edge of the ONH in optic disc measurements in cases in which the OCT did not identify the disc limits correctly.
Methods
Participants
This study was a retrospective analysis of eyes that underwent testing with the Stratus OCT (software 4.0, Carl Zeiss Meditec, Dublin, CA, USA) Fast Optic Disc protocol as part of a cohort study conducted at the Glaucoma Service of the Federal University of São Paulo. Eyes with either tilted disc or extensive peripapillary atrophy were excluded from the analyses. The institutional review board approved all protocols, and methods described complied with the tenets of the Declaration of Helsinki.
Procedures
OCT is a high resolution reproducible imaging modality. OCT was originally designed to evaluate retinal and RNFL thickness, but recent software enhancements also permit ONH analysis. The measurement beam reflected light source is compared with the reflectance of a reference beam reflected from a reference mirror at a known position to determine the thickness of the retina. An edge detection algorithm is used to define the posterior border of the RNFL (the anterior border is defined by the large difference in reflectance along the vitreoretinal interface).8 Detailed descriptions of the principles of OCT have been published previously. 9–11
ONH scans are composed of six radial scans in a spoke-like pattern, centered on the ONH and with each radial scan spaced 30 degrees from one to another. Each radial scan included 128 measuring points in OCT 3. To fill the gaps between the scans the machine utilizes interpolation. The machine automatically determines the edge of the ONH as the end of the retinal pigment epithelium/choriocapillaris complex.1 After image acquisition and processing, one expert examiner manually corrected the determination of the edge of the ONH.
Statistical analysis
Paired t-test was performed to evaluate the differences, and Bland–Altman plots were used to display the relationships between measurements. All statistical analyses were performed with commercially available software (Stata v.11, Stata Corp, College Station, TX, USA). The alpha level (type I error) was set at 0.05.
Results
One hundred and twenty seven consecutive patients with glaucoma, suspects, and healthy individuals submitted to examination with the Stratus OCT were selected. Forty-seven eyes were excluded because either the manual assessment was not necessary or the signal strength was below six. A total of 80 eyes from 80 patients were compared.
Rim area was the only parameter for which there was no statistically significant difference (P=0.538) between automated and manual determinations (mean ± standard deviation; 1.30±0.45 mm2 and 1.29±0.39 mm2, respectively) (Figure 1). Statistically significant differences were observed between automated and manual measurements for the cup area (P<0.0001; 1.39±0.58 mm2 and 1.31±0.55 mm2, respectively) (Figure 2), cup/disc area ratio (P=0.0001; 0.50±0.16 mm2 and 0.49±0.15 mm2, respectively) (Figure 3), and disc area (P=0.0002; 2.69±0.55 mm2 and 2.60±0.51 mm2, respectively) (Figure 4).
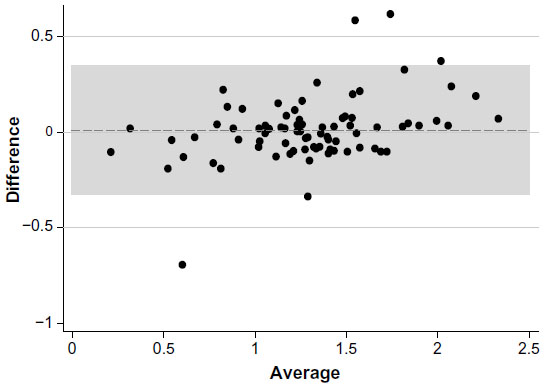 | Figure 1 Rim area. |
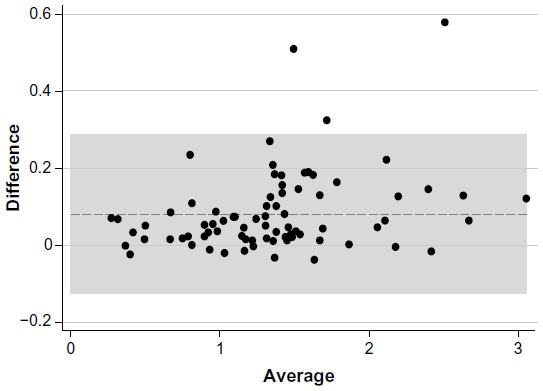 | Figure 2 Cup area. |
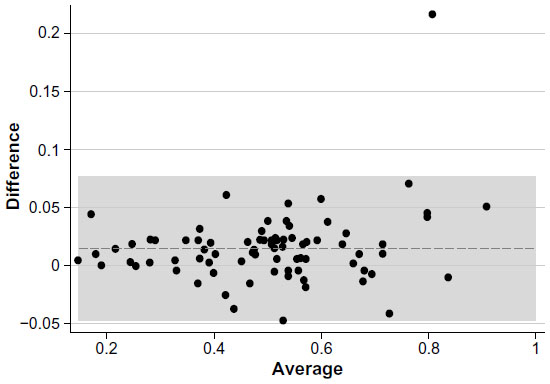 | Figure 3 Cup/disc area ratio. |
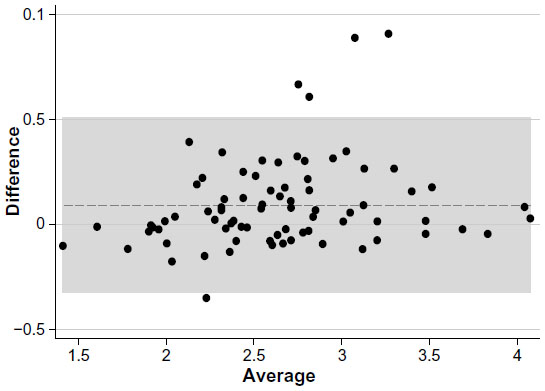 | Figure 4 Disc area. |
Discussion
ONH assessment can be performed by fundus biomicroscopy, stereophotographs, and imaging tests, such as CSLO and OCT. Measurements of ONH parameters are not directly comparable, with a suggestion that OCT provides the largest measurements.16 In normal adult populations, OCT measures the mean optic disc area as between 1.60 mm2 and 2.63 mm2. Ethnicity is a significant factor that changes the definition of normality for ONH parameters.16 Comparing the ability of subjective assessment of ONH and RNFL with objective measurements by Stratus OCT, HRT III, and GDx ECC, Vessani et al reported that the diagnostic ability of all imaging techniques showed better performance than subjective assessment of the ONH by general ophthalmologists, but not by a glaucoma expert.17
The Stratus OCT is mainly used to evaluate the peripapillary nerve fiber layer, but it is also able to assess parameters of the ONH. ONH scans are composed of six radial scans in a spoke-like pattern centered on the ONH and with each radial scan spaced 30 degrees from one another. The device, according to the end of the retinal pigment epithelium, automatically determines the edge of the ONH. However, some scans are often located outside the edge interpolated by the Stratus OCT, what could lead to measurement errors and misdiagnoses (Figure 5). The large amount of interpolation may explain the poor sensitivity of this instrument in detecting small localized changes in glaucoma.12
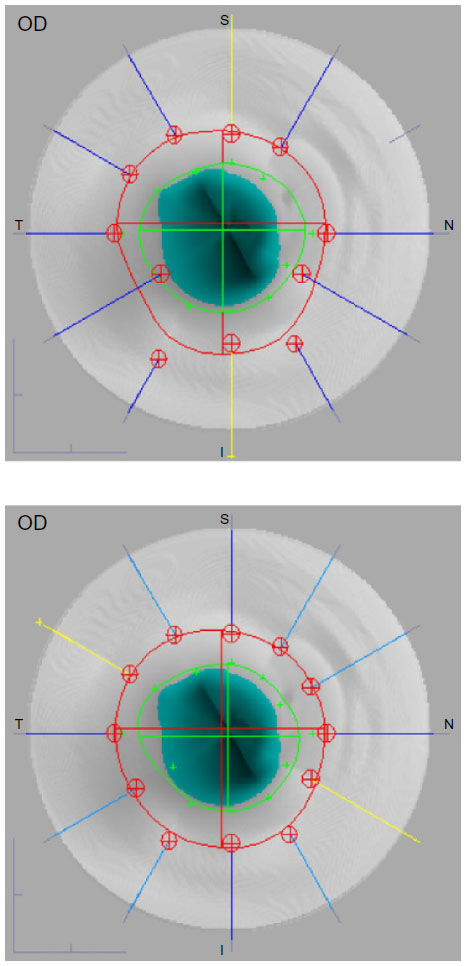 | Figure 5 Optical coherence tomography optic nerve head images with automatic (top) and manual (bottom) delimitation. |
Potential reasons for the incorrect automated determination of the edge of the ONH are optic disc tilting, peripapillary atrophy, or hyperpigmentation which are frequent in patients with high myopia. Melo et al reported that OCT, CSLO, and GDx are not useful to discriminate nonglaucomatous from glaucomatous subjects that have high myopia.18 The topographic measurements did not differ significantly between eyes of the manually corrected scans (“adjusted scans”) and the eyes that were qualified by automatic disc recognition (“automated scans”).13
Peripapillary atrophy is more frequently observed and is more extensive in patients with glaucoma when compared with normal individuals. A significant difference between OCT ONH results obtained by automated and manual disc margin determination was found in patients with peripapillary atrophy.14
Our study showed that there was no statistically significant difference between automated and manual determinations for the rim area parameter. All other measurements showed statistically significant differences, however, these were within the limits of variability of the device.15 Although cup/disc area ratio currently has good ability to discriminate between glaucomatous and normal eyes, our results show minimal differences between pre- and postmanual segmentation measurements that can be considered clinically irrelevant. The reason for the slight difference between the automated and manual OCT disc margin identification techniques may be due to interpolation of measurements between scans.1
In summary, the minimal difference between automated and manual Stratus OCT disc margin determination suggests that automated disc margin assignment is adequate, and sets an advantage of OCT over other devices.
Disclosure
None of the authors have any commercial interest regarding the present study.
References
Schuman JS, Wollstein G, Farra T, et al. Comparison of optic nerve head measurements obtained by optical coherence tomography and confocal scanning laser ophthalmoscopy. Am J Ophthalmol. 2003;135:504–512. | |
Wollstein G, Binnun E, Ben-Yosef N, Rozenman Y. Retinal thickness analyzer (RTA) imaging of a model eye and the optic nerve head. Comparison with Heidelberg Retina Tomograph measurements. In: Lemij H, Schulman JS, editors. The Shape of Glaucoma, Quantitative Neural Imaging Techniques. The Haag: Kugler Publications; 2000:193–212. | |
Varma R, Steinmann WC, Scott IU. Expert agreement in evaluating the optic disc for glaucoma. Ophthalmology. 1992;99:215–221. | |
Abrams LS, Scott IU, Spaeth G, Quigley HA, Varma R. Agreement among optometrists, ophthalmologists, and residents in evaluating the optic disc for glaucoma. Ophthalmology. 1994;101:1662–1667. | |
Wollstein G, Garway-Heath DF, Fontana L, Hitchings RA. Identifying early glaucomatous changes. Comparison between expert clinical assessment of optic disc photographs and confocal scanning ophthalmoscopy. Ophthalmology. 2000;107:2272–2277. | |
Gupta PK, Asrani S, Freedman SF, El-Dairi M, Bhatti MT. Differentiating glaucomatous from non-glaucomatous optic nerve cupping by optical coherence tomography. Open Neurol J. 2011;5:1–7. | |
Hoffmann EM, Bowd C, Medeiros FA, et al. Agreement among 3 optical imaging methods for the assessment of optic disc topography. Ophthalmology. 2005;112:2149–2156. | |
Bowd C, Zangwill LM, Medeiros FA, et al. Structure-function relationships using confocal scanning laser ophthalmoscopy, optical coherence tomography, and scanning laser polarimetry. Invest Ophthalmol Vis Sci. 2006;47:2889–2895. | |
Huang D, Swanson EA, Lin CP, et al. Optical coherence tomography. Science. 1991;254:1178–1181. | |
Hee MR, Izatt JA, Swanson EA, et al. Optical coherence tomography of the human retina. Arch Ophthalmol. 1995;113:325–332. | |
Huang D, Swanson EA, Lin CP, et al. Optical coherence tomography. Science. 1991;254:1178. | |
Medeiros FA, Zangwill LM, Alencar LM, et al. Detection of glaucoma progression with stratus OCT retinal nerve fiber layer, optic nerve head, and macular thickness measurements. Invest Ophthalmol Vis Sci. 2009;50:5741–5748. | |
Marsh BC, Cantor LB, WuDunn D, et al. Optic nerve head (ONH) topographic analysis by stratus OCT in normal subjects: correlation to disc size, age, and ethnicity. J Glaucoma. 2010;19:310–318. | |
Lai E, Wollstein G, Price LL, Paunescu LA, et al. Optical coherence tomography disc assessment in optic nerves with peripapillary atrophy. Ophthalmic Surg Lasers Imaging. 2003;34:498–504. | |
Paunescu LA, Schuman JS, Price LL, et al. Reproducibility of nerve fiber thickness, macular thickness, and optic nerve head measurements using Stratus OCT. Invest Ophthalmol Vis Sci. 2004;45:1716–1724. | |
Samarawickrama C, Hong T, Jonas JB, Mitchell P. Measurement of normal optic nerve head parameters. Surv Ophthalmol. 2012;57:317–336. | |
Vessani RM, Moritz R, Batis L, Zagui RB, Bernardoni S, Susanna R. Comparison of quantitative imaging devices and subjective optic nerve head assessment by general ophthalmologists to differentiate normal from glaucomatous eyes. J Glaucoma. 2009;18:253–261. | |
Melo GB, Libera RD, Barbosa AS, Pereira LM, Doi LM, Melo LA Jr. Comparison of optic disk and retinal nerve fiber layer thickness in nonglaucomatous and glaucomatous patients with high myopia. Am J Ophthalmol. 2006;142:858–860. |
 © 2014 The Author(s). This work is published and licensed by Dove Medical Press Limited. The full terms of this license are available at https://www.dovepress.com/terms.php and incorporate the Creative Commons Attribution - Non Commercial (unported, v3.0) License.
By accessing the work you hereby accept the Terms. Non-commercial uses of the work are permitted without any further permission from Dove Medical Press Limited, provided the work is properly attributed. For permission for commercial use of this work, please see paragraphs 4.2 and 5 of our Terms.
© 2014 The Author(s). This work is published and licensed by Dove Medical Press Limited. The full terms of this license are available at https://www.dovepress.com/terms.php and incorporate the Creative Commons Attribution - Non Commercial (unported, v3.0) License.
By accessing the work you hereby accept the Terms. Non-commercial uses of the work are permitted without any further permission from Dove Medical Press Limited, provided the work is properly attributed. For permission for commercial use of this work, please see paragraphs 4.2 and 5 of our Terms.