")
Back to Journals » Nutrition and Dietary Supplements » Volume 14
Is Fruit and Vegetable Intake Associated with Body Composition Among Pakistani Adolescents?
Authors Safdar NF , Murad AM, Jawed N, Inam S
Received 23 September 2021
Accepted for publication 6 January 2022
Published 25 March 2022 Volume 2022:14 Pages 1—9
DOI https://doi.org/10.2147/NDS.S340798
Checked for plagiarism Yes
Review by Single anonymous peer review
Peer reviewer comments 2
Editor who approved publication: Dr Chandrika J Piyathilake
Nilofer Fatimi Safdar, Anishta Mehdi Murad, Nida Jawed, Sumera Inam
School of Public Health, Dow University of Health Sciences, Karachi, Sindh, Pakistan
Correspondence: Nilofer Fatimi Safdar, School of Public Health, Dow University of Health Sciences, Karachi, Sindh, Pakistan, Tel +1 92 333 2279011, Email [email protected]
Background: Adequate fruit and vegetable consumption during childhood is essential in promoting healthy eating habits and can reduce the risk of obesity and non-communicable diseases in adulthood.
Aim: To determine the prevalence and association between fruit and vegetable (FV) intake and body composition among adolescents in Karachi, Pakistan.
Methods: This cross-sectional study was conducted from 2016 to 2018 among 537 adolescent students in six districts of Karachi. Demographics and fruits and vegetable intake were assessed using structured questionnaires, while body mass index (BMI) and body fat percentage (BF %) were measured using a bioelectric impedance scale. Association was determined using chi-square test, and logistic regression tests were conducted to calculate the risk of low FV with body composition.
Results: Out of 537 participants, inadequate intakes of FV (< 3 servings) were observed in 38.7% of adolescents. Low intake of FV was significantly associated with age > 15 years (adjusted odds ratio (AOR): 1.77, [95% CI: 1.53– 2.12]), female gender (AOR: 1.53, [95% CI: 1.04– 2.25]), having moderately high BF% (A. OR: 1.70, [95% CI: 1.64– 4.53]) and excessively high BF% levels (AOR: 3.63, [95% CI: 1.04– 12.62]). Determinants such as BMI, parent’s education level and parent’s occupation status were not found to be associated with low intakes of FV.
Conclusion: Low intake of fruits and vegetables may have implications on the nutritional status of adolescents. We recommend that focused measures be taken by public and private stakeholders to generate and implement policies to induce positive behavior changes towards the consumption of FV intake, leading a healthier lifestyle.
Keywords: malnutrition, non-communicable diseases, body fat percentage, Pakistan
Introduction
Low levels of fruits and vegetables (FV) intake are among the top 10 risk factors in the development of obesity and non-communicable diseases (NCDs) including cardiovascular diseases (CVDs), diabetes, cancers, and psycho-social disorders, causing approximately 2.635 million deaths per year.1,2 Risk of heart disease is found to be 4 times greater in those who consume a minimum of 1 serving of vegetables per week as compared to those who consume more than 1 serving of vegetables on a daily basis. Intake of 5 fruits and 3 vegetables per day can cause a 60–70% decrease in the development of risk factors for cardiac diseases.3
According to World Health Organization (WHO) and the Food and Agricultural Organization (FAO); a minimum of 400g of FV intake is required to maintain adequate body functions and obtain the essential amounts of vitamins and minerals.4 Yet, a global survey of 52 low- and middle-income countries (LMICs) showed that 77.6% of men and 78.4% of women in these countries do not consume the required amount of FV intake per day. Above all, Pakistan was found to be at the lowest end with an inadequate intake of FV in 99.3% of the population.5
Pakistan’s poor nutritional status can be reflected in the rising trend of obesity where 9.5% of the children under 5 years of age and 6.5% of the adolescents are obese.6 The increasing prevalence of obesity in Pakistan ranks among the top 10 countries. This makes it one of the few countries in the world with a double burden of disease.7 Adolescents in Pakistan consume poor dietary patterns with generally low consumption of FV, posing risk for diseases.8 The recent development of dietary guidelines for Pakistan recommends an intake of a minimum of 2–3 servings of FV each per day.9 However, there are yet to be strategic interventions to acknowledge and meet these recommendations.
Since adolescents in Pakistan make up a quarter of the population,10 preventive strategies, especially during childhood years, can influence morbidity caused by inadequate FV consumption. Inculcating healthy habits during childhood can play a significant role in the formation of a healthy lifestyle pattern as well as in the prevention of diseases that can create a massive impact on the quality of life.11 As Pakistan exceeds its numbers in terms of malnutrition and keeping in mind the little available evidence of the eating practices within the country, this study aimed to identify the prevalence of FV consumption and the association between FV intake and body composition among adolescents.
Materials and Methods
Study Design, Setting and Sample
The data for this cross-sectional study were collected between 2016 and 2018 and followed a multistage stratified sampling in lower-income secondary schools of Karachi, Pakistan. Karachi is divided into 6 districts and a total of 18 Union Councils (UCs) are scattered within them. In order to obtain a diverse sample from all over Karachi, 1 UC was randomly selected from each of the 6 districts and furthermore, 2 schools were identified from each of the chosen UCs. Principals of each school were provided detailed information about the study and requested for participation. Informed consent from parents of students from grades 7 to 10 of consented schools was obtained after the study was fully explained in the local language. A total of 540 students were given parental consent to participate. A trained research team with a background in nutrition visited these schools to administer questionnaires and to collect anthropometric measures. The study was conducted according to the guidelines laid down in the Declaration of Helsinki, and all procedures involving human subjects were approved by the Internal Review Board of Dow University of Health Sciences (DUHS), Karachi, Pakistan (IRB-345/DUHS/-16).
Questionnaire
Questionnaire was administered in face-to-face interviews by research assistants inside the schools during school hours. Information on participant’s sociodemographic and diet intake was taken. For analysis purposes, the participant’s age was categorized into ≤14 years and ≥15 years indicating early adolescence and late adolescence based on the systematic review on the dietary intake and practices of adolescents in low- and middle-income countries.12
Parents’ education was categorized from no formal education to having a graduate degree. Work status included whether the mother or father or both parents were the earning members of the family. Intake of FV was recorded using a food frequency questionnaire (FFQ), adapted from the Harvard Willet grid FFQ, developed by Harvard University in 2015 for research purposes, which assesses the intake of various foods and nutrients that can be computed to identify the daily frequency, quantity or weight of that particular food. The modified FFQ was formulated based on the previous experience of the research team, review of the available literature and information gathered through an informal survey that included a list of commonly consumed FV available in Pakistan throughout the year.13 They were further categorized into 8 raw and 9 cooked vegetable choices and 10 commonly consumed fruit options. An option of “others” was mentioned in each category to cover those FV not listed. The quantity of FV consumed was recorded with options of “daily”, “weekly”, “monthly” and “none”. The questionnaire was pre-tested in a sample population and training was provided to the data collectors on the best methods of collecting food intake. Information on portion sizes was also recorded using food models for accurate estimations. The average daily serving of FV was calculated for each participant, and its recommended intake was classified dichotomously into <3 servings per day or ≥3 servings per day.14 Participants who met the minimum recommended servings of 3 FV per day were labeled as consuming a “Recommended” FV intake, while the rest were classified as “Non-Recommended”.
Anthropometric Measurements
Research assistants took the anthropometric measurements of each participant. The student’s height was measured using a stadiometer by asking them to stand without shoes, buttocks and upper back touching the scale and keeping their arms to their sides. The head was aligned to the Frankfort plane position and a headboard was used to measure the height reading to the nearest 0.1cm. Weight (kg), BMI (kg/m2) and BF% were measured collectively using a portable bioelectric impedance analysis (BIA) machine (Omron) after entering the participant’s height, age (years) and gender into it. For this purpose, students were first counseled and then asked to remove all metallic items due to the electric conduction mechanism. The machine was placed on a flat surface. Students were asked to stand straight on the electrode platform and extend their arms forward at 90o to their body while holding on to the grip electrodes. Once the readings were visible on the display and checked by the worker, the student’s data were recorded. To reduce the margin of error in BMI readings, the values obtained from the BIA machine were cross-tabulated with values that were manually calculated using the formula of weight (kg)/height (m2).
BMI was categorized using the CDC standard percentiles.15 Underweight was classified as less than 5th percentile, normal weight between 5th and 85th percentile, overweight with a percentile higher than 85th and lower than 95th while obesity was classified with a percentile higher than 95th. Similarly, normal fat mass levels were classified between the 5th and 85th percentile, moderately high BF% percentile higher than 85th and lower than 95th and excessive BF% percentile higher than 95th.16
Statistical Analysis
All analyses were performed using SPSS version 16.0 (SPSS Inc., Chicago, IL, USA). The mean and standard deviation was calculated for continuous variables, whereas categorical data were displayed in frequencies and percentages. A chi-square test with a significance level of 0.05 was used to examine the association between intake of FV and body composition including BMI and BF%. Regression analyses were performed to evaluate the effects of anthropometric measures on the minimum recommended FV intake. A multivariate logistic regression model was used to compute the adjusted OR for individuals with varied measures of body composition after adjusting the confounding variables identified in univariate analysis.
Results
Out of the 540 participants, 3 students with chronic metabolic diseases and physical impairments were excluded from the study based on altered diet patterns and incorrect representation of anthropometric measures. Thus, out of 537, 306 participants (57%) were ≤14 years and the average age was 14.3 ± 1.42 years. Table 1 shows the proportion of male-to-female ratio that is almost 1:1 with 50.7% females and 49.3% males. Among all participants, 31.7% of the fathers and 31.3% of the mothers had received no formal education, while fathers were the earning members of the family in 89% of our sample. A high percentage of our participants (38.7%) did not meet the minimum recommended intake of 3 FV per day. The prevalence of over-nutrition was higher than the prevalence of under-nutrition. Of all, 10.1% of the participants were found to be overweight and 4.8% were classified as obese compared to only 4.8% of underweight participants. In BF%, moderately high and excessively high BF% levels were found in 7.6% and 3.7% of the participants, respectively.
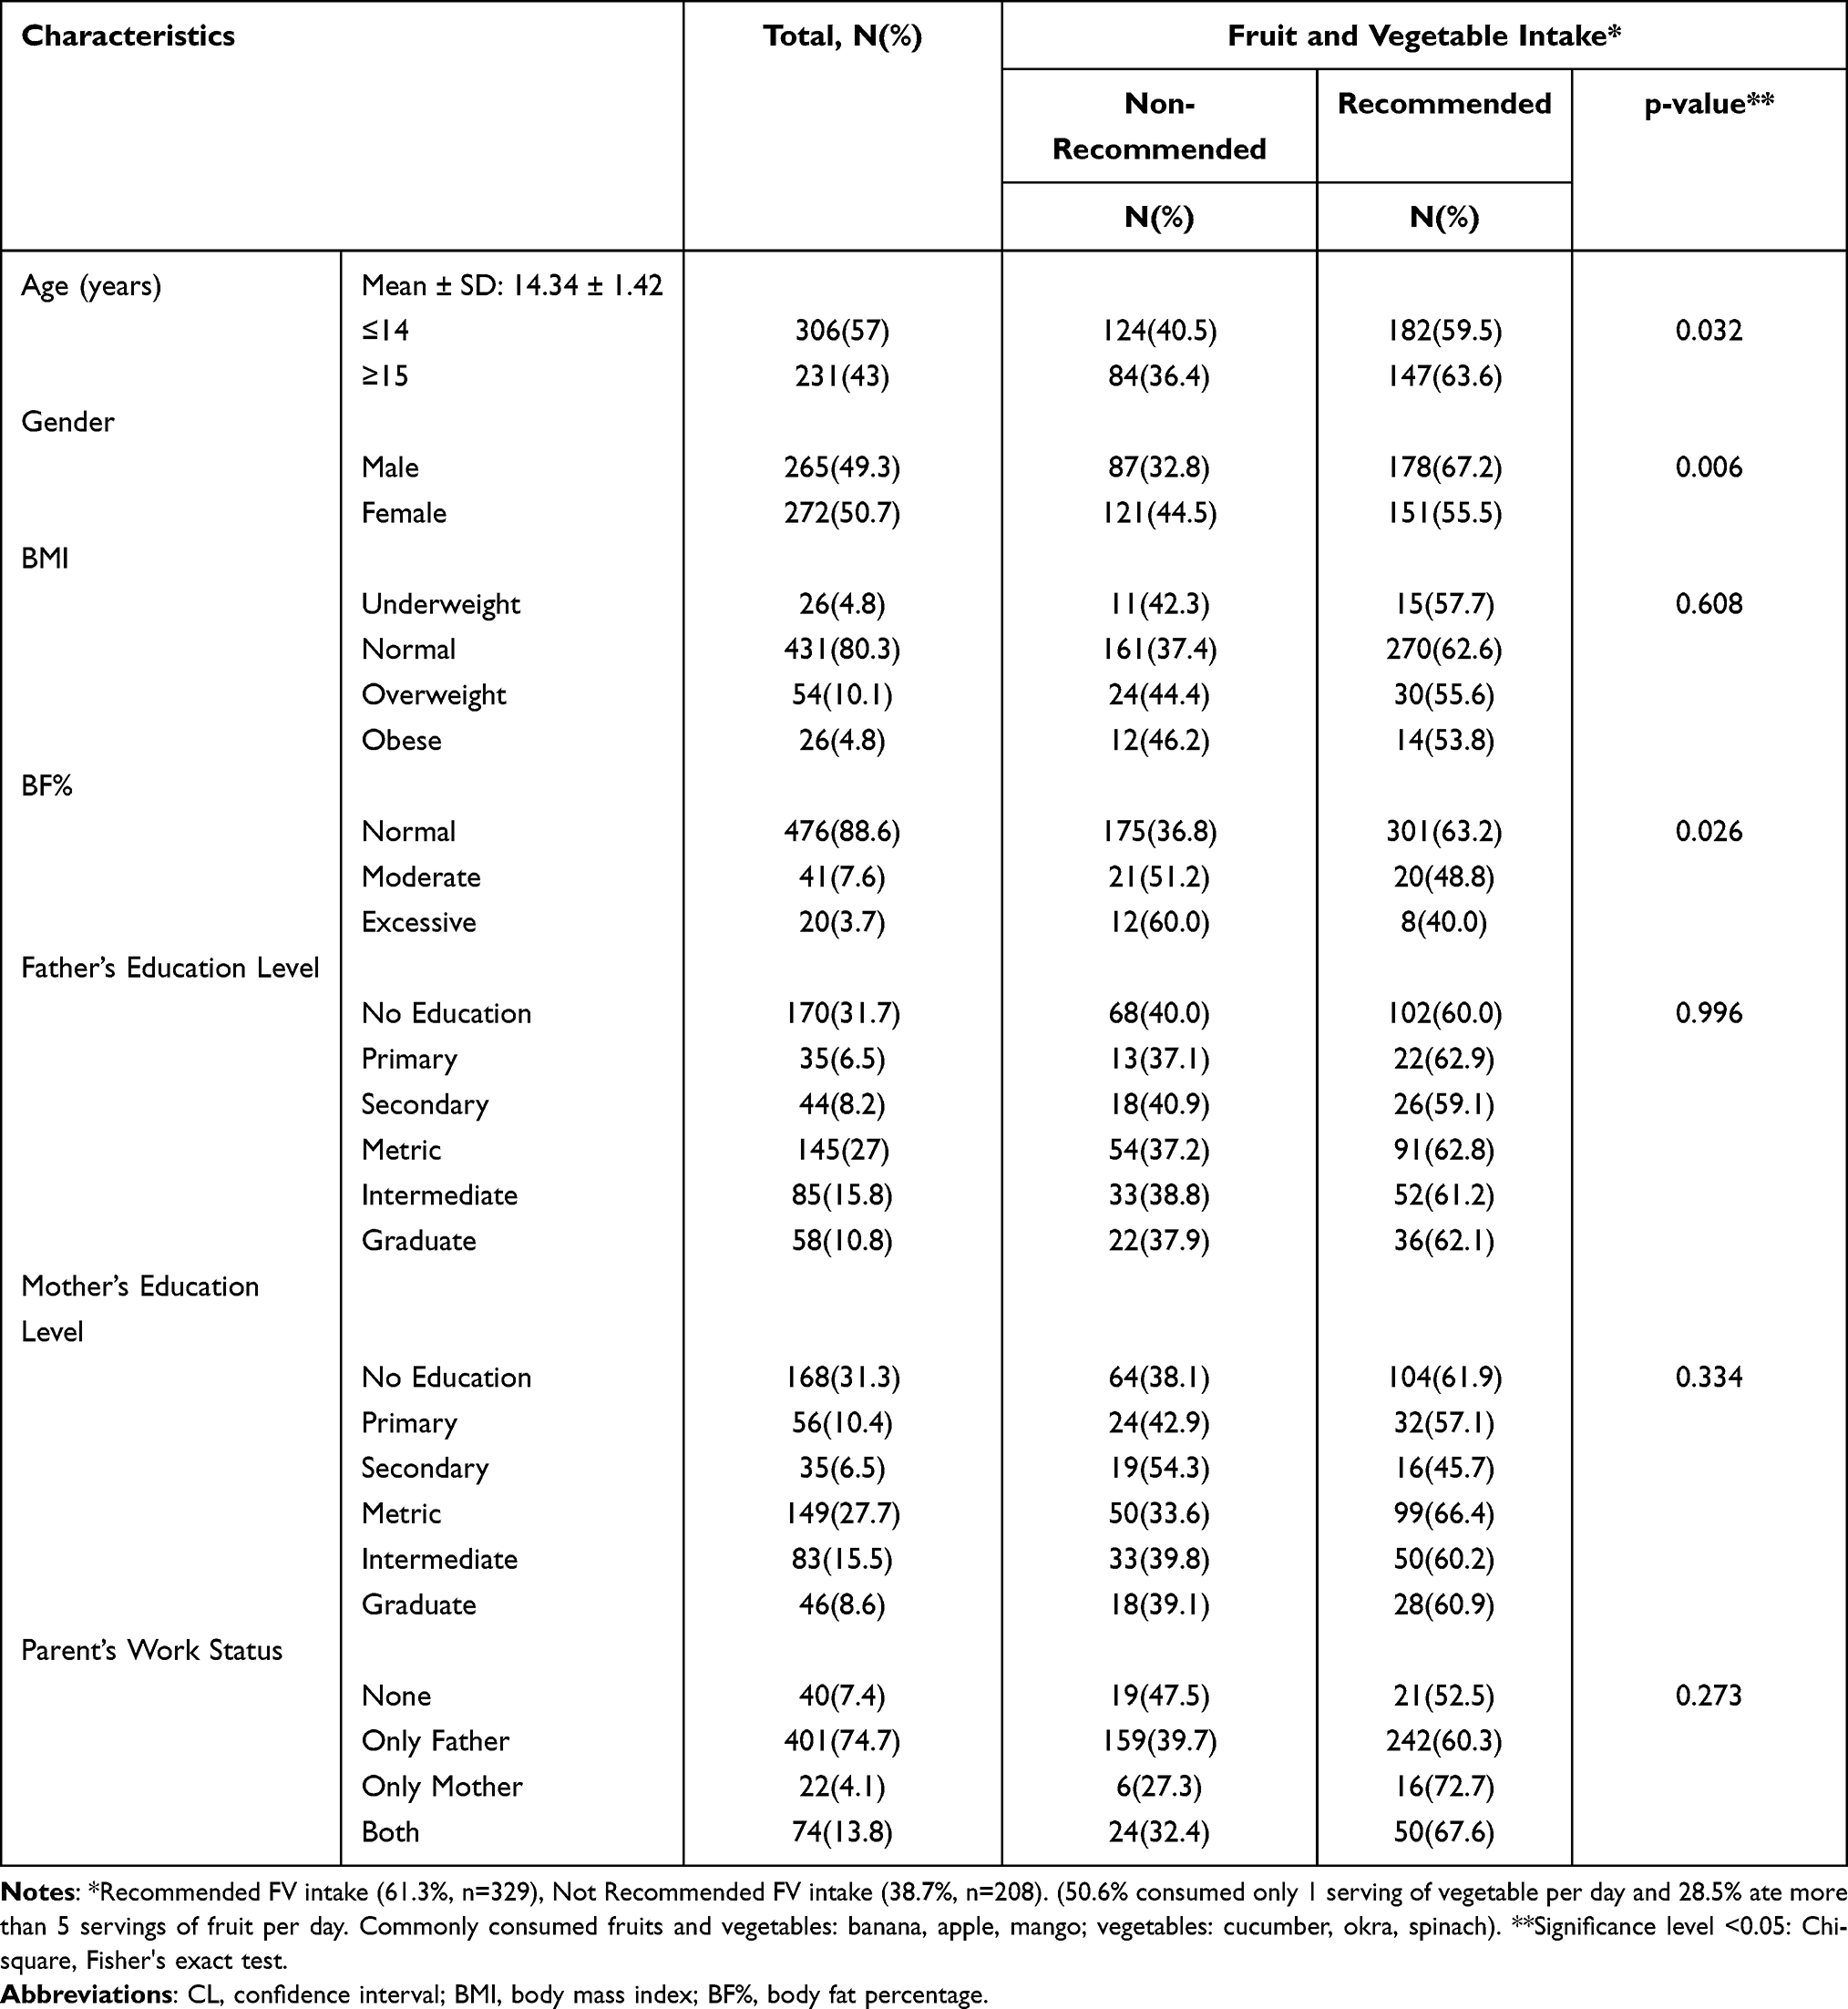 |
Table 1 Prevalence of FV Intake Across Socio-Demographic Characteristics and Obesity Measures (N=537) |
Recommended intakes of FV were found to be higher among male participants (63.6%) and ≥15 years old (67.2%). On the contrary, many participants who had moderately high BF% (51.2%) or excessively high BF% (60%) did not meet the minimum recommended intake of FV. Chi-square test was conducted to measure the association between age, gender and measures of body composition. A Chi-square was significant when associating the recommended intake of FV with age (p-value 0.032), gender (p-value 0.006) and BF% (p-value 0.026).
Table 2 shows that 13.4% of the participants of age ≥15 years were overweight, while 5.3% of the respondents aged ≤14 years were obese. Age had a significant association with BMI (p-value <0.001), while gender had a positive association with both BMI (p-value 0.011) and BF% (p-value <0.001). In our study, female participants had higher BMI levels with 13.6% overweight and 6.2% obese. Similarly, 15.1% of female participants had moderately high and 5.1% had excessively high BF% levels, which were higher than male participants.
 |
Table 2 Association Between Age, Gender and Anthropometric Measures (N=537) |
Univariate logistic regression analysis showed that older adolescent’s (OR = 1.83, 95% CI: 1.58–2.19, p-value 0.032) and females (OR = 1.63, 95% CI: 1.15–2.32, p-value 0.005) had significantly higher odds of consuming less than 3 servings of FV. Low consumption of the minimum required intake of FV per day was significantly higher in adolescents with moderately high BF% levels (OR = 1.80, 95% CI: 1.50–3.43, p-value 0.007) and twice more likely in adolescents with excessively high BF% levels (OR = 2.58, 95% CI: 1.03–6.45, p-value 0.042).
For BMI, overweight participants (OR = 1.34, 95% CI: 0.75–2.38, p-value 0.215) and those who were obese (OR = 1.43, 95% CI: 0.64–3.19, p-value 0.373) had higher odds of not meeting the recommended servings of FV; however, the association was non-significant. Parent’s education level and occupation status also showed no significant association with adolescents meeting the minimum required intakes of FV.
Adjustment of the model in multivariate logistic regression analysis displayed similar results as the univariate model as shown in Table 3. The odds of consuming less than the minimum required servings of FV were 1.53 times higher among female adolescents (AOR = 1.53, 95% CI: 1.04–2.25, p-value 0.005) than males and 1.77 times higher in older adolescents (AOR: 1.77, 95% CI: 1.53–2.12, p-value 0.032) as compared to younger adolescents.
 |
Table 3 Association Between Demographic Factors and FV Intake (Regression Analysis) |
An increasing odd of consuming less FV was observed with raised levels of BF%. Adolescents with extremely high BF% were found to have more than three times the odds of not consuming the recommended minimum servings of FV per day (A. OR = 3.63, 95% CI: 1.04–12.62, p-value 0.042) whereas adolescents with moderately high BF% were almost twice as likely to consume less than 3 servings of FV per day (AOR 1.70, 95% CI: 1.64–4.53, p-value 0.007). Whereas BMI showed non-significant lower odds with FV intake.
Discussion
This study demonstrates an overall low intake of FV among school-going adolescents in Karachi, Pakistan. The prevalence of adolescents not meeting the minimum recommendations of FV servings per day was found to be 38.7%. The overall low consumption of FV along with the increasing percentage of obesity can be accounted for the current nutrition transition among adolescents in Pakistan.17 This transition is in the form of more consumption of processed and fast food and less consumption of fruit, vegetables, milk and meat.
Our study showed 61.3% of the participants met the required intake of FV. Previous research has reported 17.5–22.5% taking 3 or more FV per day18 and in another study, 40% of the children were consuming fruits and 72% vegetables.19 In comparison to other low-income countries, a study of five South-Asian countries by Peltzer et al reported 28% of the children having less than 1 serving of fruits per day and 13.8% of the children having less than 1 serving of vegetables per day. Our study showed a higher percentage of the population taking less than 1 serving of vegetables per day (31.1%) and a comparatively lower percentage of the population taking less than 1 serving of fruit per day (12.5%) indicating a better fruit intake.20 Mass cultivation in Pakistan can account for the relatively higher intakes of fruits in our population, particularly for bananas, apples and mangoes.
Parental education and work status were not found to have a direct effect on the FV intake in our population. However, many studies have shown a greater FV intake among children with increased parental knowledge and socioeconomic levels.21,22 The reason could be because we did not inquire about parental income or any other factors that could be related to the FV intake of the child.
Research has shown that gender can also influence FV intake among adolescents.23,24 Our study showed that female adolescent participants consumed less FV than their male counterparts which could also be seen in other countries.25 However, research conducted in the western geographic locations shows otherwise.26 The difference in findings could be based on the cultural variation that exists across different countries in terms of food intake and the priority placed on women in patriarchal settings. In addition, Macdiarmid et al reported that females were more likely to under-report food intake as compared to males, particularly if they were overweight or obese.27 The same reasons can be attributed to our study where more female participants were found to have a lower intake of FV along with higher levels of BF in comparison to male participants. Similar findings were observed validation in a survey conducted in Karachi where more than 22% of the 180 adolescent females were overweight or obese and consumed fewer amounts of FV.28
Our study showed a significant percentage of the adolescent population that were overweight or obese, 10.1% and 4.8%, respectively. Affirming to studies around the world,29,30 FV intake was found to be inversely associated with body fat percentage in our study population. Inadequate intake of FV can further decrease fiber in the diet and may increase the risk of developing NCDs.31 The prevalence of over-nutrition among our study population concurs with studies conducted in Pakistan.32,33
However, more significantly, our study found BMI to be less sensitive in categorizing the nutritional status of adolescents as compared to BF%. While a large number of students were classified as normal through the BMI method, the same population was found to be classified as having moderate or extremely high amounts of BF% through the bioelectric impedance analysis (BIA) method. This could be due to the characteristic of BMI that only measures total body mass.34 Similar findings have also been reported from other studies at a global level showing BIA to be a better marker of body fat levels in comparison to BMI.35 In line with our study results, it can be thought that BIA analysis is more sensitive than BMI in categorizing nutritional status in adolescents. However, studies in larger populations are needed to reach a definitive conclusion.
To our knowledge, this is one of the few papers that report the FV consumption pattern and its relationship with obesity in a representative sample of school-going adolescents in Karachi, Pakistan. The findings of the study emphasize the need to further understand the role of balanced nutrition at an early age and take active measures for it. Furthermore, the inclusion of fat mass in the measures allowed us to identify obesity among adolescents and verify the need for intervention at an early age. Apart from these strengths, the study also had a diverse representation of the study population from all districts of Karachi, thereby allowing us to study a range of ethnic groups with varied dietary habits.
There were several limitations in our study. First, the cross-sectional nature of the study did not allow us to establish any causality but only to test the associations between FV intake and body composition of school-going adolescents. Further research is warranted to help understand the nature of the relationship among the observed variables. Second, adolescents’ estimate on their FV intake was based on their memory, especially in seasonal FV intake. However, the data collecting team minimized recall bias by providing a list of common seasonal FV using the FFQ. Third, we were unable to determine how FV intake compared to other food items. Therefore, reasons for poor FV consumption cannot be determined if it is either due to decreased overall intake of food in the daily diet or due to the replacement of FV with unhealthy food options. We speculate that the inadequate consumption of FV can be found across the country and thus other parts of Pakistan may consider this study as a base to conduct an in-depth nationwide survey on dietary habits.
Conclusion
Our study showed that a substantial number of adolescents did not meet the daily recommendation of FV consumption. Low intake of FV was found to be significantly correlated with adolescents older in age, belonging to the female gender and having higher BF levels. Some adolescents, despite having normal BMI levels, were found to have moderate to extremely high levels of BF% indicating less sensitivity of the former marker in identifying nutritional status. This warrants further research on larger populations to reach a definitive conclusion. Promoting healthy eating habits within physical and social-environmental contexts is crucial to improve nutrition-based interventions to reduce disease risk among adolescents. Implementation of innovative strategies that engage adolescents and their families through education and media can prove to be a positive action to improve dietary patterns among them.
Acknowledgments
The authors would like to acknowledge faculty and BS Nutrition students of DUHS for assisting in data collection. Thanks to all study participants, schools, parents for their willingness to participate.
Funding
This work was supported by National Research Program for Universities (NRPU) grant no. 4489 by Higher Education Commission (HEC) of Pakistan.
Disclosure
The authors report no conflicts of interest in this work.
References
1. World Health Organization. The World Health Report 2002: Reducing Risks, Promoting Healthy Life. Geneva, Switzerland: World Health Organization; 2002.
2. Popkin BM. Nutrition transition and the global diabetes epidemic. Curr Diab Rep. 2015;15(9):64. doi:10.1007/s11892-015-0631-4
3. Nikolić M, Nikić D, Petrović B. Fruit and vegetable intake and the risk for developing coronary heart disease. Cent Eur J Public Health. 2008;16(1):17–20. doi:10.21101/cejph.a3442
4. World Health Organization. WHO fruit and vegetable promotion initiative – report of the meeting. Geneva, Switzerland; 2003.
5. Hall JN, Moore S, Harper SB, Lynch JW. Global variability in fruit and vegetable consumption. Am J Prev Med. 2009;36(5):402–409. doi:10.1016/j.amepre.2009.01.029
6. Government of Pakistan U, UKAid. National Nutritional Survey 2018. Pakistan; 2019.
7. Ng M, Fleming T, Robinson M, et al. Global, regional, and national prevalence of overweight and obesity in children and adults during 1980–2013: a systematic analysis for the Global Burden of Disease Study 2013. Lancet. 2014;384(9945):766–781. doi:10.1016/S0140-6736(14)60460-8
8. GAIN. Technical report: review of evidence on the nutritional status of adolescent girls and boys in Pakistan. Geneva, Switzerland; 2018.
9. GOP/FAO. Pakistan dietary guidelines for better nutrition; 2018.
10. Staff U. The state of the world’s children 2011-executive summary: adolescence an age of opportunity. UNICEF; 2011.
11. Birch LL, Fisher JO. Development of eating behaviors among children and adolescents. Pediatrics. 1998;101(Supplement 2):539–549. doi:10.1542/peds.101.S2.539
12. Keats EC, Rappaport AI, Shah S, Oh C, Jain R, Bhutta ZAJN. The dietary intake and practices of adolescent girls in low-and middle-income countries: a systematic review. Nutrients. 2018;10(12):1978.
13. HSoPH N. Grid FFQ USA 2007. USA; 2007.
14. Shokrvash B, Majlessi F, Montazeri A, et al. Fruit and vegetables consumption among adolescents: a study from a developing country. World Appl Sci J. 2013;21(10):1502–1511.
15. Harrington DM, Staiano AE, Broyles ST, Gupta AK, Katzmarzyk PT. BMI percentiles for the identification of abdominal obesity and metabolic risk in children and adolescents: evidence in support of the CDC 95th percentile. Eur J Clin Nutr. 2013;67(2):218–222. doi:10.1038/ejcn.2012.203
16. Ogden C, Li Y, Freedman D, Borrud LG, Flegal K. Smoothed percentage body fat percentiles for U.S. Children and adolescents 1999–2004. Natl Health Stat Rep. 2011;432011(43):1–7.
17. Janjua NZ, Mahmood B, Bhatti JA, Khan MI. Association of household and community socioeconomic position and urbanicity with underweight and overweight among women in Pakistan. PLoS One. 2015;10(4):e0122314. doi:10.1371/journal.pone.0122314
18. Khalid U, Nosheen F, Raza MA, et al. A comparative study about the daily intake of fruits and vegetables among female students of two universities of Faisalabad. Pak J Nutr. 2011;10(7):684–689. doi:10.3923/pjn.2011.684.689
19. Kahn HS, Imperatore G, Cheng YJ. A population-based comparison of BMI percentiles and waist-to-height ratio for identifying cardiovascular risk in youth. J Pediatr. 2005;146(4):482–488. doi:10.1016/j.jpeds.2004.12.028
20. Peltzer K, Pengpid S. Fruits and vegetables consumption and associated factors among in-school adolescents in five Southeast Asian countries. Int J Environ Res Public Health. 2012;9(10):3575–3587. doi:10.3390/ijerph9103575
21. Jones LR, Steer CD, Rogers IS, Emmett PM. Influences on child fruit and vegetable intake: sociodemographic, parental and child factors in a longitudinal cohort study. Public Health Nutr. 2010;13(7):1122–1130. doi:10.1017/S1368980010000133
22. van Ansem WJ, Schrijvers CT, Rodenburg G, van de Mheen D. Maternal educational level and children’s healthy eating behaviour: role of the home food environment (cross-sectional results from the INPACT study). Int J Behav Nutr Phys Act. 2014;11(1):113. doi:10.1186/s12966-014-0113-0
23. Li -K-K, Concepcion RY, Lee H, et al. An examination of sex differences in relation to the eating habits and nutrient intakes of university students. J Nutr Educ Behav. 2012;44(3):246–250. doi:10.1016/j.jneb.2010.10.002
24. Al Ani MF, Al Subhi LK, Bose S. Consumption of fruits and vegetables among adolescents: a multi-national comparison of eleven countries in the Eastern Mediterranean Region. Br J Nutr. 2016;116(10):1799–1806. doi:10.1017/S0007114516003810
25. Musaiger AO, Gregory WB. Dietary habits of school-children in Bahrain. J R Soc Health. 1992;112(4):159–162. doi:10.1177/146642409211200401
26. Baker AH, Wardle J. Sex differences in fruit and vegetable intake in older adults. Appetite. 2003;40(3):269–275. doi:10.1016/S0195-6663(03)00014-X
27. Macdiarmid J, Blundell J. Assessing dietary intake: who, what and why of under-reporting. Nutr Res Rev. 1998;11(2):231–253. doi:10.1079/NRR19980017
28. Aziz F, Ali MM, Jabeen F. Prevalence of overweight and obesity among young female students in association with BMI. RADS J Biol Res Appl Sci. 2017;8(2):1–4.
29. Fernström M, Fernberg U, Hurtig-Wennlöf A. Insulin resistance (HOMA-IR) and body fat (%) are associated to low intake of fruit and vegetables in Swedish, young adults: the cross-sectional lifestyle, biomarkers and atherosclerosis study. BMC Nutr. 2019;5(1):1–9. doi:10.1186/s40795-019-0279-6
30. Buijsse B, Feskens EJ, Schulze MB, et al. Fruit and vegetable intakes and subsequent changes in body weight in European populations: results from the project on Diet, Obesity, and Genes (DiOGenes). Am J Clin Nutr. 2009;90(1):202–209. doi:10.3945/ajcn.2008.27394
31. Rolls BJ, Ello-Martin JA, Tohill BC. What can intervention studies tell us about the relationship between fruit and vegetable consumption and weight management? Nutr Rev. 2004;62(1):1–17. doi:10.1111/j.1753-4887.2004.tb00001.x
32. Mushtaq MU, Gull S, Abdullah HM, Shahid U, Shad MA, Akram J. Prevalence and socioeconomic correlates of overweight and obesity among Pakistani primary school children. BMC Public Health. 2011;11(1):1. doi:10.1186/1471-2458-11-1
33. Warraich HJ, Javed F, Faraz-ul-Haq M, Khawaja FB, Saleem S. Prevalence of obesity in school-going children of Karachi. PLoS One. 2009;4(3):e4816. doi:10.1371/journal.pone.0004816
34. Vanderwall C, Randall Clark R, Eickhoff J, Carrel ALJBP. BMI is a poor predictor of adiposity in young overweight and obese children. BMC Pediatr. 2017;17(1):135. doi:10.1186/s12887-017-0891-z
35. Willett K, Jiang R, Lenart E, Spiegelman D, Willett WJO. Comparison of bioelectrical impedance and BMI in predicting obesity related medical conditions. Obesity. 2006;14(3):480–490. doi:10.1038/oby.2006.63
 © 2022 The Author(s). This work is published and licensed by Dove Medical Press Limited. The full terms of this license are available at https://www.dovepress.com/terms.php and incorporate the Creative Commons Attribution - Non Commercial (unported, v3.0) License.
By accessing the work you hereby accept the Terms. Non-commercial uses of the work are permitted without any further permission from Dove Medical Press Limited, provided the work is properly attributed. For permission for commercial use of this work, please see paragraphs 4.2 and 5 of our Terms.
© 2022 The Author(s). This work is published and licensed by Dove Medical Press Limited. The full terms of this license are available at https://www.dovepress.com/terms.php and incorporate the Creative Commons Attribution - Non Commercial (unported, v3.0) License.
By accessing the work you hereby accept the Terms. Non-commercial uses of the work are permitted without any further permission from Dove Medical Press Limited, provided the work is properly attributed. For permission for commercial use of this work, please see paragraphs 4.2 and 5 of our Terms.