")
Back to Journals » Vascular Health and Risk Management » Volume 19
Joint Modeling of Blood Pressure Measurements and Survival Time to Cardiovascular Disease Complication among Hypertension Patients Follow-up at DebreTabor Hospital, Ethiopia
Authors Zelelew AN, Workie DL
Received 21 May 2023
Accepted for publication 1 September 2023
Published 20 September 2023 Volume 2023:19 Pages 621—635
DOI https://doi.org/10.2147/VHRM.S418568
Checked for plagiarism Yes
Review by Single anonymous peer review
Peer reviewer comments 3
Editor who approved publication: Dr Konstantinos Tziomalos
Abebe Nega Zelelew,1 Demeke Lakew Workie2
1Department of Statistics, CNS, Jimma University, Jimma, Ethiopia; 2Department of Statistics, CNS, BahirDar University, BahirDar, Ethiopia
Correspondence: Abebe Nega Zelelew, Email [email protected]
Introduction: Hypertension is also referred to as a silent killer and a leading factor for cardiovascular disease complication in the world today. This study aimed to identify the factors that affect longitudinal outcomes and survival time for cardiovascular disease complications among patients with hypertension.
Methods: A retrospective cohort study was conducted among a randomly selected sample of 178 outpatients with hypertension at the Debre Tabor Specialized Hospital between September 2017 and December 2019. Three different models were used to analyze the data: the bivariate mixed-effects model, Cox proportional hazard model, and bivariate joint model for longitudinal and survival sub-models linked by shared random effects.
Results: Bivariate mixed-effects and Cox proportional hazards survival sub-models were jointly preferred based on the minimum Akaike Information Criterion value. The estimated values of the association parameters were 0.0655 (p = 0.0270) and 0.963 (p = 0.0387), indicating that the association between systolic and diastolic blood pressure with time to event was guaranteed. The joint bivariate mixed-effects model analysis showed that patients with hypertension with a family history of hypertension and clinical stage II hypertension have a high chance of developing cardiovascular disease complications and have high average systolic and diastolic blood pressure compared to their counterparts. Patients with hypertension and diabetes have higher systolic and diastolic blood pressure than their counterparts.
Conclusion: Generally, systolic and diastolic blood pressure stabilized over the follow-up period of treatment, while sex and residence were statistically insignificant to the survival time of cardiovascular disease complication. Health professionals and concerned bodies should therefore focus on patients with comorbidities, older age, and poor adherence to hypertension control and cardiovascular disease complications using technology, such as text messaging, and mobile application to promote cardiovascular health at early stage. It is important to provide early interventions for these groups of people, especially for those with family history.
Keywords: joint model, multiple longitudinal assessments, time to event outcome
Introduction
Hypertension is a silent killer among non-communicable chronic diseases and the leading risk factor for cardiovascular disease complications, such as heart disease (eg, coronary artery disease, congestive heart failure, and heart attack), stroke (eg, cerebral infarction and cerebral hemorrhage), kidney disease, and impaired vision.1–3 It is also called high blood pressure (BP), a situation in which the arterial vessel pressure is elevated, requiring the heart to work beyond normal levels to circulate blood through blood vessels.4 BP was defined using two measurement quantities: (systolic blood pressure [SBP] and diastolic blood pressure [DBP]). Clinically, a person is said to be hypertensive if their SBP is greater than 140 mmHg and/or DBP is greater than 90 mmHg and if they are already under medication.5,6
Non-communicable diseases (NCDs) are a major cause of death worldwide and are one of the health challenges of the 21st century.7 According to the World Health Organization (WHO, 2020), NCDs account for 80% of the global disease burden. Seven out of every ten deaths in developing countries are caused by NCDs, and about half of these deaths are in people younger than 70 years.8
A study conducted in, 2017 in 195 countries showed hypertension is a major public health problem. For example, among 1.13 billion deaths globally, 12.8% of these deaths were attributed to hypertension.9,10 A similar study conducted in Africa revealed 46% of the adult population had hypertension which has the highest in the world.10,11 According to a WHO report, hypertension is responsible for at least 45% of global deaths due to heart disease and 51% of deaths due to stroke.12 Another study conducted in Australia on 6083 hypertension patients showed that 373 participants developed heart failure.13
Non-communicable diseases, such as hypertension and vascular diseases, have the highest burden of morbidity and mortality in Africa.14 In the first half of the 20th century, hypertension was almost non-existent in Africa, but currently, estimates show that in Africa, more than 40% of adults have hypertension.10 It is estimated that the number of hypertensive patients in sub-Saharan Africa will rise to 150 million by 2025 because of demographic and epidemiologic transitions.15,16
Current disease assessments in sub-Saharan Africa suggest that there is a wide imbalance (0.4–47.5%) in the prevalence of hypertension, with Ethiopia considered to share a similar high profile of hypertension in sub-Saharan Africa.17,18 According to WHO report revealed that 34% of all deaths in Ethiopia were due to non-communicable diseases (NCDs), of which 12% contribute to cardiovascular disease. Available scholarly information shows that because of economic development and rapid urbanization, non-communicable diseases and their associated risk factors have risen and become a double burden in Ethiopia.19
Given the interdependence of these determinants on the onset of hypertension, jointly evaluating these interrelated factors that may alter the rate of change in cardio metabolic outcomes could be useful in developing appropriate public health interventions.20 In addition, many researchers have conducted studies using a cross-sectional study design, which does not show the progression of the disease over time, or used multiple linear regression or logistic regression to identify determinant factors without considering the correlations within the multiple outcomes and subject-specific random effects.21–23
Some studies5,24 have been conducted on hypertension and the risk factors that lead to the development of cardiovascular disease complications to determine survival time and longitudinal outcomes separately. These analysis methods do not consider the dependencies or interrelationships between different data types such as longitudinal and time-to-event data types. Consequently, separate analyses may not be appropriate when repeated measurements and time‐to‐event data are correlated and fail to consider all available information in an integrated manner.
In many clinical studies, longitudinal biomarkers and the event time of interest have been collected simultaneously to explore their association.25–27 This study applied a joint modeling framework because the main significance of this study was the reduced bias associated with measurement errors and missing data. The survival model with time-dependent covariates may be measured with an error or may be missing and to reduce possible bias associated with informative dropouts because longitudinal data record with informative dropout, we need to model time to dropouts (ie, to detect the survival probability of hypertension patients under follow-up). This study aimed to assess the association between SBP, DBP, and survival time to cardiovascular disease complications among outpatients with hypertension.
Materials and Methods
Study Design, Study Area and Sampling Procedure
Hospital-based retrospective studies were conducted among adult outpatients with hypertension attending a hypertension (HTN) clinic between September 2017 and December 2019 at the Debre Tabor Specialized Hospital (DTSH). DebreTabor Hospital is the only specialized hospital in the southern Gondar zone. It is located 666 and 107 km from Addis Ababa, the capital city of Ethiopia, and Bahir Dar, the capital city of Amhara regional state, respectively.
The study considered patients with hypertension aged greater than 18 years based on the patient’s identification number. Patients who were pregnant or complicated before the study period were not included in the study. In this study, the sample size was calculated using the Schoenfeld formula to obtain statistically significant results.28 The research was conducted at the University of Gondar; the study’s results showed that individuals with hypertension had a 1.39 (95% CI) chance of getting a heart disease, and we used 80% power of the test and 5% level of significance from the standard normal distribution table.24,29 Therefore, a total of 178 outpatients were randomly selected using simple random selection from all the HTN outpatients registered at the Debre Tabor Hospital from September 2017 to December 2019 and all of them met the inclusion criteria.
Operational Definitions
If a person’s SBP is higher than 140 mmHg and/or their DBP is higher than 90 mmHg while they are already taking medication, they are said to have HTN. The British Heart Foundation (BHF) states that there are three stages of HTN:30,31 pre-stage, which is when the blood pressure is between 120/80 mmHg and 140/90 mmHg in the clinic; Stage I: This is when the blood pressure is between 140/90 mmHg and 160/100 mmHg. Stage II: This is a severe stage, and the blood pressure was greater than 160/100 mmHg.
Adherence to medication can be defined as the extent to which the medication-taking behavior of the patient corresponds with the prescribed antihypertensive medication. In accordance with the Morisky Medication Adherence Scale, medication adherence was assessed using a validated eight-item, five-point Likert response scale, with scores of <6, 6 to <8, and 8 reflecting poor, fair, and good adherence, respectively.32,33
Study Variables
Two longitudinal and one survival outcome variables were considered in this study. These were SBP and DBP in mmHg for the longitudinal and time to develop cardiovascular disease complication in months from September 2017 to December 2019. The time to develop cardiovascular disease complications among hypertensive outpatients under follow-up at the DTSH was coded as censored (0) or event (1). The predictors included in this study were sociodemographic and clinical characteristics. Detailed descriptions of predictors are presented in Tables 1–3.
Data Analyses
In this study, both descriptive and inferential statistical analyses were used. Three different models were used: the linear mixed-effects model for bivariate longitudinal measurements of hypertension,5,6 Cox proportional hazard model for time to develop cardiovascular disease complications,34 and bivariate joint model for longitudinal and survival sub-models linked by shared random effects.35
Let Yik(tijk) denote the jth observed value of the kth longitudinal outcome for subject i, measured at time tijk, for i = 1, …, N; k = 1, ..., K, and j = 1, …, nik. A bivariate linear mixed model (BLMM) is a common approach, where measurements for different outcomes can be recorded at different times between patients and outcomes and is given by

where  and
and  are row vectors of covariates for subject i, associated with fixed and random effects, respectively, which can vary by outcome; βk is a vector of fixed effect parameters for the kth outcome; and bik is a vector of subject-specific random effects for the kth, outcome. We denote the vector of subject-specific random effects for all K outcomes by
  . The εik is the corresponding measurement error term such that,
  . Assume that the measurement errors of different longitudinal outcomes are independent of each other and that they are also independent of random effects bik.
For survival outcome, we consider the Cox proportional hazard model,34 given as:

Where Xi represents the vector of baseline covariates with the corresponding parameter estimates αi; h0(t) denotes the baseline hazard function, and γi(t) is the latent process that captures the association structure between the measurement and event processes.
The data were coded and entered into a statistical package for social science (SPSS) version 26 and R version 4.0.0, with joineRML package was used for analysis. Statistical decisions were made at 5% level of significance.
Results
Descriptive Statistics
In this study, 178 hypertensive patients age greater than 18 years were recruited. Among the patients considered in the studies, 52 (29.2%) developed cardiovascular disease, whereas 126 (70.8%) were censored. The median survival time of the patients was 15 months and the mean survival time was 14 months. The proportion of female patients who developed cardiovascular disease complications was 32 (17.9%), which was greater than the proportion of male patients 20 (11.3%).
In addition, the majority of HTN patients 94 (52.8%) resided in urban areas. Among them, 31 (17.4%) were developing cardiovascular disease complications, while 84 (47.2%) lived in rural area, among which 21 (11.8%) were developing cardiovascular disease complications. From the total participants, 75 (42.2%) had diabetes; among these, the proportion of cardiovascular disease complications was 31 (17.4%), which was greater than in patients without diabetes. Of the 178 participants, 50 (28.1%) of hypertensive patients had a family history of hypertension; among these, the proportion of cardiovascular disease complications was 29 (16.3%), which was greater than that of patients who had no family history of hypertension.
Patients with clinical Stage-II accounted for large proportion 23 (12.9%) of cardiovascular disease complications compared to pre-stage 10 (5.6%) and Stage-I 19 (10.8%), respectively. Patients who had a history of cardiac disease from their family accounted large proportion 28 (15.7%) of developing cardiovascular disease compared those without a history of cardiac disease from their family. Among 178 participants identified as having high blood pressure, 56 (31.4%) and 55 (30.9%) patients were adhering poorly and fairly, with proportions of developing cardiovascular disease of 24 (13.5%) and 20 (11.3%), respectively.
 |
Table 1 Distribution of Important Socio-Demographic and Clinical Characteristics of Hypertensive Patients Follow-up at DebreTabor Hospital |
Non-Parametric Analysis for Survival Data
The plots in Figure 1 indicate the Kaplan–Meier (KM) survival functions of HTN patients for different categories of variables. Patients with diabetes had higher survival times than those without diabetes, and patients residing in urban areas had higher survival times than those residing in rural areas. Patients without a history of cardiovascular disease in their families had a longer survival time than those with cardiovascular disease in their families. Table 2 shows the Log rank test of each categorical variable and reveals that family history of hypertension, diabetes, residence, clinical stage of hypertension, and family history of cardiovascular disease were statistically significant at the 5% level.
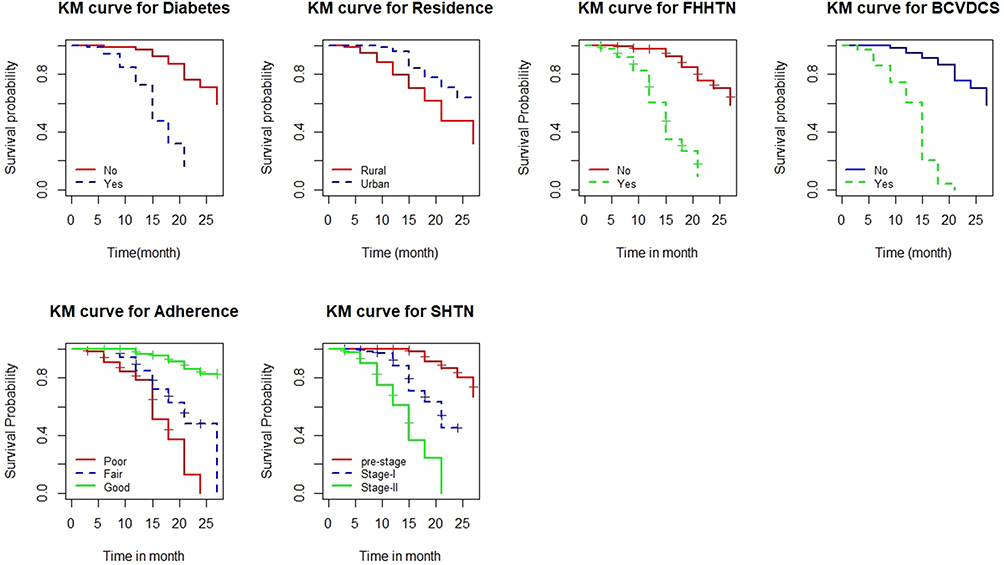 |
Figure 1 Kaplan–Meier survival estimates of different groups of hypertensive patients at DebreTabor Hospital, Ethiopia. |
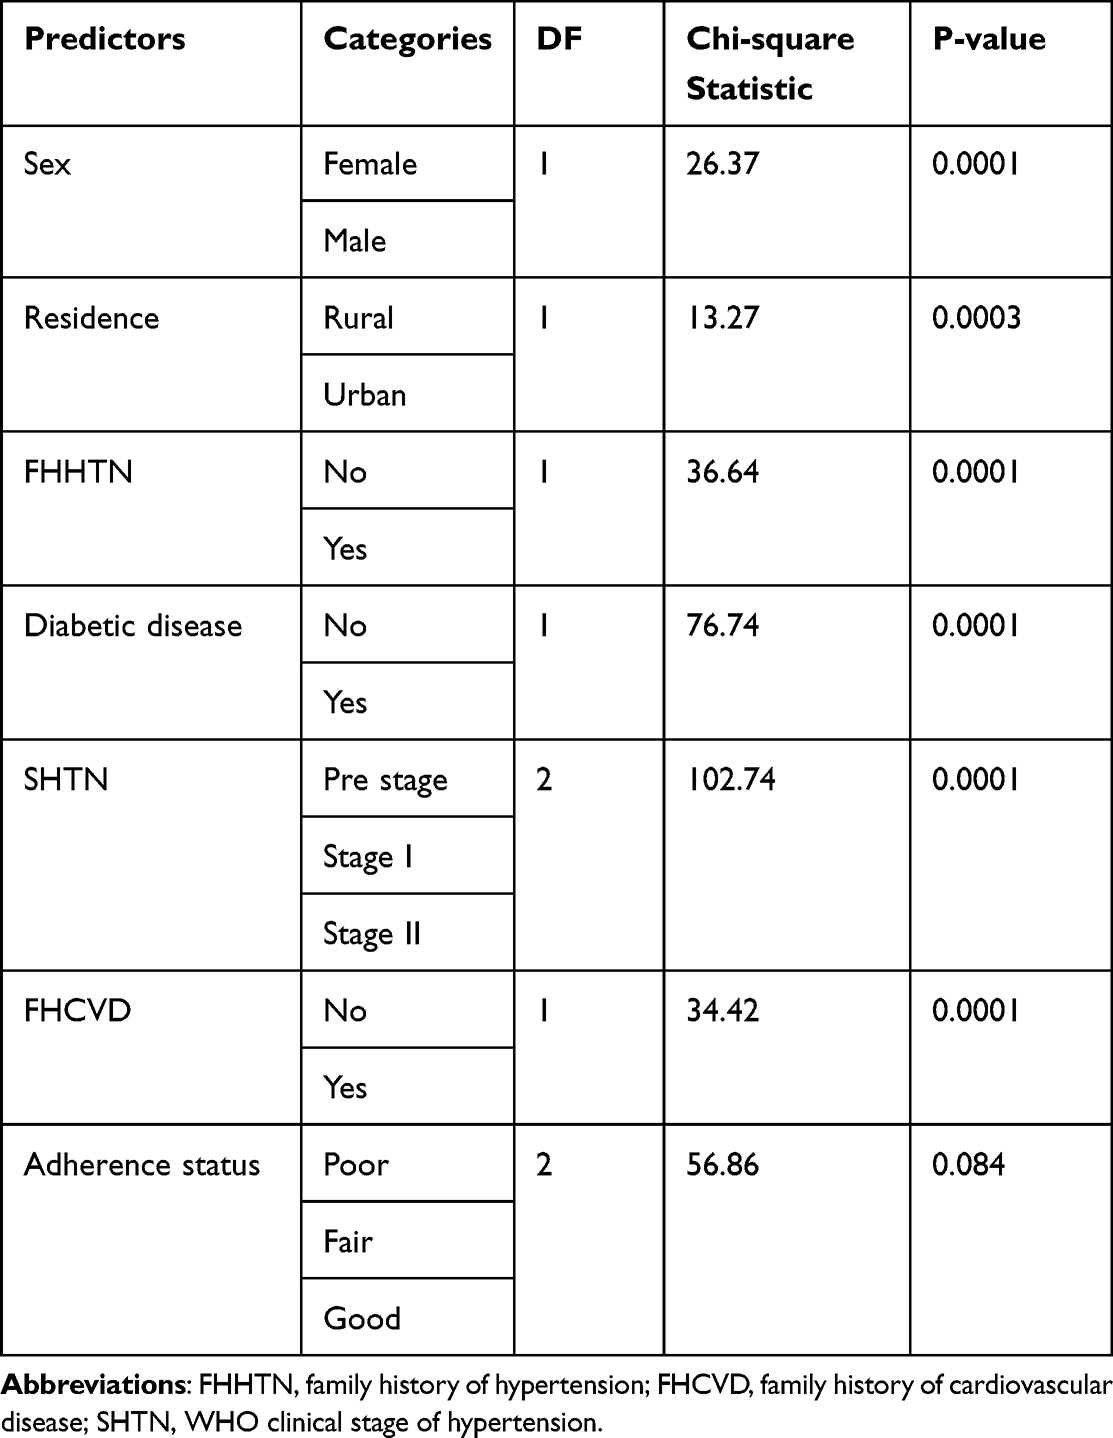 |
Table 2 Results of the Log Rank Test for the Significant Categorical Variables of HTN Patients Follow-up at DebreTabor Hospital |
Scaled Schoenfeld residual tests and plots are commonly used to verify proportionality assumptions before fitting the Cox Proportional Hazard (PH) model. According to Table 3 of the global test, each predictor variable and the global test are not statistically significant at the 5% level.
 |
Table 3 Results of Proportionality Assumption for the Significant Categorical Variables of HTN Patients Follow-up at DebreTabor Hospital |
Similarly, the Schoenfeld residual plot in Figure 2 also revealed that the resulting curve was parallel and did not show any pattern with time in the covariates of age, sex, clinical stage of hypertension, family history of hypertension, and family history of cardiovascular disease since the proportionality assumption was met.
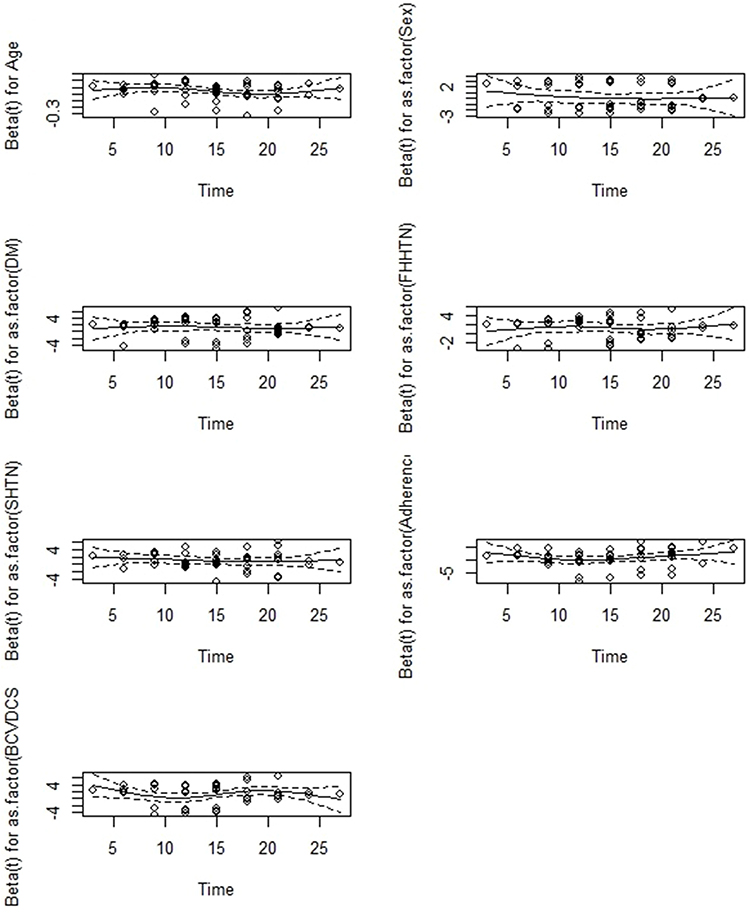 |
Figure 2 Schonfildes residual plot for significant categorical variables of HTN patients follow-up at DebreTabor Hospital. |
Cox Proportional Hazards Regression Analysis
A univariate analysis with a 25% level of significance was first performed to identify the variables associated with survival time to cardiovascular disease complication. In the multivariate analysis, variables that were significant at this level were incorporated. At a 5% level of significance, residence, diabetes, family history of hypertension, stage of hypertension, and family history of cardiovascular disease were statistically significant predictors of survival time to cardiovascular disease complication (Table 4).
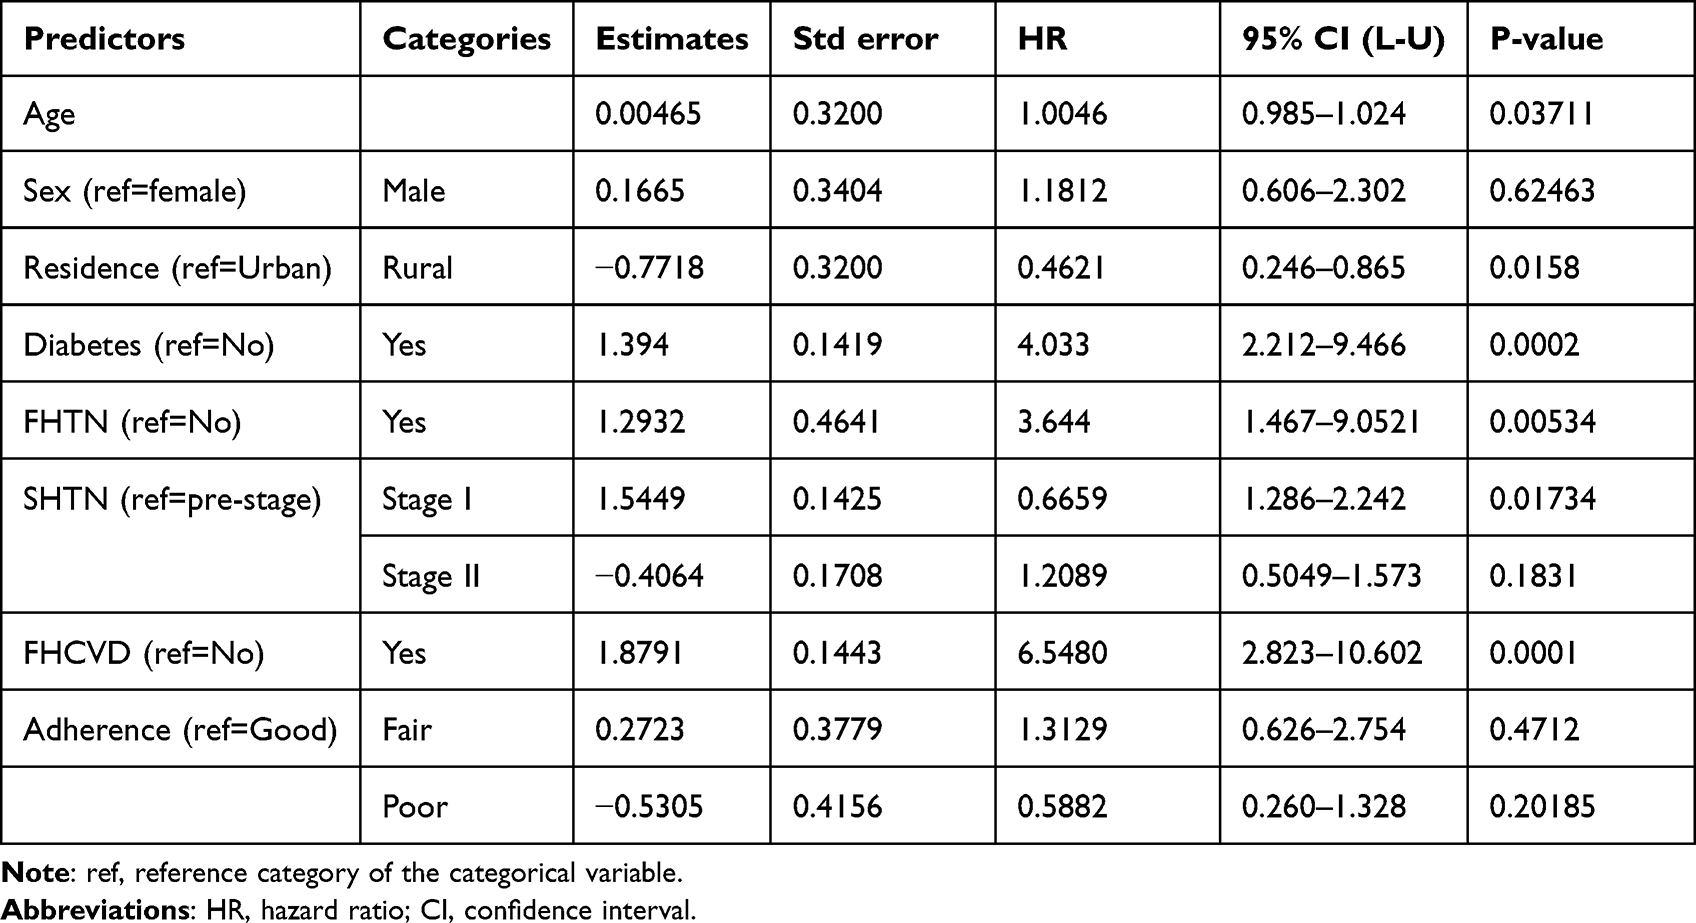 |
Table 4 Cox Proportional Hazards Regression Analysis of Time to CVDC of Hypertensive Patients Follow-up at DebreTabor Hospital |
Longitudinal Data Analysis
An individual profile plot was obtained to gain insights into the data over time. The individual profile plot shows that there was variability within and between subjects over time in the systolic and diastolic blood pressure of individual patients with HTN. Furthermore, the loess smoothing plots indicated that the average systolic and diastolic blood pressure declined linearly over time (Figure 3). As shown in Figure 4, patients with higher systolic and diastolic blood pressures tended to have a higher risk of cardiovascular disease complications. The blue and red curves represent the mean blood pressure profiles for the cardiovascular disease complication (event) and censored groups, respectively. The mean systolic and diastolic blood pressures were higher in the event group than in the censored group, indicating an association between the risk of cardiovascular disease complications and higher systolic and diastolic blood pressure.
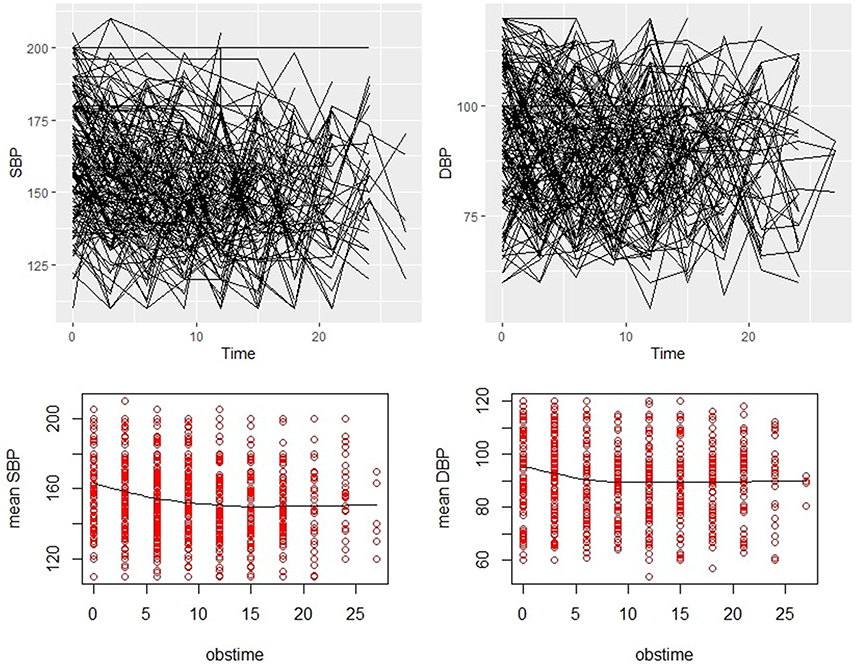 |
Figure 3 Individual and mean profile plots of the SBP and DBP of HTN patients. |
 |
Figure 4 Average trend line of SBP, and DBP over time with cardiovascular disease complication status at DebreTabor Hospital, Ethiopia. |
Analysis of Bivariate Longitudinal Mixed Effect Model
Before fitting the joint model, the bivariate longitudinal mixed effects model was fitted using different covariance structures. The model with unstructured (UN) covariance matrices showed that it was significantly better with smaller Akaike information criteria (AIC) and Bayesian information criteria (BIC), which indicates that the model with random intercept and random slope was a better fit for bivariate longitudinal outcomes. The bivariate-mixed effects model showed that age, baseline systolic blood pressure, diabetes, residence, family history of hypertension, clinical stage of hypertension, interaction between baseline systolic blood pressure and stage of hypertension, and observation time were significantly associated with SBP, whereas baseline diastolic blood pressure, diabetes, stage of hypertension, adherence, and observation time were significantly associated with DBP (Table 5).
 |
Table 5 Bivariate Random Mixed-Effects Model for SBP and DBP of HTN Outpatients Follow-up at Debre Tabor Hospital, Ethiopia |
Joint Model Analysis of SBP & DBP with Time to Cardiovascular Diseases Complication
In this subsection, longitudinal SBP, DBP, and time to cardiovascular disease complications are fitted together. The association between repeated measures of SBP and DBP with survival time to cardiovascular disease complications among hypertensive outpatients using a linear mixed-effects sub-model and a Cox proportional hazards survival sub-model was jointly addressed.
The estimated association parameter (γ) was significantly different from zero (p < 0.05), indicating a positive association between SBP, DBP, and survival time with cardiovascular disease complications. The results indicated that the slopes of the SBP and DBP measurements were positively associated with cardiovascular disease complications. A unit increase in SBP and DBP increased the risk of cardiovascular complications.
Comparison of Separate and Joint Models
When evaluating the overall performance of the separate and joint models in terms of model parsimony and goodness of fit, the joint model was preferred because it had smaller AIC and BIC than the separate model. Moreover, the statistical significance of the association parameters provides evidence that the joint model is better than separate models. As Table 6 shows, the estimates of the association parameters in the survival sub-model analysis under the joint model were significantly different from zero, indicating that the three outcomes were correlated. Therefore, the joint model was preferable for fitting the data better than the separate model.
 |
Table 6 Joint Model of Longitudinal SBP & DBP with Survival Time to Cardiovascular Disease Complication |
For a one-year increment in age, the average SBP of the patients significantly increased by 0.1372 mmHg (s. e. = 0.0690), keeping all variables constant.
The average SBP of patients with diabetes was significantly increased by 7.197 mmHg (s.e = 2.2942) compared to patients without diabetes, keeping all other variables constant, which means that patients with diabetes had a higher SBP than patients without diabetes. The average SBP of patients who had a history of hypertension with their family was significantly increased by 9.5498 mmHg (p = 0.0001) compared to patients who had no history of hypertension with their family. On average, patients who said yes (had a family history of HTN) had higher SBP than patients who did not have a family history of hypertension, keeping all other variables constant.
The parameter estimates of 2.5774 mmHg corresponding to the standard error of 1.2945 for DBP indicated that the average DBP of patients who had a history of hypertension with their family was 2.577 times higher than that of patients who did not have a history of hypertension with their family, with other variables being constant.
The estimated hazard ratio of cardiovascular disease complications in diabetic hypertension patients relative to non-diabetic hypertension patients was 4.984, indicating that the risk of cardiovascular complications among diabetic hypertension patients was 4.984 (p = 0.0001) times higher than that among non-diabetic hypertension patients, keeping all other variables constant.
Other variables being constant, the risk of cardiovascular disease complication for patients who had a history of cardiovascular disease with their family were (HR=7.76, p-value = 0.0094) times higher than the risk of developing cardiovascular disease complication for patients who had no history of cardiac disease with their family. Other factors being constant, the risk of cardiovascular disease complications in stage II patients was (HR = 6.359, p = 0.006) times higher than that in patients whose clinical stage was pre-stage.
Discussion
This study assessed predictors associated with hypertension measurements (SPB and DBP) and survival time to cardiovascular disease complications among outpatients with HTN at DTSH in Ethiopia. Our study identified factors associated with the longitudinal and survival sub-models. The longitudinal sub-model showed that age was an important sociodemographic predictor of SBP, suggesting that average SBP increases with age. According to a study done at Jimma University Specialized Hospital in Ethiopia, showed that an increase in age of one year was linked to a typical rise in SBP in mmHg.5,36 The noted findings show an age-dependent risk of SBP over time, indicating that an older person has a higher systolic pressure and a higher risk of arterial stiffness due to aging.
The current investigation discovered that people with diabetes had higher average SBP and DBP than those without. The average SBP and DBP of individuals with diabetes were significantly higher than those of non-diabetic patients, which is consistent with earlier research.5,37,38 This suggests that the coexistence of diabetes mellitus and hypertension is associated with an increase in blood pressure.
Our results are consistent with those of previous studies,39–41 the average SBP and DBP were higher for patients who had a family history of HTN than for those who had no family history of HTN. A possible reason could be the increased renal proximal sodium reabsorption. The average SBP and DBP with time to cardiovascular disease complications in patients with hypertension were significantly associated with diabetes. A study conducted in the United States revealed a similar finding of an association between increased SBP and DBP and the development of cardiovascular events, which was more pronounced in hypertensive patients with diabetes than in those without diabetes.42
Consistent with previous studies,43,44 the survival sub-models in the current study revealed a higher risk of cardiovascular complications in patients with diabetes than in those without diabetes or diabetes. It was argued that the risk of cardiovascular complications in patients who had developed diabetes had a higher probability of developing cardiac complications than in those who did not develop diabetes. The risk in patients with a family history of cardiovascular disease was higher than that in patients with no family history of cardiovascular disease. Similarly, patients with a family history of cardiovascular disease had a shorter survival time than those without a family history of cardiovascular disease. Studies conducted in Ethiopia and the Philippines revealed similar findings, where the risk of cardiovascular disease complications in patients with a history of cardiovascular disease with their family was higher than that in patients who had no history of cardiac disease with their family.24,29 This is because the parents’ genetic code is then copied into every cell of the child’s body during development, and genes control every aspect of the cardiovascular system, from the strength of the blood vessels to the way cells in the heart communicate. Genetic variations (mutations) in a single gene can affect the likelihood of heart disease development.35,36
Limitations
This study used secondary data from a single hospital. In addition, the authors did not observe an interaction effect of the predictors; hence, the results may vary when considering more hospitals all over Ethiopia and including interaction effects. Therefore, researchers should consider hospitals across Ethiopia and include the interaction effects of the predictors in the model.
Conclusion
The estimate of the association between SBP and DBP was positively significant with time to develop cardiovascular disease in patients with HTN. Hence, in this study, bivariate mixed effects and a Cox proportional hazards survival sub-model were preferred based on the minimum AIC value criterion. The joint bivariate mixed-effects model analysis showed that outpatients with HTN with a family history of HTN and clinical stage II HTN developed cardiovascular disease complications and had higher average SBP and DBP than their counterparts. Similarly, HTN outpatients with diabetes had higher SBP and DBP than their counterparts, and in general, SBP and DBP stabilized over the follow-up period of treatment. In this study, age, residence, and family history of cardiovascular disease for SBP, age for DBP, and residence and adherence to developed cardiovascular disease complications were not statistically significant. In light of the results of this study, the authors suggested that health professionals and concerned bodies should focus on patients with diabetes, family history of HTN, clinical stage II HTN, family history of cardiovascular disease, aged and poor adherence patients to control HTN, and cardiovascular disease complications using technology, such as text messaging,45 and mobile application46 to promote cardiovascular health at early stage. It is important to provide early interventions for these groups of people, especially for those with family history.
Abbreviations
AIC, Akaike information criteria; BDU, Bahir Dar University; BIC, Bayesian information criteria; CI, confidence Interval, DTHS: DebreTabor specialized hospital; FHCVD: Family history of cardiovascular disease; FHHTN: Family history of hypertension; HR: Hazard ratio; HTN, Hypertension; KM, Kaplan Meier; NCD, Non-communicable disease; SBP: Systolic blood pressure; SHTN: Stage of hypertension; WHO, World Health Organization.
Data Sharing Statement
The datasets used and/or analyzed during the current study are available from the first author upon reasonable request.
Ethical Approval and Consent to Participate
The data used in the current investigation were collected by the health staff for outpatient treatment. To use the previously collected data, ethical clearance was obtained from the Ethical Review Board of Bahir Dar University (ref. no. RCS/0102/12). Informed consent was waived due to the anonymized data. This study was conducted in accordance with the Declaration of Helsinki, which states that in medical research using identifiable human material or data, physicians must normally seek consent for the collection, analysis, storage, and/or reuse.
Acknowledgments
The authors are indebted to the Science College Research, Community Service, and Postgraduate Office of Bahir Dar University for financial support and to the Debre Tabor Hospital staff who provided support during data collection.
Author Contributions
All authors made a significant contribution to the work reported, whether that is in the conception, study design, execution, acquisition of data, analysis and interpretation, or in all these areas; took part in drafting, revising or critically reviewing the article; gave final approval of the version to be published; have agreed on the journal to which the article has been submitted; and agree to be accountable for all aspects of the work.
Funding
Data collection funding was provided by the College of Science Research, Community Service, and the Postgraduate Office of Bahir Dar University.
Disclosure
This paper is based on the thesis of Abebe Nege Zelelew. It has been published on (https://ir.bdu.edu.et/handle/123456789/11200). The authors declare that they have no conflicts of interest in this work.
References
1. Lozano R, Naghavi M, Foreman K, et al. Global and regional mortality from 235 causes of death for 20 age groups in 1990 and 2010: a systematic analysis for the Global Burden of Disease Study 2010. Lancet. 2012;380(9859):2095–2128. doi:10.1016/S0140-6736(12)61728-0
2. He J, Whelton PK. Elevated systolic blood pressure and risk of cardiovascular and renal disease: overview of evidence from observational epidemiologic studies and randomized controlled trials. Am Heart J. 1999;138(3):S211–S219. doi:10.1016/S0002-8703(99)70312-1
3. Ilyas N, Rahim K, Waqar A. HYPERTENSION: SILENT KILLER. The Pro Med J. 2015;22(02):250–255. doi:10.29309/TPMJ/2015.22.02.1392
4. Chobanian AV, Bakris GL, Black HR, et al. Seventh report of the joint national committee on prevention, detection, evaluation, and treatment of high blood pressure. Hypertension. 2003;42(6):1206–1252. doi:10.1161/01.HYP.0000107251.49515.c2
5. Workie DL, Zike DT, Fenta HM. Bivariate longitudinal data analysis: a case of hypertensive patients at Felege Hiwot Referral Hospital, Bahir Dar. Ethiopia BMC Res Notes. 2017;10(1):1–7.
6. Unger T, Borghi C, Charchar F, et al. 2020 International Society of Hypertension global hypertension practice guidelines. Hypertension. 2020;75(6):1334–1357. doi:10.1161/HYPERTENSIONAHA.120.15026
7. World Health Organization. Noncommunicable Diseases Country Profiles 2018. World Health Organization; 2018.
8. Wolrld Health Organization. Global Action Plan for the Prevention and Control of Noncommunicable Diseases 2013-2020. Wolrld Health Organization; 2013.
9. Gakidou E, Afshin A, Abajobir AA, et al. Global, regional, and national comparative risk assessment of 84 behavioural, environmental and occupational, and metabolic risks or clusters of risks, 1990–2016: a systematic analysis for the Global Burden of Disease Study 2016. Lancet. 2017;390(10100):1345–1422.
10. van de Vijver S, Akinyi H, Oti S, et al. Status report on hypertension in Africa-Consultative review for the 6th Session of the African Union Conference of Ministers of Health on NCD’s. Pan African Med J. 2014;16(1):565.
11. Kibret KT, Mesfin YM. Prevalence of hypertension in Ethiopia: a systematic meta-analysis. Public Health Rev. 2015;36(1):1–12. doi:10.1186/s40985-015-0014-z
12. Wolrld health organization. A Global Brief on Hypertension: Silent Killer, Global Public Health Crisis: World Health Day 2013. Wolrld health organization; 2013.
13. Sahle BW, Owen AJ, Krum H, et al. Incidence of heart failure in 6083 elderly hypertensive patients: the Second Australian National Blood Pressure Study (ANBP2). Eur J Heart Fail. 2016;18(1):38–45. doi:10.1002/ejhf.427
14. Lopez A. Global Burden of Disease and Risk Factors. Washington: Oxford University Press and the World Bank; 2006.
15. Keates AK, Mocumbi AO, Ntsekhe M, et al. Cardiovascular disease in Africa: epidemiological profile and challenges. Nat Rev Cardiol. 2017;14(5):273–293. doi:10.1038/nrcardio.2017.19
16. Opie L, Seedat Y. Hypertension in Sub-Saharan Populations. Circulation. 2005;112:3562–3568.
17. Anteneh ZA, Yalew WA, Abitew DB. Prevalence and correlation of hypertension among adult population in Bahir Dar city, northwest Ethiopia: a community based cross-sectional study. Int J Gen Med. 2015;8:175. doi:10.2147/IJGM.S81513
18. Addo J, Smeeth L, Leon DA. Hypertension in sub-saharan Africa: a systematic review. Hypertension. 2007;50(6):1012–1018. doi:10.1161/HYPERTENSIONAHA.107.093336
19. Mendis S, Lindholm LH, Mancia G, et al. World Health Organization (WHO) and International Society of Hypertension (ISH) risk prediction charts: assessment of cardiovascular risk for prevention and control of cardiovascular disease in low and middle-income countries. J Hypertens. 2007;25(8):1578–1582. doi:10.1097/HJH.0b013e3282861fd3
20. Beunckens C, Molenberghs G, Thijs H, et al. Incomplete hierarchical data. Stat Methods Med Res. 2007;16(5):457–492. doi:10.1177/0962280206075310
21. Bayray A, Meles KG, Sibhatu Y, Ciccozzi M. Magnitude and risk factors for hypertension among public servants in Tigray, Ethiopia: a cross-sectional study. PLoS One. 2018;13(10):e0204879. doi:10.1371/journal.pone.0204879
22. Kiber M, Wube M, Temesgen H, et al. Prevalence of hypertension and its associated factors among adults in Debre Markos Town, Northwest Ethiopia: community based cross-sectional study. BMC Res Notes. 2019;12(1):1–6. doi:10.1186/s13104-019-4431-9
23. Awoke A, Awoke T, Alemu S, et al. Prevalence and associated factors of hypertension among adults in Gondar, Northwest Ethiopia: a community based cross-sectional study. BMC Cardiovasc Disord. 2012;12(1):1–6. doi:10.1186/1471-2261-12-113
24. Tadege G. Survival Analysis of Time to Cardiovascular Disease Complication of Hypertensive Patients at Felege Hiwot Referral Hospital in Bahir‑Dar, Ethiopia: a Retrospective Cohort Study. J Biom Biostat. 2017;8(5). doi:10.4172/2155-6180.1000369
25. Yang L, Yu M, Gao S. Joint models for multiple longitudinal processes and time-to-event outcome. J Stat Comput Simul. 2016;86(18):3682–3700. doi:10.1080/00949655.2016.1181760
26. Ibrahim JG, Chu H, Chen LM. Basic concepts and methods for joint models of longitudinal and survival data. J Clin Oncol. 2010;28(16):2796. doi:10.1200/JCO.2009.25.0654
27. Hickey GL, Philipson P, Jorgensen A, et al. Joint modelling of time-to-event and multivariate longitudinal outcomes: recent developments and issues. BMC Med Res Methodol. 2016;16(1):1–15. doi:10.1186/s12874-016-0212-5
28. Schoenfeld DA. Sample-Size Formula for the Proportional-Hazards Regression Model. Biometrics. 1983:499–503.
29. Urrutia JD, Tampis RL, Mercado JO, Baygan AM. Survival analysis for the risk of developing heart attack. Int J Pharm Pharm Sci. 2016;8(2):6–10. doi:10.22159/ijpps.2016v8s2.15210
30. British Heart Foundation. High Blood Pressure; 2017.
31. Shahoud JS, Sanvictores T, Aeddula NR. Physiology, arterial pressure regulation. Am J Cardiol. 2019.
32. Morisky DE, Ang A, Krousel‐Wood M, et al. Predictive validity of a medication adherence measure in an outpatient setting. The J Clin Hypertens. 2008;10(5):348–354. doi:10.1111/j.1751-7176.2008.07572.x
33. Morisky D, Munter P. New medication adherence scale versus pharmacy fill rates in senior with hypertension. American J Managed Care. 2009;15(1):59–66.
34. Rizopoulos D. Joint Models for Longitudinal and Time-to-Event Data: With Applications in R. CRC press; 2012.
35. Verbeke G, Fieuws S, Molenberghs G, et al. The analysis of multivariate longitudinal data: a review. Stat Methods Med Res. 2014;23(1):42–59. doi:10.1177/0962280212445834
36. Negash Y, Kassahun W, Gurmessa A, et al. Joint modeling of longitudinal systolic and diastolic blood pressure measurements of hypertensive patients receiving treatment. Electron J Appl Stat Anal. 2016;9(2):308–325.
37. Bhansali A, Dhandania VK, Deepa M, et al. Prevalence of and risk factors for hypertension in urban and rural India: the ICMR–INDIAB study. J Hum Hypertens. 2015;29(3):204–209. doi:10.1038/jhh.2014.57
38. Jabir YN, Liga AD, Bacha RH, et al. Longitudinal Systolic and Diastolic Blood Pressure Change over Time and Associated Risk Factors in Patients with Hypertension in Southwest Ethiopia: a prospective study. Afr J Health Sci. 2021;34(1):12–25.
39. Asresahegn H, Tadesse F, Beyene E. Prevalence and associated factors of hypertension among adults in Ethiopia: a community based cross-sectional study. BMC Res Notes. 2017;10(1):1–8. doi:10.1186/s13104-017-2966-1
40. Ranasinghe P, Cooray DN, Jayawardena R, et al. The influence of family history of hypertension on disease prevalence and associated metabolic risk factors among Sri Lankan adults. BMC Pub Health. 2015;15(1):1–9. doi:10.1186/s12889-015-1927-7
41. Zhou L, Chen Y, Sun N, et al. Family history of hypertension and arterial elasticity characteristics in healthy young people. Hypertens Res. 2008;31(5):833–839. doi:10.1291/hypres.31.833
42. Rodriguez CJ, Swett K, Agarwal SK, et al. Systolic blood pressure levels among adults with hypertension and incident cardiovascular events: the atherosclerosis risk in communities study. JAMA Intern Med. 2014;174(8):1252–1261. doi:10.1001/jamainternmed.2014.2482
43. He J, Ogden LG, Bazzano LA, et al. Risk factors for congestive heart failure in US men and women: NHANES I epidemiologic follow-up study. Arch Intern Med. 2001;161(7):996–1002. doi:10.1001/archinte.161.7.996
44. Enyew BY, Asfaw ZG. Comparison of survival models and assessment of risk factors for survival of cardiovascular patients at Addis Ababa Cardiac Center, Ethiopia: a retrospective study. Afr Health Sci. 2021;21(3):1201–1213. doi:10.4314/ahs.v21i3.29
45. Ma Y, Cheng HY, Cheng L, et al. The effectiveness of electronic health interventions on blood pressure control, self-care behavioural outcomes and psychosocial well-being in patients with hypertension: a systematic review and meta-analysis. Int J Nurs Stud. 2019;92:27–46. doi:10.1016/j.ijnurstu.2018.11.007
46. Tam HL, Wong EML, Cheung K, et al. Effectiveness of text messaging interventions on blood pressure control among patients with hypertension: systematic review of randomized controlled trials. JMIR mHealth and uHealth. 2021;9(9):e24527. doi:10.2196/24527
 © 2023 The Author(s). This work is published and licensed by Dove Medical Press Limited. The full terms of this license are available at https://www.dovepress.com/terms.php and incorporate the Creative Commons Attribution - Non Commercial (unported, v3.0) License.
By accessing the work you hereby accept the Terms. Non-commercial uses of the work are permitted without any further permission from Dove Medical Press Limited, provided the work is properly attributed. For permission for commercial use of this work, please see paragraphs 4.2 and 5 of our Terms.
© 2023 The Author(s). This work is published and licensed by Dove Medical Press Limited. The full terms of this license are available at https://www.dovepress.com/terms.php and incorporate the Creative Commons Attribution - Non Commercial (unported, v3.0) License.
By accessing the work you hereby accept the Terms. Non-commercial uses of the work are permitted without any further permission from Dove Medical Press Limited, provided the work is properly attributed. For permission for commercial use of this work, please see paragraphs 4.2 and 5 of our Terms.