")
Back to Journals » Clinical Pharmacology: Advances and Applications » Volume 6
Lack of effect of ezogabine/retigabine on the pharmacokinetics of digoxin in healthy individuals: results from a drug–drug interaction study
Authors Tompson D, Crean C, Buraglio M, Arumugham T
Received 15 March 2014
Accepted for publication 4 June 2014
Published 13 October 2014 Volume 2014:6 Pages 149—159
DOI https://doi.org/10.2147/CPAA.S64131
Checked for plagiarism Yes
Review by Single anonymous peer review
Peer reviewer comments 3
Debra J Tompson,1 Christopher S Crean,2 Mauro Buraglio,1 Thangam Arumugham3
1Clinical Pharmacology Modelling and Simulation, GlaxoSmithKline, Stevenage, Hertfordshire, UK; 2Clinical Pharmacology and Pharmacokinetics, Valeant Pharmaceuticals North America, Durham, NC, USA; 3Clinical Statistics, GlaxoSmithKline, Raleigh-Durham, NC, USA
Introduction: The potential for ezogabine/retigabine (EZG/RTG) and its N-acetyl metabolite (NAMR) to inhibit the transporter protein P-glycoprotein-(P-gp)-mediated digoxin transport was tested in vitro. EZG/RTG did not inhibit P-gp. However, NAMR inhibited P-gp in a concentration-dependent manner. Based on these in vitro results, NAMR had the potential to inhibit P-gp at therapeutic doses of EZG/RTG (600–1,200 mg/day). As digoxin has a narrow therapeutic index, inhibition of digoxin clearance may have an impact on its safety.
Methods: An open-label, single-center, two session, fixed-sequence study was conducted to assess the effect of co-administration of therapeutic doses of EZG/RTG on digoxin pharmacokinetics in healthy adults. In session 1, subjects received a single dose of digoxin 0.25 mg. In session 2, EZG/RTG was up-titrated over 6 weeks. Digoxin 0.25 mg was co-administered at EZG/RTG steady-state doses of 600, 900, and, based on tolerability, 1,050/1,200 mg/day. Blood samples were collected over 144 hours for determination of digoxin, EZG/RTG, and NAMR concentrations. Urine samples were collected over 48 hours for determination of digoxin concentrations.
Results: Of 30 subjects enrolled, 29 were included in the pharmacokinetic analysis. Compared with digoxin alone, co-administration with EZG/RTG led to small increases in the digoxin plasma area under the concentration–time curve (AUC)0–120 at doses of 600, 900, and 1,050/1,200 mg (geometric mean ratio 1.08, 90% confidence interval [CI] 1.01–1.15; 1.18, 90% CI 1.10–1.27; 1.13, 90% CI 1.05–1.21, respectively). Safety was consistent with previous repeat-dose studies of EZG/RTG in healthy subjects.
Conclusion: Co-administration of EZG/RTG across the therapeutic range resulted in small, non-dose-dependent and non-clinically relevant increases in digoxin systemic exposure, suggesting that digoxin dose adjustment is not necessary.
Keywords: digoxin, retigabine, ezogabine, drug–drug interactions
Introduction
Ezogabine (EZG; US adopted name)/retigabine (RTG; international non-proprietary name) (EZG/RTG) is a first-in-class antiepileptic drug (AED) that reduces neuronal excitability by enhancing the activity of KCNQ (Kv7) potassium channels.1 The safety and efficacy of EZG/RTG (600–1,200 mg/day) as adjunctive therapy in adults with partial-onset seizures were demonstrated in three pivotal studies.2–4
The absolute bioavailability of EZG/RTG following oral administration is ~60%.5 EZG/RTG is rapidly absorbed, reaching maximum concentrations 1–2 hours post-dose, and is eliminated with a half-life of 6–8 hours.5 The pharmacokinetics (PKs) are essentially linear in healthy adult subjects after single administrations ≤600 mg.5 In patients with epilepsy, steady-state systemic exposure to EZG/RTG is approximately linear over the therapeutic dose range.5
Metabolism of EZG/RTG is via N-acetylation and N-glucuronidation, with formation of an N-acetyl metabolite to EZG/RTG (NAMR) and N-glucuronidated metabolites for EZG/RTG and NAMR.5 The systemic exposure and elimination half-life of NAMR are similar to those of EZG/RTG, and NAMR is not considered to contribute to EZG/RTG efficacy. The N-glucuronide metabolites of EZG/RTG and NAMR are the predominant circulating metabolites, accounting for ~90% of circulating drug-related material.5 EZG/RTG and its metabolites are eliminated mainly renally, with ~36% of the administered dose excreted as unchanged drug5,6 and ~18% as NAMR.
The absolute bioavailability of digoxin following oral administration is ~60%–80%.7 Only a small percentage (16%) of digoxin is metabolized. The metabolism of digoxin is not dependent upon the cytochrome P-450 system, and digoxin is not known to induce or inhibit the cytochrome P-450 system. Digoxin is primarily eliminated unchanged in urine (~50%–80% of an administered dose) through glomerular filtration and active tubular secretion via P-glycoprotein (P-gp).
In vitro data from a stably expressed P-gp cell line indicated that EZG/RTG does not inhibit the transporter protein P-gp up to the maximum evaluated concentration of 100 μM (30.3 μg/mL). However, NAMR inhibited P-gp efflux of digoxin in a concentration-dependent manner at test concentrations of 1 μM (273 ng/mL), 10 μM (2,730 ng/mL), and 100 μM (27,300 ng/mL), by 33%, 56%, and 70%, respectively (Valeant Pharmaceuticals International Study PR2008-017, data on file, 2008). Thus, these data suggested that the NAMR concentrations that cause 50% inhibition (IC50) of digoxin efflux may be close to 10 μM or ~2,730 ng/mL. Over the EZG/RTG therapeutic dose range (200–400 mg three times daily [TID]), the ratio of NAMR maximum concentration in plasma to the in vitro IC50 is ~ 0.22–0.38 (Table 1) (Valeant Pharmaceuticals International Studies PR2008-017, data on file, 2008; VRX-RET-E22-103, data on file, 2008; and VRX-RET-E22-301, data on file, 2009).8
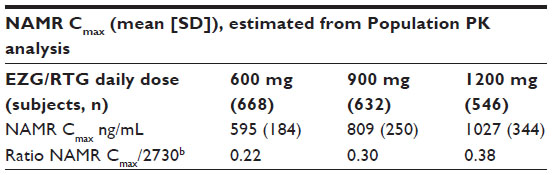 | Table 1 Comparison of NAMR Cmax in clinical trials and ratio to in vitro resultsa |
Guidance from the US Food and Drug Administration9 and the International Transporter Consortium10 indicates that an in vivo drug-interaction study with a P-gp substrate, such as digoxin, should be conducted if, based on in vitro data, the maximum concentration (Cmax) in blood (I)/IC50 ratio is >0.1. Based on the concentrations of NAMR achieved at therapeutic EZG/RTG doses, there was potential for EZG/RTG to inhibit digoxin renal tubular secretion. Digoxin has a narrow therapeutic index, and increases of systemic exposure >25% could be considered potentially clinically relevant, resulting in increased adverse events (AEs).11–13
This study was conducted to investigate the potential for NAMR to affect digoxin PK. Owing to tolerability considerations, it is not possible to administer the highest recommended dose of 1,200 mg/day EZG/RTG (400 mg TID) to healthy subjects without prior titration. Therefore, in the current study, EZG/RTG was up-titrated, in 150 mg weekly increments, according to the recommended titration regimen for patients with epilepsy. The impact of NAMR on digoxin PK was investigated at three EZG/RTG doses within the therapeutic dose range (600, 900, and 1,200 mg/day). A single oral dose of digoxin of 0.25 mg was used instead of a steady-state digoxin regimen as there was the potential for an increase in digoxin exposure, which may have resulted in increased AEs with chronic dosing and would have required therapeutic continuous drug monitoring of digoxin concentrations during the up-titration of EZG/RTG.
Materials and methods
The study was conducted at a single center (PAREXEL, Baltimore, MD, USA) between 16 January 2012 and 17 April 2012. Written informed consent was obtained from each participant prior to the performance of any study-related procedures. The study was reviewed and approved by the PAREXEL ethics committee and institutional review board, in accordance with the International Conference on Harmonisation of Technical Requirements for Registration of Pharmaceuticals for Human Use Good Clinical Practice, including US 21 Code of Federal Regulations 312.3(b) for constitution of independent ethics committees. The study was also conducted in accordance with the ethical principles that are outlined in the Declaration of Helsinki, 2008.
Study population
Inclusion
A total of 30 subjects were to be enrolled in the study; eligibility criteria included healthy, non-smoking males or females; age 18–65 years (inclusive); body mass index (BMI) of 18–30 kg/m2; total body weight >50 kg (>110 lbs); and normal creatinine clearance as assessed by the Cockcroft–Gault method. Health status was determined by an experienced physician, based on a medical evaluation that included a medical history, physical examination, laboratory tests (including aspartate aminotransferase [AST], alanine aminotransferase [ALT], alkaline phosphatase, and bilirubin, each ≤1.5× the upper limit of normal [ULN]), and cardiac monitoring. A subject with a clinical abnormality, or laboratory parameters outside the reference range for the population being studied, was included only if the finding was unlikely to introduce additional risk factors and would not interfere with study procedures. A negative drug test (amphetamines, barbiturates, cocaine metabolites, opiates, benzodiazepines, and cannabinoids) was required at screening and at ‘check-in’ on day −1.
Exclusion
Exclusion criteria included positive test results for hepatitis B surface antigen, hepatitis C virus, or HIV-1 or HIV-2 at screening; active suicidal plan/intent or active suicidal thoughts during the previous 6 months, or a history of suicide attempt in the past 2 years or more than one lifetime suicide attempt.
Subjects with a history of an anaphylactic reaction to any drug, a known hypersensitivity to digoxin (or LANOXIN™ excipients; GSK/Covis Pharmaceuticals Inc., Raleigh-Durham, NC, USA), or other digoxin-like medications or EZG/RTG; those who had consumed grapefruit juice, cranberry products (such as juice, fruit, or nutritional supplements), or alcohol-, caffeine-, or xanthine-containing products within 7 days (or five elimination half-lives, whichever was shorter) prior to the start of study medication were also excluded. Note that 15 subjects received cranberry juice with their meal following admission to the unit on day −1, period 1 (ie, the day prior to the first single dose of digoxin). Administration of cranberry juice on the day prior to digoxin administration would not be expected to have any clinically relevant impact on the PK of the P-gp substrate digoxin.14
Additional reasons for exclusion included pregnancy and/or lactation; the presence of proteinuria, hematuria, or other clinically significant findings in urinalysis at screening; a history of urinary retention or risk factors for urinary retention that in the investigator’s judgment would potentially affect subject safety; a history of syncope, clinically significant palpitations, arrhythmias, or Wolff–Parkinson–White syndrome; or any clinically relevant abnormality identified on the screening medical assessment (eg, blood pressure ≥140/90 mm Hg or heart rate >100 beats per minute), laboratory examination (eg, fasting triglyceride level >300 mg/dL), electrocardiogram (ECG) data (eg, QTc interval >450 ms); prior diseases that could affect outcomes; or immunogenicity tests.
Study design
This was an open-label, single-center, fixed-sequence, PK study, with two treatment sessions (Figure 1). In session 1, subjects received a single oral dose of digoxin (0.25 mg). In session 2 (starting 1 week later), subjects entered a 6-week EZG/RTG up-titration phase in which the initial starting daily dose was 300 mg/day. This was up-titrated in 150 mg dose increments to 900 mg/day by week 5 and to 1,200 mg/day by week 7. Doses above 900 mg/day are generally less tolerated in healthy subjects; thus, if the 1,200 mg/day dose of EZG/RTG was not tolerated, subjects were allowed to decrease the dose and continue on treatment at a dose of 1,050 mg/day.
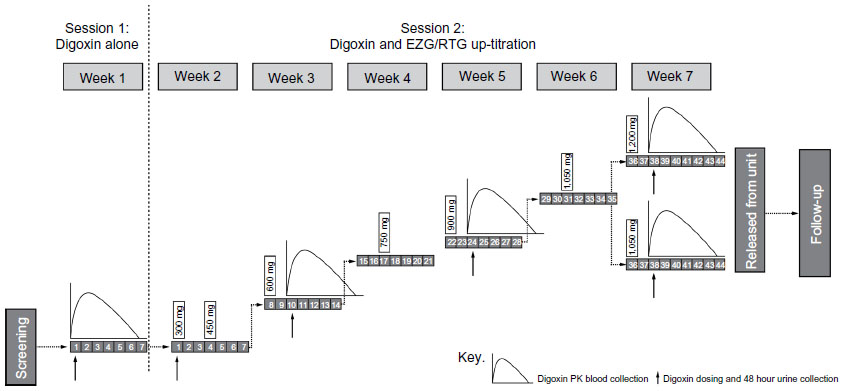 | Figure 1 Study design of digoxin and EZG/RTG up-titration. |
The single oral doses of digoxin 0.25 mg were co-administered on the third day of administering EZG/RTG at each of the following dose levels: 600, 900, and 1,050 or 1,200 mg/day.
Study drugs
EZG/RTG was supplied by GlaxoSmithKline (GSK, Research Triangle Park, NC, USA) as 50, 200, 300, and 400 mg tablets. TID dosing was at approximately 8-hour intervals for each of the up-titrated dosing levels. These were administered as follows: 300 mg (2×50 mg TID); 450 mg (3×50 mg TID); 600 mg (200 mg TID); 750 mg (200 mg + 50 mg TID); 900 mg (300 mg TID); 1,050 mg (300 mg + 50 mg TID); and 1,200 mg (400 mg TID). Tablets were taken with approximately 250 mL of water. Morning doses were taken with a standard breakfast, except on days of co-administration with digoxin, when the morning dose was administered in the fasted state.
Digoxin (LANOXIN; GSK/Covis Pharmaceuticals Inc.) tablets contained digoxin 0.25 mg (250 μg). A single 0.25 mg, oral dose of digoxin was administered in the morning after an overnight fast.
No randomized treatment assignment was applied in this study.
Objectives and endpoints
The primary objective of the study was to assess the effect of NAMR on the PK of digoxin. Secondary objectives were to evaluate whether there was any relationship between systemic exposure to NAMR and the systemic exposure to digoxin, and to monitor the tolerability of administered EZG/RTG. The planned primary endpoint of the study was the digoxin area under the concentration–time curve (AUC) from time zero extrapolated to infinite time (AUC0–∞). If AUC0–∞ could not be accurately determined in the majority of subjects, AUC from time zero to 144 hours post-dose (AUC0–144) was to be substituted as the primary endpoint. Additional planned endpoints for the PK parameters of digoxin were AUC from time zero to 48 hours post-dose (AUC0–48); Cmax; time to Cmax (Tmax); renal clearance (CLr); and apparent clearance following oral dosing (CL/F). All measurements were taken following digoxin oral dosing at session 1 (digoxin alone) and session 2 (digoxin with 600, 900, and 1,050/1,200 mg/day EZG/RTG). Secondary endpoints for NAMR and EZG/RTG were Cmax, Tmax, and AUC over the dosing interval (AUC0–τ) at doses of 600, 900, and 1,050/1,200 mg/day. Safety and tolerability endpoints included AEs, clinical laboratory assessments, vital sign assessments, ECGs, and Columbia Suicide Severity Rating Scale (C-SSRS).15
Pharmacokinetic sampling
Digoxin PK blood samples were collected pre-dose, and at 0.5, 1, 1.5, 2, 3, 4, 6, 8, 10, 12, 18, 24, 48, 72, 96, 120, and 144 hours post-dose. Approximately 2 mL of whole blood was collected into tubes containing the anticoagulant K3 ethylenediaminetetraacetic acid (EDTA), and the plasma was collected for analysis. Separate aliquots of plasma were prepared for each analyte, and were treated similarly. Samples remained on ice water, and were centrifuged at 1,500–2,000 g for 10–15 minutes at 4°C. Two aliquots (one aliquot for each analyte, EZG/RTG and digoxin) of no more than 0.5 mL plasma were transferred to screw-top tubes and frozen immediately at or below −70°C. The stored frozen plasma aliquots were shipped to GlaxoSmithKline (King of Prussia, PA, USA) for EZG/RTG and NAMR analysis and to Covance (Princeton, NJ, USA) for analysis.
Urine samples were collected before dosing and then over 48 hours after dosing from 0 to 12 hours, 12 to 24 hours, and 24 to 48 hours. Urine samples for digoxin analysis were aliquoted and treated with 2% (v/v) of 0.5 M 3-[(3-cholamidopropyl)dimethylammonio]-1- propanesulfonate (CHAPS) and mixed for 2 minutes. A 0.5 mL aliquot from each collection period was transferred to labeled 1.4 mL polypropylene specimen containers. Urine aliquots were immediately frozen at approximately −70°C until shipped for analysis at Covance.
Bioanalysis
Concentrations of EZG/RTG and NAMR were determined in plasma samples using the currently approved and validated ultra high-performance liquid chromatography coupled with tandem mass spectrometry (UPLC-MS/MS) analytical methodology. Briefly, EZG/RTG and NAMR were extracted from human plasma by liquid–liquid extraction. Isotopically labeled internal standards were used, and extracts were analyzed using UPLC-MS/MS with a TurboIonSpray™ interface (AB Sciex API 4000; AB Sciex, Framingham, MA, USA) with positive ion multiple reaction monitoring. This method was validated over the range of 5.00–2,500 ng/mL. For all validation sample concentrations examined, the within- and between-run precision values were ≤15%.
Concentrations of digoxin were determined in plasma and urine samples using the currently approved and validated LC-MS/MS analytical methodology. Briefly, digoxin was extracted from human plasma or urine by liquid–liquid extraction. An isotopically labeled internal standard was used, and extracts were analyzed by UPLC-MS/MS using a TurboIonSpray™ interface with positive ion multiple reaction monitoring. This method was validated over the range of 0.0500–10.0 ng/mL for plasma and 0.500–100 ng/mL for urine. For all validation sample concentrations examined, the within- and between-run precision values were ≤15% and at the lower limit of quantification were ≤20%.
Pharmacokinetic analysis
Plasma digoxin, EZG/RTG, and NAMR concentration–time data were analyzed by non-compartmental methods with WinNonlin version 5.2 (Pharsight, St Louis, MO, USA). Calculations were based on the actual sampling times recorded during the study.
From the digoxin plasma concentration–time data, the following PK parameters were determined, as data permitted: Cmax, Tmax, AUC0–48 and AUC0–120. The amount of digoxin excreted in the urine over 48 hours (Ae0–48) was determined. Renal clearance of digoxin was calculated as Ae0–48/AUC0–48. It was originally intended to calculate AUC0–144; however, digoxin concentrations were non-quantifiable at 144 hours post-dose, so AUC0–120 was determined instead. It was also originally intended to calculate the terminal phase half-life (t½) and hence AUC0–∞ for digoxin; however, t½ could not be accurately determined because the duration of time in which the digoxin elimination phase was linear was generally less than three half-lives.
From the NAMR and EZG/RTG plasma concentration–time data, the following steady-state PK parameters were determined, as data permitted: Cmax, Tmax, and AUC0–τ.
Safety and tolerability
Safety was evaluated by monitoring AEs and serious AEs (SAEs), clinical laboratory testing (hematology, serum chemistry, coagulation, and urinalysis), vital sign measurements (temperature, supine blood pressure, heart rate, and respiration rate), 12-lead ECGs (automatically measured PR, QRS, QT, and QTc intervals), and physical examinations at various times during the study and a follow-up visit 7–10 days after session 2.
As suicidality has been associated with psychotropic medications, including AEDs, this was assessed during the course of the study using the C-SSRS, which was designed to assess severity and change of suicidality by integrating both behavior and ideation.15 A subject could be withdrawn from study treatment at any time at his/her own request, or withdrawn at any time at the discretion of the investigator for safety, behavioral, or administrative reasons. If a subject was prematurely discontinued from the study, every effort was made to perform the following evaluations: physical examination, vital signs (blood pressure and heart rate), 12-lead ECG, clinical chemistry, hematology, urinalysis, AE assessment, and a pregnancy test for female subjects. The reason for withdrawal, or failure to provide a reason, was documented by the investigator. Once a subject had prematurely discontinued the study drug, or was withdrawn by the investigator, the subject could not re-enter the study.
Statistical analysis
The study was designed to estimate the effect of NAMR on the PK of digoxin in healthy subjects. No formal hypotheses were tested, and the sample size was based upon feasibility.
Following loge-transformation, digoxin PK parameters (CLr, AUC0–120, and Cmax) were analyzed separately (SAS® Version 9.2; Cary, NC, USA) using a mixed-effects model with a fixed-effect term for days (to represent treatment). Subject was considered a random effect in the model. For each day (corresponding to a different EZG/RTG dose level), point estimates and their associated 90% confidence intervals (CIs) were constructed for the differences in means (co-administration – digoxin alone). The point estimates and their associated 90% CIs were then back-transformed to provide point estimates and 90% CIs for the ratios of geometric means, co-administration to digoxin alone.
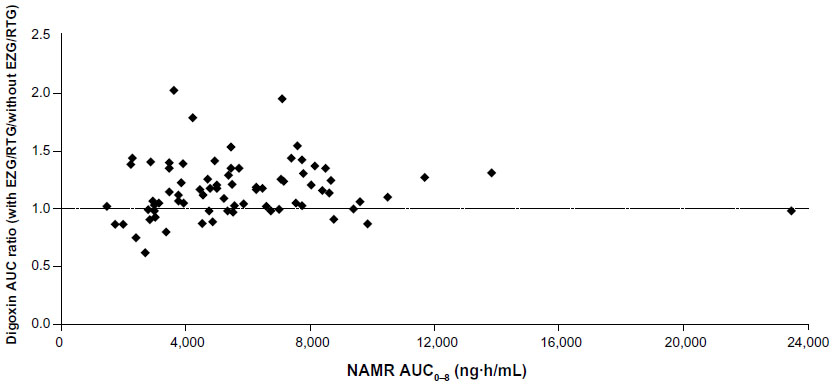
The individual digoxin AUC and CLr ratios for the EZG/RTG steady-state dose for each subject were plotted against NAMR AUC0–τ to visually investigate any possible relationship between systemic exposure to NAMR and impact on digoxin PK.
The PK analysis population comprised individuals for whom digoxin PK parameters were available from session 1 (digoxin alone), and who had received at least one co-administration of digoxin and EZG/RTG; the safety population included all subjects who received one or more dose of study medication.
Results
Study population
A total of 30 subjects with a mean (standard deviation [SD]) age of 39.10 (12.18) years and mean (SD) BMI of 25.90 (2.96) kg/m2 were enrolled in the study; 22 (73%) were male; 18 (60%) were of African–American/African heritage, and 12 (40%) were Caucasian; seven (23%) were Hispanic or Latino. All 30 subjects were included in the safety population. One subject was withdrawn prior to session 2 with mild urticaria and therefore did not receive co-administration of digoxin and EZG/RTG. Thus, 29 subjects were included in the PK analysis population. One additional subject was excluded from the statistical analysis owing to unexplained, extremely low digoxin plasma concentrations when digoxin was administered alone in session 1 (this subject was not one of the subjects who received cranberry juice on the day prior to session 1 digoxin administration).
Overall, 21 of 30 individuals completed the study as planned; eight subjects were withdrawn owing to AEs, and one withdrew consent after reporting a number of mild AEs up to day 40, although not warranting withdrawal according to the investigator. A total of 18 subjects achieved steady-state dosing at 1,200 mg/day EZG/RTG, and five subjects achieved steady-state dosing at 1,050 mg/day EZG/RTG; two of these subjects withdrew because of AEs.
Pharmacokinetics
Plasma PK parameters for digoxin were similar across the two treatment sessions (Table 2).
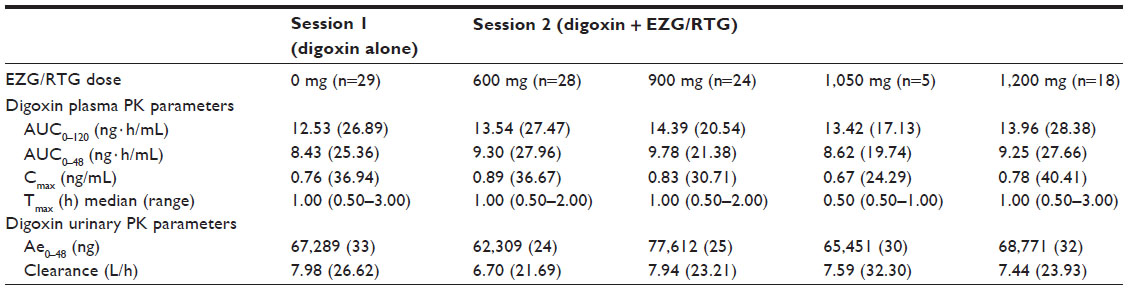 | Table 2 Summary of digoxin pharmacokinetic parameters |
Compared with administration of digoxin alone (session 1), co-administration with EZG/RTG at doses of 600, 900, and 1,050/1,200 mg/day led to small, non-dose-dependent increases in the range of 8%–18% in the digoxin AUC0–120 and a range of 1%–17% decrease in renal clearance (Figure 2). The 90% CIs for the AUC0–120 ratios of 600 mg and 1,050/1,200 mg/day EZG/RTG + digoxin doses versus digoxin alone fell within the 90% CI range associated with bioequivalence (0.80–1.25) (Table 3). However, for the 900 mg/day dose of EZG/RTG, the lower end of the 90% CI fell just outside the bioequivalence range.
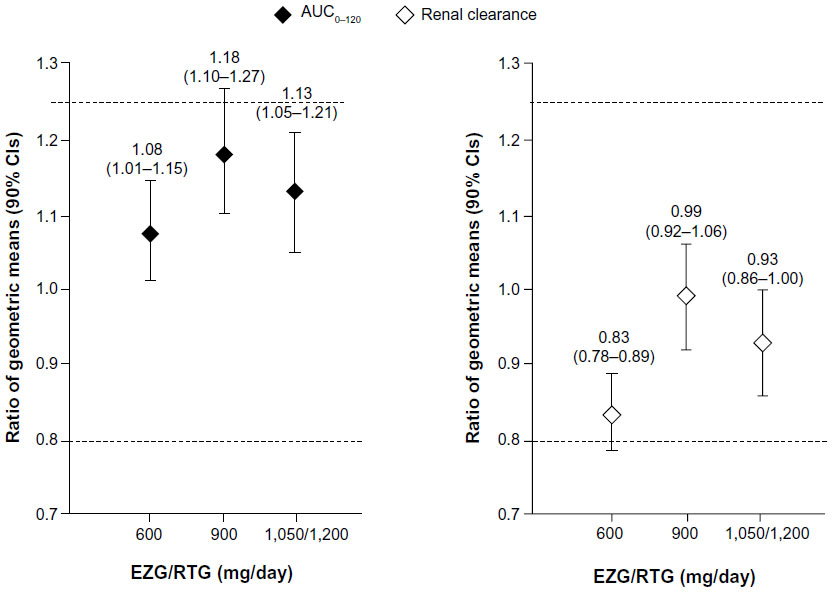 | Figure 2 Plasma AUC0–120 and renal clearance. |
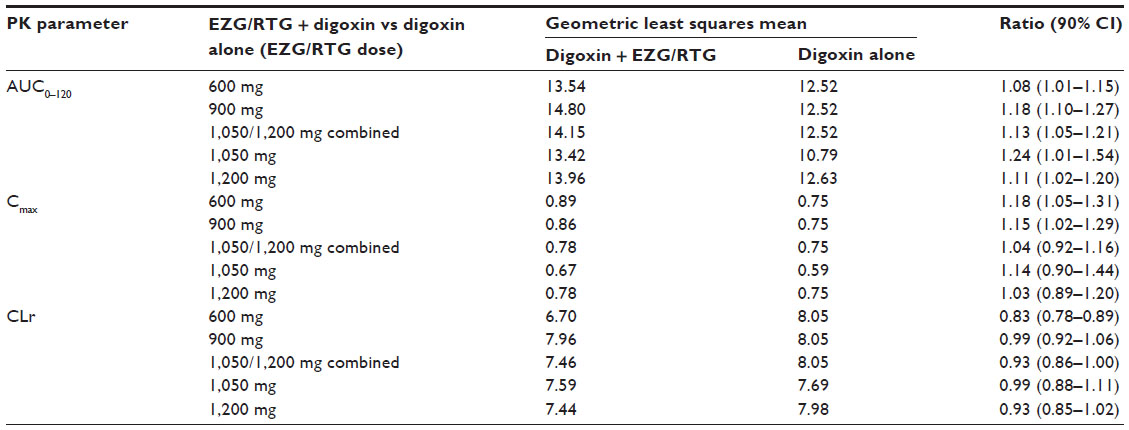 | Table 3 Summary of statistical analysis assessing the effect of EZG/RTG NAMR on the pharmacokinetics of digoxin |
Digoxin renal clearance was generally reduced when digoxin was co-administered with EZG/RTG. However, there was no relationship between the reduction in renal clearance and dose. The point estimate (90% CIs) for the ratio at EZG/RTG + digoxin to digoxin alone was lowest for the 600 mg/day dose group (0.83; 90% CI 0.78–0.89) and was close to unity for the 900 mg/day (0.99; 90% CI 0.92–1.06) and 1,050/1,200 mg/day (0.93; 90% CI 0.86–1.00) dose groups (Figure 2 and Table 3).
Systemic exposure to EZG/RTG and NAMR appeared to increase proportionally with dose over the 600–1,200 mg/day dose range. There was no apparent relationship between systemic exposure to NAMR (AUC0–8) and the magnitude of difference in digoxin AUC0–120 or CLr when digoxin was co-administered with EZG/RTG (Supplemental Figures S1A and S1B). NAMR peak concentrations achieved in the current study were consistent with those observed in previous studies (population PK results in Table 1): Geometric mean Cmax values were 538, 892, 1019, and 1165 ng/mL for the 600, 900, 1050, and 1200 mg dose groups, respectively.
Safety
When a single oral dose of digoxin 0.25 mg was administered alone in the study (session 1), AEs were reported by four (13%) subjects: two (7%) subjects reported somnolence and two (7%) reported dyspepsia.
A total of 29 participants were reported to have one or more AE during the study (Table 4), the most frequent AEs being somnolence (n=18), dizziness (n=17), and headache (n=16). Psychiatric disorders of euphoric mood, confusional state, and hallucinations were also reported by >10% of subjects.
 | Table 4 Summary of the most frequent adverse events (affecting ≥20% of participants during the entire study; safety population) |
Overall, 8 of 29 (28%) subjects who started EZG/RTG dosing did not complete the schedule because of AEs. AEs leading to withdrawal in session 2 were psychiatric symptoms (n=3; auditory hallucinations of moderate intensity in one subject; delirium in two subjects, one of mild and one of moderate intensity), increased levels of ALT (n=3), and dermatitis (n=1); one case of mild urticaria led to withdrawal in session 1. Withdrawals tended to occur at the higher doses of EZG/RTG.
There were no clinically significant changes from baseline in ECG measurements.
No shift in hematology parameters of clinical significance was reported during the study, although there were six occurrences of the total neutrophil count being below the normal range in participants of African–American heritage.
No deaths were reported during the study. One SAE (diverticulitis of moderate intensity considered by the clinical investigator to be possibly related to study-drug treatment) was reported at the follow-up visit in a subject receiving 1,200 mg EZG/RTG and resolved after 28 days. There were no unexpected AEs, and those observed resolved. Overall, the safety findings were consistent with previous EZG/RTG repeat-dose studies in healthy individuals (Valeant Pharmaceuticals International Study VRX-RET-E22-103, data on file, 2008).5,16
Discussion and conclusions
Pharmacokinetics
Findings from an in vitro study showed that the NAMR metabolite of EZG/RTG inhibited digoxin P-gp transport in a concentration-dependent manner (Valeant Pharmaceuticals International Study PR2008-017, data on file, 2008). Thus, there was potential for NAMR to affect the PK of digoxin in vivo, with the most likely mechanism being inhibition of P-gp in the kidney. The present study was therefore undertaken to assess the effect of NAMR on the PK of digoxin in healthy subjects, evaluating the impact of NAMR on the plasma PK and renal clearance of digoxin.
The design of this study was more complex than a typical digoxin interaction study in which single oral doses of digoxin are usually administered with or without steady-state dosing of therapeutic doses of the perpetrator drug. Owing to tolerability considerations for EZG/RTG, it is not possible to administer the highest recommended dose of 1,200 mg/day (400 mg TID) to healthy adult subjects without prior up-titration. Therefore, EZG/RTG was up-titrated according to the recommended titration regimen for patients with epilepsy. Single oral doses of digoxin were administered on the third day of dosing at three dose levels (600, 900, and 1,200 mg/day) over the therapeutic dose range of EZG/RTG. By the third day of EZG/RTG administration, steady state of EZG/RTG and NAMR is expected as the half-life of both parent and metabolite is approximately 6–8 hours. It was considered that repeat assessments of digoxin PK in the same subject, at increasing systemic exposure of NAMR, was a robust design to detect a possible NAMR effect on digoxin single-dose PK. The interval between the digoxin doses (14 days) was sufficient to ensure an appropriate PK sample collection (up to 144 hours post-dose) and to avoid digoxin carry-over, as demonstrated by none of the subjects having quantifiable concentrations at 144 hours.
Following co-administration of digoxin with EZG/RTG, the systemic exposure to EZG/RTG and NAMR (AUC0–8) appeared to increase proportionally with increasing dose over the 600 mg/day to 1,200 mg/day dose range, and was consistent with previously completed studies in healthy subjects and patients with partial-onset seizures (Valeant Pharmaceuticals International Studies VRX-RET-E22-103; VRX-RET-E22-301, data on file, 2009).5
Small changes (<20%) in digoxin exposure and renal clearance were observed with EZG/RTG co-administration, but were not considered to be clinically significant (Figure 2 and Table 3). The 90% CI for the digoxin geometric mean ratio of AUC0–120 for 1,050/1,200 mg/day versus baseline (occurring at the highest NAMR exposure) was within the CI range typically associated with bioequivalence (0.80–1.25) (Figure 2 and Table 3). Overall, the mean increase of digoxin AUC observed in this study was below the value of 25%, which, according to several authors, might increase the risk of digoxin toxicity11–13 and was the level stipulated in this study protocol to benchmark increases of digoxin of potential clinical relevance. Digoxin renal clearance was generally reduced when digoxin was co-administered with EZG/RTG (≤17%) compared with administration of digoxin alone. However, there was no relationship between the reduction in renal clearance and dose. In addition, there was no apparent relationship between systemic exposure to NAMR (AUC0–8) and magnitude of difference in digoxin AUC0–120 or CLr when digoxin was co-administered with EZG/RTG (Supplemental Figure S1). This finding is consistent with the statistical analysis conducted by dose level of EZG/RTG (Table 3).
Safety
The most frequent AEs in this study were classified as nervous system, gastrointestinal system, or psychiatric disorders. Overall, the frequency of subjects reporting AEs, and the type of AEs reported in this study, are in keeping with the results of previous clinical pharmacology studies with repeat doses of EZG/RTG in healthy subjects (Valeant Pharmaceuticals International Study VRX-RET-E22-103, data on file, 2008).5,16
One subject was withdrawn from the study after being dosed with digoxin alone in session 1 due to mild urticaria. During treatment with EZG/RTG, 8 of 29 (28%) subjects were withdrawn from the study due to an AE. The AEs that led to withdrawal were three cases of increased hepatic enzymes above stopping criteria; two episodes of delirium; one case of hallucination; one case of dermatitis; and one subject who withdrew consent to continued dosing because of several mild AEs. Overall, the AE withdrawal rate and types of AEs in this study are consistent with previous studies that up-titrated to 900 mg or 1,200 mg EZG/RTG in healthy subjects (RTG114137, 27%17; VRX-RET-E22-103, 35% [Valeant Pharmaceuticals International Study VRX-RET-E22-103, data on file, 2008]). One SAE, reported as diverticulitis, was identified at the follow-up visit in a subject who successfully completed 43 days of treatment, reaching the dose of 1,200 mg EZG/RTG. The SAE was of moderate intensity but required hospitalization; it resolved with intravenous metronidazole treatment. The clinical investigator assessed the SAE as being possibly related to the study drug because the symptoms started 2 days after the end of EZG/RTG dosing. Follow-up information provided by the clinical investigator indicated a final assessment of undiagnosed diverticulitis made apparent by constipation caused by EZG/RTG.
Conclusions
In summary, this digoxin interaction study used the full therapeutic dose range of EZG/RTG (600–1,200 mg), administered to healthy subjects, which resulted in an EZG/RTG dose-proportional increase in NAMR systemic exposure. The NAMR plasma concentrations achieved in this study were representative of the recommended approved maintenance doses of EZG/RTG for patients with partial-onset seizures.18
These doses of EZG/RTG in the therapeutic range resulted in small increases in digoxin AUC0–120 (8%–18%) and small decreases in digoxin renal clearance (1%–17%), which were neither dose dependent nor considered to be clinically significant (>25%). These findings suggest that additional monitoring of digoxin plasma concentrations and dose adjustments are not necessary when digoxin is co-administered with EZG/RTG.
Acknowledgment
The authors would like to thank Ann Walker (from GSK), for contribution to the protocol development, and the Clinical Investigator, Dr Azra Hussaini (PAREXEL). Professional medical writing and editorial support was provided by Harry Law, BSc (Caudex Medical, Oxford, UK) and funded by Valeant Pharmaceuticals and GSK.
Disclosure
CSC is a consultant to Valeant Pharmaceuticals North America. DJT, MB, and TA are employees and shareholders of GlaxoSmithKline (GSK). The study was supported by Valeant Pharmaceuticals International and funded by GSK (study number RTG 11216). The authors have no further conflicts of interest in this work.
References
Blackburn-Munro G, Dalby-Brown W, Mirza NR, Mikkelsen JD, Blackburn-Munro RE. Retigabine: chemical synthesis to clinical application. CNS Drug Rev. 2005;11(1):1–20. | |
Brodie MJ, Lerche H, Gil-Nagel A, et al. Efficacy and safety of adjunctive ezogabine (retigabine) in refractory partial epilepsy. Neurology. 2010;75(20):1817–1824. | |
French JA, Abou-Khalil BW, Leroy RF, et al. Randomized, double-blind, placebo-controlled trial of ezogabine (retigabine) in partial epilepsy. Neurology. 2011;76(18):1555–1563. | |
Porter RJ, Partiot A, Sachdeo R, Nohria V, Alves WM; 205 Study Group. Randomized, multicenter, dose-ranging trial of retigabine for partial-onset seizures. Neurology. 2007;68(15):1197–1204. | |
Tompson DJ, Crean CS. Clinical pharmacokinetics of retigabine/ezogabine. Curr Clin Pharmacol. 2013;8(4):319–331. | |
Borlak J, Gasparic A, Locher M, Schupke H, Hermann R. N–Glucuronidation of the antiepileptic drug retigabine: results from studies with human volunteers, heterologously expressed human UGTs, human liver, kidney, and liver microsomal membranes of Crigler-Najjar type II. Metabolism. 2006;55(6):711–721. | |
Lanoxin (digoxin) tablets, USP [package insert]. Greenville, NC: GlaxoSmithKline; 2009. Available from: http://www.accessdata.fda.gov/drugsatfda_docs/label/2010/020405s004lbl.pdf. Accessed July 16, 2013. | |
Tompson DJ, Crean CS, Reeve R, Berry NS. Efficacy and tolerability exposure-response relationship of retigabine (ezogabine) immediate-release tablets in patients with partial-onset seizures. Clin Ther. 2013;35(8):1174–1185. | |
US Food and Drug Administration. Drug Development and Drug Interactions: Regulatory Guidance and Manual for Policies and Procedures. Silver Spring, MD: US FDA; 2006. Available from: http://www.fda.gov/Drugs/DevelopmentApprovalProcess/DevelopmentResources/DrugInteractionsLabeling/ucm093606.htm. Accessed July 16, 2013. | |
Giacomini KM, Huang SM, Tweedie DJ, et al; International Transporter Consortium. Membrane transporters in drug development. Nat Rev Drug Discov. 2010;9(3):215–236. | |
Bauman JL, Didomenico RJ, Galanter WL. Mechanisms, manifestations, and management of digoxin toxicity in the modern era. Am J Cardiovasc Drugs. 2006;6(2):77–86. | |
Fenner KS, Troutman MD, Kempshall S, et al. Drug-drug interactions mediated through P-glycoprotein: clinical relevance and in vitro- in vivo correlation using digoxin as a probe drug. Clin Pharmacol Ther. 2009;85(2):173–181. | |
Tuncok Y, Hazan E, Oto O, Guven H, Catalyurek H, Kalkan S. Relationship between high serum digoxin levels and toxicity. Int J Clin Pharmacol Ther. 1997;35(9):366–368. | |
Srinivas NR. Cranberry juice ingestion and clinical drug-drug interaction potentials: review of case studies and perspectives. J Pharm Pharm Sci. 2013;16(2):289–303. | |
Posner K, Brown GK, Stanley B, et al. The Columbia-Suicide Severity Rating Scale: initial validity and internal consistency findings from three multisite studies with adolescents and adults. Am J Psychiatry. 2011;168(12):1266–1277. | |
Ferron GM, Paul J, Fruncillo R, et al. Multiple-dose, linear, dose-proportional pharmacokinetics of retigabine in healthy volunteers. J Clin Pharmacol. 2002;42(2):175–182. | |
Brickel N, DeRossett S, Buraglio M, Evans C, Jones S. Investigation of the impact of urine handling procedures on interpretation of urinalysis findings and product safety in subjects treated with ezogabine. Ther Clin Risk Manag. 2013;9:207–213. | |
European Medicines Agency. Summary of Product Characteristics: Trobalt (last updated April 2, 2013). London: European Medicines Agency; 2014. Available from: http://www.ema.europa.eu/docs/en_GB/document_library/EPAR_-_Product_Information/human/001245/WC500104835.pdf. Accessed July 16, 2013. |
Supplementary materials
 | Figure S1A NAMR AUC0–8 versus digoxin AUC ratio. |
 | Figure S1B NAMR AUC0–8 versus digoxin renal clearance ratio. |
 © 2014 The Author(s). This work is published and licensed by Dove Medical Press Limited. The full terms of this license are available at https://www.dovepress.com/terms.php and incorporate the Creative Commons Attribution - Non Commercial (unported, v3.0) License.
By accessing the work you hereby accept the Terms. Non-commercial uses of the work are permitted without any further permission from Dove Medical Press Limited, provided the work is properly attributed. For permission for commercial use of this work, please see paragraphs 4.2 and 5 of our Terms.
© 2014 The Author(s). This work is published and licensed by Dove Medical Press Limited. The full terms of this license are available at https://www.dovepress.com/terms.php and incorporate the Creative Commons Attribution - Non Commercial (unported, v3.0) License.
By accessing the work you hereby accept the Terms. Non-commercial uses of the work are permitted without any further permission from Dove Medical Press Limited, provided the work is properly attributed. For permission for commercial use of this work, please see paragraphs 4.2 and 5 of our Terms.