")
Back to Journals » International Journal of Nanomedicine » Volume 19
Lipid Nanoparticle-Based Inhibitors for SARS-CoV-2 Host Cell Infection
Authors Yathindranath V , Safa N, Tomczyk MM, Dolinsky V, Miller DW
Received 7 November 2023
Accepted for publication 19 March 2024
Published 28 March 2024 Volume 2024:19 Pages 3087—3108
DOI https://doi.org/10.2147/IJN.S448005
Checked for plagiarism Yes
Review by Single anonymous peer review
Peer reviewer comments 2
Editor who approved publication: Professor R.D.K. Misra
Vinith Yathindranath,1,2 Nura Safa,1,2 Mateusz Marek Tomczyk,1,3 Vernon Dolinsky,1,3 Donald W Miller1,2
1Department of Pharmacology and Therapeutics, University of Manitoba, Winnipeg, MB, Canada; 2PrairieNeuro Research Centre, Health Science Centre, Winnipeg, MB, Canada; 3Children’s Hospital Research Institute Manitoba, Health Science Centre, Winnipeg, MB, Canada
Correspondence: Donald W Miller, Tel +1 204 789 3278, Email [email protected]
Purpose: The global pandemic caused by severe acute respiratory syndrome coronavirus 2 (SARS-CoV-2) and the lingering threat to public health has fueled the search for effective therapeutics to treat SARS-CoV-2. This study aimed to develop lipid nanoparticle (LNP) inhibitors of SARS-CoV-2 entry to reduce viral infection in the nose and upper airway.
Methods: Two types of LNP formulations were prepared following a microfluidic mixing method. The LNP-Trap consisted of DOPC, DSPC, cholesterol, and DSPE-PEG-COOH modified with various spike protein binding ligands, including ACE2 peptide, recombinant human ACE2 (rhACE2) or monoclonal antibody to spike protein (mAb). The LNP-Trim consisted of ionizing cationic DLin-MC3-DMA, DSPC, cholesterol, and DMG-PEG lipids encapsulating siACE2 or siTMPRSS2. Both formulations were assayed for biocompatibility and cell uptake in airway epithelial cells (Calu-3). Functional assessment of activity was performed using SARS-CoV-2 spike protein binding assays (LNP-Trap), host receptor knockdown (LNP-Trim), and SARS-CoV-2 pseudovirus neutralization assay (LNP-Trap and LNP-Trim). Localization and tissue distribution of fluorescently labeled LNP formulations were assessed in mice following intranasal administration.
Results: Both LNP formulations were biocompatible based on cell impedance and MTT cytotoxicity studies in Calu-3 cells at concentrations as high as 1 mg/mL. LNP-Trap formulations were able to bind spike protein and inhibit pseudovirus infection by 90% in Calu-3 cells. LNP-Trim formulations reduced ACE2 and TMPRSS2 at the mRNA (70% reduction) and protein level (50% reduction). The suppression of host targets in Calu-3 cells treated with LNP-Trim resulted in over 90% inhibition of pseudovirus infection. In vivo studies demonstrated substantial retention of LNP-Trap and LNP-Trim in the nasal cavity following nasal administration with minimal systemic exposure.
Conclusion: Both LNP-Trap and LNP-Trim formulations were able to safely and effectively inhibit SARS-CoV-2 pseudoviral infection in airway epithelial cells. These studies provide proof-of-principle for a localized treatment approach for SARS-CoV-2 in the upper airway.
Keywords: lipid nanoparticles, SARS-CoV-2, antiviral, gene knockdown, intranasal drug delivery
Graphical Abstract:
Introduction
The emergence of a novel SARS-coronavirus-2 (SARS-CoV-2) and the resulting COVID-19 pandemic has had crippling effects on public health and the global economy. Statistics from the World Health Organization (WHO) reported over 758 million confirmed cases of COVID-19 and over 6.8 million related deaths.1 The COVID-19 and earlier SARS (2002) and Middle East respiratory syndrome (MERS; 2012) outbreaks were caused by closely related coronaviruses (CoV).2 These viruses use spike proteins to bind and gain entry to specific host cell receptors during infection. While the development of effective vaccines for SARS-CoV-2 has been critical in slowing the spread and limiting mortality, reliance on vaccination alone is not sufficient as there remain sizeable portions of the population that are not fully vaccinated. Furthermore, there remains the possibility for variants of concern (VOC) to emerge that have reduced response to vaccines and present an even greater risk of infection and morbidity.3 Given that SARS-CoV-2 will likely remain a concern going forward in the foreseeable future, there is a need to continue identification and development of additional treatment options for this virus and any emerging variants of interest that may appear.
Initially, efforts at identifying antiviral agents effective against SARS-CoV-2 focused on repurposing existing chemical libraries of approved drugs.4,5 These efforts identified several potential therapeutics and resulted in some “hits” that have been of use, such as dexamethasone for ICU and ventilated patients, Paxlovid (orally active), and Remdesivir (iv infusion) antivirals for use in infected patients at risk of morbidity or death from severe infection.6–8 Administration of convalescent plasma from recovered COVID-19 patients was also reported to prevent hospitalizations in a clinical trial of outpatients with recently confirmed SARS-CoV-2 infection.9 Along those same lines, combination therapy with Bamlanivimab and Etesevimab monoclonal antibodies reduced viral load in patients with mild to moderate illness.10 Despite these initial efforts, there is still a need for effective and affordable agents for preventing and treating SARS-CoV-2 infections in the general population.
The spike protein of SARS-CoV-2 contains two domains (S1 and S2) that are separated by a furin cleavage site.11 For viral infection, the S1 receptor binding domain on the viral particle binds to ACE2 receptors on host cells (Figure 1A). Proteolytic cleavage of the S1 and S2 domains by Furin and host transmembrane protease serine 2 (TMPRSS2) activates the S2 fusion machinery, leading to viral entry and the release of viral genomic RNA into the host cells.12 The viral RNA hijacks the host cell machinery to express viral mRNA and non-structural (NSPs) and structural (spike (S), envelop (E), membrane (M), and nucleocapsid (N)) proteins that are vital for viral replication, assembly and release.12 Once released from the host cells, newly generated virions can infect surrounding cells through the same process.
 |
Figure 1 Schematic representation of (A) SARS-CoV-2 S pseudotyped lentivirus infection aided by S protein ACE2 binding and TMPRSS2. Knocking down of ACE2 and TMPRSS2 using LNP-siRNA LNP-trim inhibiting lentivirus entry (B). The presence of LNPs with surface ACE2 peptide (LNP-trap1), rhACE2 (LNP-trap2), and mAb (LNP-trap3) bind to the lentivirus, thereby inhibiting cell entry and infection (C). |
Agents acting as decoys for targeting, trapping, and neutralizing viruses are emerging as promising technology to control infections.3,13 Several monoclonal antibody (mAb) based decoys were developed for neutralizing a wide range of HIV variants.14 Though the earlier studies with these mAbs displayed poor antiviral activity in vivo, the recent development of highly potent new-generation mAbs and their success in clinical trials has revived the interest in mAb decoys for HIV.15,16 Recently, two mAb drugs, bamlanivimab and etesevimab, that bind SARS-CoV-2 S-protein were granted Emergency Use Authorization (EUA) in adult and pediatric (12 years and older) patients with mild to moderate COVID-19 symptoms.17,18 However, the use of mAb therapeutics has the risk of viral variants that can develop drug resistance. Indeed, while bamlanivimab and etesevimab have prevented severe COVID-19 symptoms in patients, these mAb antiviral drugs have been less effective in treating more recent variants of SARS-CoV-2.19 Hence, viral decoy and trapping agents with a broad-spectrum affinity against variants of interest would have a clear advantage over these mAb antiviral drugs.
Engineered host cell receptors can act as decoys and competitively bind and neutralize viruses. Several studies have reported the successful use of engineered ACE2 in various forms as a broad-spectrum decoy for neutralizing SARS-CoV-2.19,20 An advantage of this approach is that host cell receptor-based decoys generally have less chance for resistance, as if such variants were to occur, it naturally would have reduced affinity towards the host cell receptor resulting in impaired infectivity.20 Recombinant soluble rACE2 was developed to treat acute respiratory distress syndrome (ARDS) and progressed successfully through initial clinical trials, demonstrating safety.21 Similarly, several peptide mimics of ACE2 have been developed as inhibitors for SARS-CoV-2 and have been extensively reviewed elsewhere.22,23 However, rACE2, when administered intravenously, exhibited a short half-life of ~3 hours in humans.24 To improve the pharmacokinetics of rACE2, further modification, for example, fusing with wild-type IgG1-Fc, was performed.25
One of the most widely studied host-cell decoy approaches involves encapsulating nanoparticles in cell vesicles isolated from cells expressing the viral host receptor(s) of interest. Wei et al prepared poly(lactic-co-glycolic acid) (PLGA) nanoparticles that were coated with plasma membrane isolated from CD4+ T cells.26 These T-cell mimicking nanoparticles were shown to bind and neutralize HIV and prevent infection of human peripheral blood mononuclear cells (PBMCs) in vitro. In regard to SARS-CoV-2, Rao et al isolated membrane vesicles from THP-1 and T293/ACE2 expressing cells and used them as decoys for binding viral particles.27 The vesicles with high amounts of ACE2 and cytokine receptors successfully neutralized SARS-CoV-2 in Vero-E6 cells and neutralized inflammatory cytokines, thereby effectively suppressing the immune response and lung injury in the acute lung injury mouse model.
Recently, there has been growing interest in using RNAi to knockdown the SARS-CoV-2 gene inside host cells. As SARS-CoV-2 entry and infection is primarily facilitated by ACE2 and TMPRSS2, knocking down these target proteins in host cells could also provide a method for inhibiting viral infection. However, as transgenic mice lacking ACE2 display enhanced lung and kidney toxicity, a more selective and transient approach to silencing these host targets is required.28
Since the primary site of infection for SARS-CoV-2 is the nasal epithelium, a localized nasal cavity-targeted antiviral therapy could be an effective first line of defense against infection.29 Here, we describe a two-pronged localized nanomaterial-based approach for limiting SARS-CoV-2 infection in nasal and upper airway epithelial cells that involves lipid nanoparticles (LNPs) that act as receptor decoys to bind viral spike protein (LNP-Trap) and LNPs to deliver siRNA to host cells and knockdown the viral entry targets (LNP-Trim). The LNP-Trap formulations consisted of cell-impermeable lipid nanoparticles surface modified with ACE2 peptide, rhACE2 or SARS-CoV-2 spike mAb that can bind to SARS-CoV-2 and potentially neutralize them. The viral trapping ligands were conjugated to the LNPs through simple EDC/NHS coupling reactions.22 In contrast, the LNP-Trim formulations were cell-permeable and could deliver siRNA to reduce ACE2 and TMPRSS2 expression in host cells. Target validation of the LNP-Trap and LNP-Trim formulations were evaluated using viral spike protein and the Calu-3 human airway epithelial cell line and HEK-293 cells transfected with human ACE2 (HEK-hACE2), respectively. The pharmacological effectiveness of LNP-Trap and LNP-Trim formulations was evaluated in Calu-3 and HEK-hACE2 using a pseudotyped SARS-CoV-2 lentivirus. The in vitro studies demonstrated that the LNP-Trap and LNP-Trim formulations were safe and effective at inhibiting virus-host cell interactions and reducing viral infection. Initial assessment of the LNP-Trap and LNP-Trim following nasal administration in mice confirmed nasal retention and biocompatibility.
While conventional vaccines have been extensively studied and successfully implemented, there remains a gap in research focusing on localized antiviral therapeutics specifically targeting the nasal epithelium. The presented proof-of-concept study is an effort to bridge that gap by exploring LNP antiviral therapeutics for local nasal delivery. Successful development of the proposed strategy could be another promising avenue for the development of next-generation COVID-19 therapeutics with broad-spectrum efficacy for improved patient outcomes.
Materials and Methods
1,2-dioleoyl-sn-glycero-3-phosphocholine (DOPC), 1,2-distearoyl-sn-glycero-3-phosphocholine (DSPC), 1,2-distearoyl-sn-glycero-3-phosphoethanolamine-N-[carboxy(polyethylene glycol)-2000] (sodium salt) (DSPE-PEG-COOH), 1,2-dimyristoyl-rac-glycero-3-methoxypolyethylene glycol-2000 (DMG-PEG) and cholesterol was obtained from Avanti/Sigma-Aldrich (St. Louis, MO). 4-(dimethylamino)-butanoic acid, (10Z,13Z)-1-(9Z,12Z)-9,12-octadecadien-1-yl-10,13-nonadecadien-1-yl ester (DLin-MC3-DMA or MC3) was obtained from Cayman Chemicals (Ann Arbor, MI). SARS-CoV-2 S Pseudotyped Luciferase Lentivirus was purchased from Creative Biogene (Shirley, NY). N-(3-Dimethylaminopropyl)-N′-ethylcarbodiimide hydrochloride (EDC), N-hydroxysuccinimide (NHS) and Pierce™ Firefly Luciferase Glow Assay Kit was obtained from Thermo Fisher (Rockford, IL). Benzoxazolium, 3-octadecyl-2-[3-(3-octadecyl-2(3H)-benzoxazolylidene)-1-propenyl]-, perchlorate (DiO) was obtained from Invitrogen (Carlsbad, CA). The ACE2 peptide (Sequence: H-EEQAKTFLDKFNHEAEDLFYQSS-OH) was custom-synthesized by CanPeptide (St-Laurent, QC). The Human ACE2 Protein, His Tag, and Anti-SARS-CoV-2 Spike RBD Neutralizing Antibody, Human IgG1, were purchased from ACROBio systems (Newark, DE). The SARS-CoV-2 Spike RBD-ACE2 Blocking Antibody Detection ELISA kit was purchased from Cell Signalling Technology (Danvers, MA). Silencer Select pre-designed siRNA targeting ACE2 (siACE2; sense 5′→3′ GGAUCCUUAUGUGCACAAAtt and antisense 5′→3′ UUUGUGCACAUAAGGAUCCtg), TMPRSS2 (siTMPRSS2; sense 5′→3′ GCAGAUAUGUCUAUGACAAtt and antisense 5′→3′ UUGUCAUAGACAUAUCUGCtg) and negative siRNA control siSCR were purchased from Ambion by Life Technologies (Carlsbad, CA). Lipid nanoparticles were prepared following the microfluidic mixing method using the NanoAssemblr Benchtop instrument by Precision NanoSystem (Vancouver, BC).
Cell Culture
Human lung epithelial ‒ Calu-3 (CVCL_0609) and human embryonic kidney epithelial ‒ HEK-293 cell lines were obtained from ATCC (Manassas, VA). HEK-293/human ACE2 cell line (HEK-293-hACE2) was obtained from ACRO Biosystems (Newark, DE). Calu-3 cells were cultured in Dulbecco’s Modified Eagle Medium: Nutrient Mixture F-12 (DMEM/F12) (Gibco, Carlsbad, CA) with 10% fetal bovine serum (FBS; Gibco), GlutaMAX (Gibco, Carlsbad, CA) and 1% penicillin-streptomycin (Gibco, Carlsbad, CA). HEK-293 and HEK-293-hACE2 cells were cultured in DMEM (Gibco, Carlsbad, CA) supplemented with 10% FBS, non-essential amino acids (Gibco, Carlsbad, CA), and 1% penicillin-streptomycin. Cells were grown in cell culture flasks at 37 °C in a humidified incubator under a 5% CO2 overlay for routine cell culture.
Preparation of LNP-COOH
The lipid mix containing DOPC/DSPC/cholesterol/DSPE-PEG-COOH/DiR at the molar % ratio (46.5/10/38/5/0.5) and a total lipid concentration of 10 mg/mL was prepared in ethanol. The LNP-COOH was prepared following the micromixing method with the lipid mix in ethanol as the organic phase (Org.) and PBS (pH 7.4) as the aqueous phase (Aq.). A flow rate ratio (FRR) of 1:3 (organic phase: aqueous phase) and a total flow rate (TFR) of 12 mL/minute were used for the LNP-COOH preparation. The crude LNP-COOH was washed using PBS (pH 7.4) following centrifugal filtration (2000g, MWCO 10,000). The purified product in PBS was stored at 4 °C until further use.
Preparation of LNP-Trap Formulations
The base LNP-COOH in PBS was exchanged to 0.1 M MES buffer (pH = 6), and a molar excess of EDC (10×) and NHS (25×) with respect to DSPE-PEG-COOH was added. The contents were mixed at ambient conditions for one hour. Later, mercaptoethanol (0.6µL/mL) was added, and the pH of the reaction mixture was adjusted to 7.4 using 1 M NaOH. A 0.3 molar equivalent of ACE2 peptide, rhACE2, or mAb compared to DSPE-PEG-COOH was added to the activated LNP-COOH, and the mixture was mixed for two hours. After two hours, the pH of the reaction mixture was raised to 9.0 using 1 M NaOH. The crude LNP-Trap formulations were washed (PBS pH= 7.4) and concentrated using centrifugal filtration (2000g; MWCO 100 kDa). The concentration (mg/mL) of conjugated ligands was quantified based on absorbance at 205 nm (A205) and the Scopes method option using a Thermo Scientific NanoDrop spectrophotometer.30 The as-prepared LNP-PEP (LNP-Trap1), LNP-rhACE2 (LNP-Trap2) and LNP-mAb (LNP-Trap3) in PBS were stored at 4 °C for up to a month until further studies.
Preparation of LNP-Trim
A lipid mixture containing MC3/DSPC/cholesterol/DSPE-PEG-COOH/DiO at the molar % ratio (50/10/38/1.5/0.5) and a total lipid concentration of 10 mg/mL was prepared in ethanol. The siRNA (siACE2 or siTMPRSS2) was dissolved in sodium acetate buffer (25 mmol, pH = 4) to yield a 0.33 mg/mL concentration. The organic lipid mix and the aqueous siRNA solution were micromixed at a flow rate ratio (FRR) of 1:3 (organic: aqueous) and a total flow rate (TFR) of 12 mL/min. The as-prepared LNP-siRNA was diluted in PBS (pH = 7.4) and concentrated using a centrifugal filter (2000×g, MWCO 10,000) to its original volume. The concentration of the encapsulated siRNA in the LNP-siRNA formulation was measured using a Thermo Scientific NanoDrop spectrophotometer (Madison, WI). The LNP-siACE2 (LNP-Trim1) and LNP-siTMPRSS2 (LNP-Trim2) were stored at 4 °C for up to a month without losing stability (based on negligible change in hydrodynamic diameter) and activity (knockdown efficiency).
The percentage encapsulation efficiency (EE%) was calculated using the following formula:
Transmission Electron Microscopy (TEM) Imaging
For TEM imaging of LNP-Trap and LNP-Trim, samples dissolved in water were drop-cast onto a carbon-coated copper grid (400 mesh) and negatively stained with 1% phosphotungstic acid (Sigma-Aldrich (St. Louis, MO) in DIW for three minutes. The grids were blotted and air- dried before TEM imaging using FEI Talos F200X S/TEM. The actual LNP core diameter from the images was determined by measuring 100 individual nanoparticles from several images using Image J software.
Size and Charge Determination of LNPs
The particle size (hydrodynamic) and the net surface charge (zeta potential) of the LNP-Trap and LNP-Trim formulations were measured using ZetaPALS (Brookhaven Instruments, NY, USA) dynamic light scattering instrument. LNPs were diluted to 20 µg/mL lipid concentration in PBS (pH 7.4) before analysis. The polydispersity index (PDI) obtained from the dynamic light scattering instrument was used to determine the size distribution of the LNPs (lower PDI meaning monodisperse LNPs).
Cell Impedance Studies
The real-time cell cytotoxicity assay was performed using an Agilent xCELLigence RTCA DP instrument (San Diego, CA). Calu-3 cells were seeded (1.4x10⁴ cells/well) in collagen-coated xCELLigence 16 well E-plates. The E-plates were background corrected prior to seeding the cells. The E-plates were transferred to the RTCA DP instrument maintained inside the 37 °C incubator under a 5% CO2 overlay. The cell growth and attachment were monitored in real-time using cellular impedance presented as a unitless parameter termed cell index (CI). The CI values increased with cell growth/attachment. The following day, different concentrations of LNP-COOH (10–1000 µg/mL) were added to the wells. The CI values of the control and the treatment groups were recorded at 15-minute intervals for 24 hours. Data was analyzed using the xCELLigence software package to obtain the baseline normalized CI values. The control group was used to set the baseline, and the CI values were normalized to a time point just before the addition of treatments to obtain the baseline normalized CI values.
Cytotoxicity Studies of LNPs
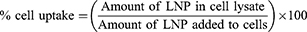
For cytotoxicity studies, Calu-3 cells were seeded (1.875x10⁵ cells/cm2) in 96-well plates and grown for 24 hours. The following day, various concentrations (0.01–1.00 mg/mL) of LNPs were added to the cells and incubated for 24 hours. After 24 hours, the media and treatments were removed and replaced with fresh media, and the cells were cultured for an additional 48 hours before toxicity was assessed by MTT assay. Briefly, the MTT reagent was prepared by dissolving 3-(4,5-Dimethylthiazol-2-yl)-2,5-Diphenyltetrazolium Bromide in PBS (pH 7.4) at a concentration of 5 mg/mL. For the assay, 25 µL of the MTT reagent and 100 µL of complete media were added to each well, and the cells were incubated in a 5% CO2 incubator for two hours at 37 °C. The viable cells convert water-soluble MTT (yellow color) to water-insoluble formazan (purple color) crystals via NAD(P)H-dependent oxidoreductase enzymes. After two hours, media with MTT reagent was carefully removed without disturbing the cells, and DMSO was added to dissolve the purple formazan crystals. Later, the absorbance at 570 nm (A570) was measured using a plate reader to quantify the formazan. The percentage cell viability was calculated as follows:
Cell Uptake Studies
Calu-3 cells were seeded (1x10⁵ cells/cm2) in 24-well plates and grown to confluence in a 37 °C incubator under a 5% CO2 overlay. For uptake studies, 100 µg/mL of LNP-PEP and LNP-rhACE2 were added to the cells, and the uptake was monitored over different time points (1–5 hours). At each time point, the LNP treatment was removed, and the cells were washed three times with PBS (pH = 7.4). After washing, the PBS was completely aspirated, and the cells were lysed by adding 0.1% Triton-X-100 (in PBS). The cell lysates were analyzed using Thermo Scientific™ Varioskan™ LUX multimode microplate reader at Ex/Em: 484/510. The amount of LNPs in lysates was quantified using a standard curve obtained using corresponding LNPs. The percentage cell uptake was calculated using the following equation:
Transfection Using LNP-siRNA
Cells were seeded (2x10⁴ cells/cm2) in a 6-well plate. The following day, LNP-siRNA (siACE2, siTMPRSS2 or siSCR) equivalent to 40 nM siRNA concentration was added to the wells and incubated for 24 hours in a 5% CO2 incubator at 37 °C. After 24 hours, the transfection media was replaced with fresh, complete media, and the cells were placed in the CO2 incubator. The transfected cells were further incubated for the desired length of time before mRNA and protein isolation for quantification. For pseudovirus infection studies, cells were seeded (2x10⁴ cells/cm2) in T-25 flasks and transfected with LNP-siRNA, as discussed above. Forty-eight hours after transfection, the cells were seeded in 96 well plates (2x10⁴ cells/well) for further pseudovirus infection studies.
Real-Time One-Step RT-PCR
Total mRNA was isolated from cells using TRIzol reagent (Invitrogen, Burlington, ON), following the manufacturer’s protocol. The concentration of isolated mRNA in the solution was estimated spectrophotometrically. The one-step qPCR reactions were performed using iTaq™ Universal SYBR® Green One-Step Kit (Bio-Rad) following the manufacturer’s protocol. For a 20 µL reaction, 0.5 µg mRNA was used. The primers (Invitrogen) specific for ACE2 (sense 5’-GGTGGGAGATGAAGCGAGAG-3′ and antisense, 5’- ACATGGAACAGAGATGCGGG-3′), TMPRSS2 (sense 5’-AGGTGAAAGCGGGTGTGAGG-3′ and antisense, 5’-ATAGCTGGTGGTGACCCTGAG-3′), and the internal control 18S (sense 5’-AAACGGCTACCACATCCAAG-3′ and antisense, 5’-CCTCCAATGGATCCTCGTTA-3′) was used. Thermocycling [Reverse transcription: 50 °C (10 min.), Polymerase activation and DNA denaturation: 95 °C (1 min.), 40 cycles (Denaturation: 95 °C (15 sec.), Annealing: 60 °C (60sec.) and readout)] was carried out using AppliedBiosystems AB7500 instrument. The relative mRNA levels compared to controls were calculated following the 2−ΔΔCT method.
Western Blot
Cells were washed with PBS (3×) and lysed using RIPA buffer. Lysates in ice were sonicated for 10 seconds and centrifuged at 15000g for fifteen minutes. The supernatant was collected, and the total protein concentration was measured using the Pierce® BCA Protein Assay Kit (Fisher Scientific, Waltham, MA). The lysates (40 µg protein/well) were mixed with 5× loading buffer, separated on 10% polyacrylamide gel, and transferred to polyvinylidene difluoride (PVDF) membranes. The PVDF membrane was incubated for an hour in blocking buffer [5% (w/v) skimmed milk in TBST – tris-buffered saline (pH 7.4) with 0.1% (v/v) Tween®20] for an hour at room temperature. The membrane was incubated overnight with anti-ACE2 (SN0754) in 5% (w/v) skimmed milk in TBST – tris-buffered saline (pH 7.4) at 4 °C overnight. The membrane was washed (4× 15 minutes) in TBST buffer and incubated with HRP-conjugated secondary antibody for one hour at room temperature. Later, the membranes were washed (4× 15 minutes) in TBST buffer, and blots were visualized by enhanced chemiluminescence (Biorad) as per the manufacturer’s protocol.
Staining and Confocal Imaging
Calu-3 cells were seeded (1x10⁴ cells/chamber) in 8-well glass bottom chamber slides (Thermo, 155,382) and grown to ~50% confluency. Cells were treated with 200 µg/mL of LNP-siACE2 and LNP-PEP and incubated for three hours at 37 °C. Following the incubation period, the treatments were removed, and the cells were washed three times with PBS (pH = 7.4). Cell membranes were stained with Wheat Germ Agglutinin Alexa FluorTM 594 (WGA 5940: Thermo, W11262) to visualize cell boundaries. WGA 594 conjugate was prepared according to the manufacturer’s recommendations. Briefly, 5 mg of WGA 594 conjugate was resuspended in 5 mL of 1× PBS to make a 1.0 mg/mL stock solution. Protein conjugate was centrifuged to eliminate protein aggregates and reduce non-specific binding, and the supernatant was used for the experiment. A working concentration of 5 µg/mL was made up in Hanks Buffered Salt Solution (HBSS) for staining. Cells were stained for 10 mins at 37 °C and fixed with 4% paraformaldehyde for 15 minutes. Cells were washed three times with 1× PBS, and nuclei were stained with Hoechst dye (Thermo, 33,342) at a final concentration of 20 µM for 30 minutes at room temperature and washed with 1× PBS before mounting. Slides were allowed to dry and were mounted with Fluoromount-G® Mounting Medium (SouthernBiotech, 0100–01). A 1.5 mm thick microscope cover glass was used (Fischer, 12544G). Standard 2D and z-stack images were acquired using CarlZeiss LSM700 laser scanning confocal microscope and visualized using the ZenPro software. All images were taken using a 63×/1.4 oil-immersion objective. Imaging parameters for z-stack acquisition were selected to optimize resolution and are as follows: x-, y-scaling = 0.156 µm, z-scaling =1 µm, pixel dwell=3.5 µs, average = line 2, master gain = 550, digital gain = 1, pinhole=34 µm, 30 µm, and 39 µm, beam splitters = 585 nm, 587 nm and 492 nm, laser power 2%.
SARS-CoV-2 Spike Protein Binding Studies
The ability of LNP-Trap to bind to SARS-CoV-2 spike protein was evaluated using SARS-CoV-2 Spike RBD-ACE2 Blocking Antibody Detection ELISA Kit (Cell Signalling Technology) following the manufacturer’s protocol. Briefly, 65 µL of LNP-Trap formulations (100 µg/well) or controls (assay buffer) were pre-incubated with 65 µL SARS-CoV-2 Spike RBD Protein for one hour at 37 °C. Later, 100 µL of the preincubated sample mixtures were added to the ACE2 protein-coated microwell plate. The wells were sealed with the sealing tape and incubated for 1 hour at 37 °C. The contents in the wells were removed and washed four times with the supplied ELISA wash buffer. To the washed wells, 100 µL of supplied 3.3’, 5.5’ tetramethylbenzidine (TMB) was added, sealed with the tape, and incubated for ten minutes in the dark. Later, 100 µL of the supplied stop solution was added to the assay wells, and the absorbance at 450 nm was measured using a plate reader. The percentage inhibition was calculated using the following equation:

The inhibition ≥ 20% indicated a positive result for SARS-CoV-2 spike protein binding and inhibition.
Infection Using SARS-CoV-2 S Pseudotyped Luciferase Lentivirus (LV)
Cells were seeded (6.25x10⁴ cells/cm2) in 96 well plates and incubated overnight at 37 °C with 5% CO2. The following day, the desired amount of LV transduction unit [TU = MOI × cell number] corresponding to the desired multiplicity of infection (MOI) was added to the cells and incubated for 6 hours. Six hours later, the media containing LV was removed and replaced with fresh media. Forty-eight hours after infection, the transduction efficiency was estimated using a firefly luciferase assay kit following the manufacturer’s protocol.
Pseudotyped SARS-CoV-2 Virus Inhibition Assay
Virus inhibition assays using LNP-Trap and LNP-Trim formulations were performed in Calu-3, HEK293, and HEK293-hACE2 cells. The cells were seeded and cultured as described above in the virus infection studies. For studies using the LNP-Trap formulations, various amounts of LNP-PEP, LNP-rhACE2, or LNP-mAb were added to the cells along with pseudotyped SARS-CoV-2 LV for cell infection as described above. In the case of studies with LNP-Trim formulations, the cells were transfected with LNP-siACE2 or LNP-siTMPRSS2, as described earlier. Forty-eight hours after transfection, the transfected cells were seeded for further pseudotyped SARS-CoV-2 LV infection studies at 72 hours post-transfection. The transduction efficiency/luciferase expression in cells was determined using a Pierce™ Firefly Luciferase Glow Assay Kit (Thermo Fisher; Rockford, IL) and plate reader with values reported in relative luminescence units (RLU). The percentage inhibition of the virus was calculated using the following equation:
Intranasal Administration and Distribution of LNP-PEP and LNP-siACE2
Adult male and female nude mice were purchased from Charles River. The mice were maintained in the University of Manitoba Central Animal Care Facility under a temperature-controlled environment with a 12-hour dark-light cycle and unlimited access to food and water. All experiments complied with the Canadian Council on Animal Care guidelines and the protocol (#22-040) approved by the University of Manitoba Animal Care Committee. Before intranasal administration, the mice were anesthetized with 2.5% isoflurane. The LNP formulation (LNP-PEP and LNP-siACE2) in PBS was administered with a Hamilton microsyringe with a blunt needle tip inserted 3 mm into the nostril (5 µL per nostril; 4 mg/Kg final dose). Serial images of the fluorescent LNPs were taken at different time intervals (5, 10, 15, 30, 60, 120, 180, and 1440 minutes) using a PerkinElmer/Caliper IVIS Spectrum optical imaging system (Ex/Em: 745/800 nm; Binning Factor: 4 and Exposure Time: 10 seconds). The fluorescence activity at different time points in specified regions of interest (ROI) was estimated as Total Radiant Efficiency [p/s]/[µW/cm²] using PerkinElmer Living Image® software.
Analysis of Coefficient of Therapy Interaction (CTI)
Synergistic activity was evaluated using a coefficient of therapy interaction (CTI). The CTI values were calculated using the following equation: CTI = AB/(A × B), where AB is the ratio of the RLU (luminescence assay) of the combination of two therapies (A and B) to the control, and A and B are the ratios of the individual treatment groups to the control.31,32 A CTI < 1 indicates synergism, a CTI = 1 indicates an additive response, and a CTI > 1 indicates antagonism of the combined therapies.
Statistical Analysis
All data are expressed as the mean ± standard error of the mean (SEM). Statistical analysis was performed using one-way or two-way ANOVA, followed by Tukey’s test. In all studies, p < 0.05 was considered statistically significant.
Results
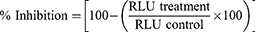
In this study, we used a two-pronged approach for inhibiting the SARS-CoV-2 infection in host cells. The first approach involved the non-cell penetrating LNP-Trap formulations that can bind to the viral spike protein via surface ligand, thereby neutralizing the SARS-CoV-2 pseudovirus (Figure 1). The second approach using cell-penetrating LNP-Trim formulations examined the effectiveness of RNAi-induced host cell receptor ACE2 and TMPRSS2 knockdown in inhibiting SARS-CoV-2 pseudovirus (Figure 1). The LNP-Trap core platform consisted of DOPC lipid with a neutral charge, along with DSPC helper lipid and structural cholesterol and a lipid-PEG component, DSPE-PEG2K-COOH, to stabilize the LNP in aqueous media and to facilitate ligand bioconjugations via the surface carboxylic acid group. In addition, lipophilic fluorescent dye (DiO or DiR) was also incorporated into the LNP-Trap for visualization and tracking in vitro and in vivo. The DOPC/DSPC/cholesterol/DiO/DSPE-PEG-COOH LNPs were prepared following the microfluidic mixing method (Figure 2A). The LNP-Trap base formulation was surface modified with either SARS-CoV-2 spike RBD targeting ACE2 peptide (LNP-Trap1), rhACE2 protein (LNP-Trap2), and mAb (LNP-Trap3) at molar ratios of PEG:ligand 1:0.3 (Figure 2B). The resulting hydrodynamic sizes for LNP-Trap1–3 were 83.54 ± 1.9 nm, 128.8 ± 2.5 nm, and 123.1 ± 3.7 nm, respectively. All the LNP-Trap formulations had a neutral zeta potential and a polydispersity index (PDI) of less than 0.2. The hydrodynamic size, zeta potential, and PDI values of all the as prepared LNP formulations are given in Table S1. The LNP core of LNP-Trap1 and LNP-Trim1 were visualized and imaged using TEM (Figure S1). The actual LNP core diameter from TEM images for LNP-Trap1 and LNP-Trim1 were determined to be 14.2 ± 2.9 nm and 59.3 ± 10.1, respectively. The hydrodynamic diameter of LNP-Trap and LNP-Trim were significantly bigger than the actual LNP core diameter from TEM as the former measures the hydration sphere encompassing surface polyethylene glycol and conjugated ligands.
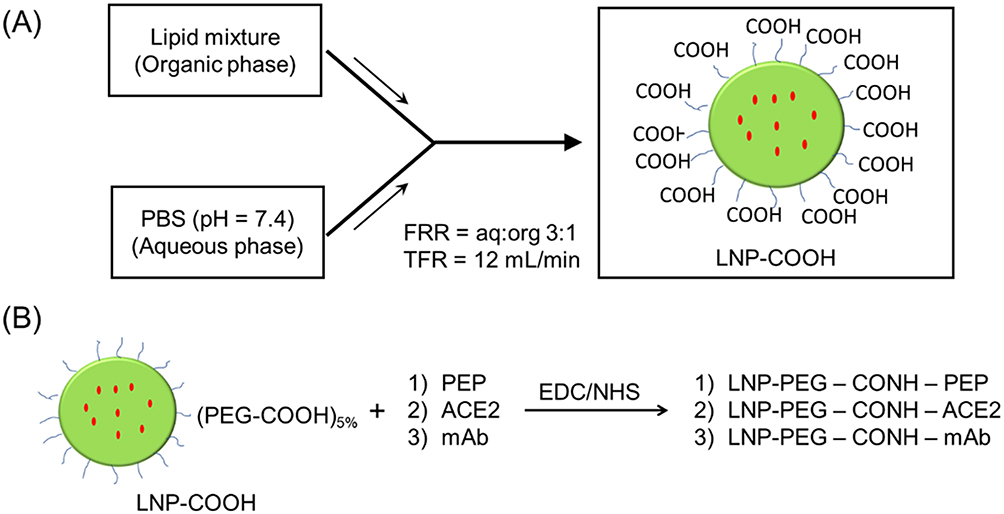 |
Figure 2 Schematic illustration of the preparation of LNP-COOH following microfluidic mixing (A). The lipid mixture DOPC/DSPC/cholesterol/DSPE-PEG-COOH/DiO (46.5/10/38/5/0.5 molar %) in ethanol (organic phase) was micromixed with PBS at the flow rate ratio (FRR) of aq:org 3:1 and a total flow rate (TFR) of 12 mL/min to yield LNP-COOH. The LNP-COOH was tagged using a green fluorescent (DiO) or near-infrared fluorescent (DiR) dye. Post-synthesis surface modifications of the LNP-COOH with various spike RBD binding ligands were performed via EDC/NHS coupling reaction (B). |
The binding of LNP-Trap 1 with 1.5 and 5 molar % of surface PEG conjugated with 0.1 and 0.3 molar equivalent ACE2 peptide to SARS-CoV-2 spike protein was evaluated using enzyme-linked immunosorbent assay (ELISA) (Figure S2). The LNP with 5 molar % PEG and 0.3 molar equivalent ACE2 peptide (10 µg/mL) displayed the highest binding and inhibition (~31%) of SARS-CoV-2 spike protein, and as a result, the 5 molar % PEG-lipid and 0.3 molar equivalent of conjugated ligands were used in further evaluations of the LNP-Trap formulations. The biocompatibility of the LNP-Trap base formulation (ie, without trapping ligands) was evaluated in airway epithelial Calu-3 cells using cell impedance and MTT assays (Figure 3). For the cell impedance studies, the cell index (CI) in control and LNP-Trap treated cells was monitored over 24 hours (Figure 3A). The LNP-Trap, at concentrations as high as 1 mg/mL, displayed comparable baseline normalized CI values to those of the control group receiving only media. As a decrease in cell attachment or proliferation would decrease CI values over time, these studies suggested the LNP-Trap base formulation was biocompatible. Further cytotoxicity studies were performed on the various LNP-Trap formulations using MTT assay (Figure 3B‒F). No change in cell viability was observed with any of the LNP-Trap treated cells, further confirming the safety of the LNP-Trap platform.
 |
Figure 3 Cytotoxicity of LNP-COOH analyzed using (A) cell impedance and (B) MTT assays in Calu-3 cells. Cytotoxicity MTT assays of LNP-PEP (C), LNP-rhACE2 (D), LNP-mAb (E), and LNP-siACE2 (F) in Calu-3 cells. Values are expressed as the mean ± standard error of the mean (n = 3). |
The uptake of LNP-Trap 1 and 2 was evaluated in airway epithelial cells, a key site for SARS-CoV-2 infection. Both LNP formulations showed negligible uptake (<1%) in Calu-3 cells (Figure 4A and B). The low cell uptake observed for the LNP-Trap was likely the result of the 5 molar % PEG-lipid on the LNP surface. PEGylation of therapeutics, including nanoparticles, is widely used for imparting desirable stability, non-immunogenic properties, and long circulation half-life.33 A low cell internalization profile for the LNP-Trap was desired to maximize extracellular localization and effectiveness for neutralizing incoming SARS-CoV-2. The internalization and localization of the fluorescently labeled LNP-Trap1 (Figure 4C‒F) and LNP-Trim1 (Figure 4G‒J) in Calu-3 cells were evaluated using confocal microscopy. Based on the two-dimensional images, LNP-Trap1 did not display cell internalization (Figure 4C–F), whereas LNP-Trim1 (Figure 4G–J) exhibited cellular internalization in Calu-3 cells. An orthogonal projection of the LNP-Trim1 in the z-plane is shown in Figure 4K. From the z-stack, the LNP-Trim1 was mostly localized in the cell cytoplasm.
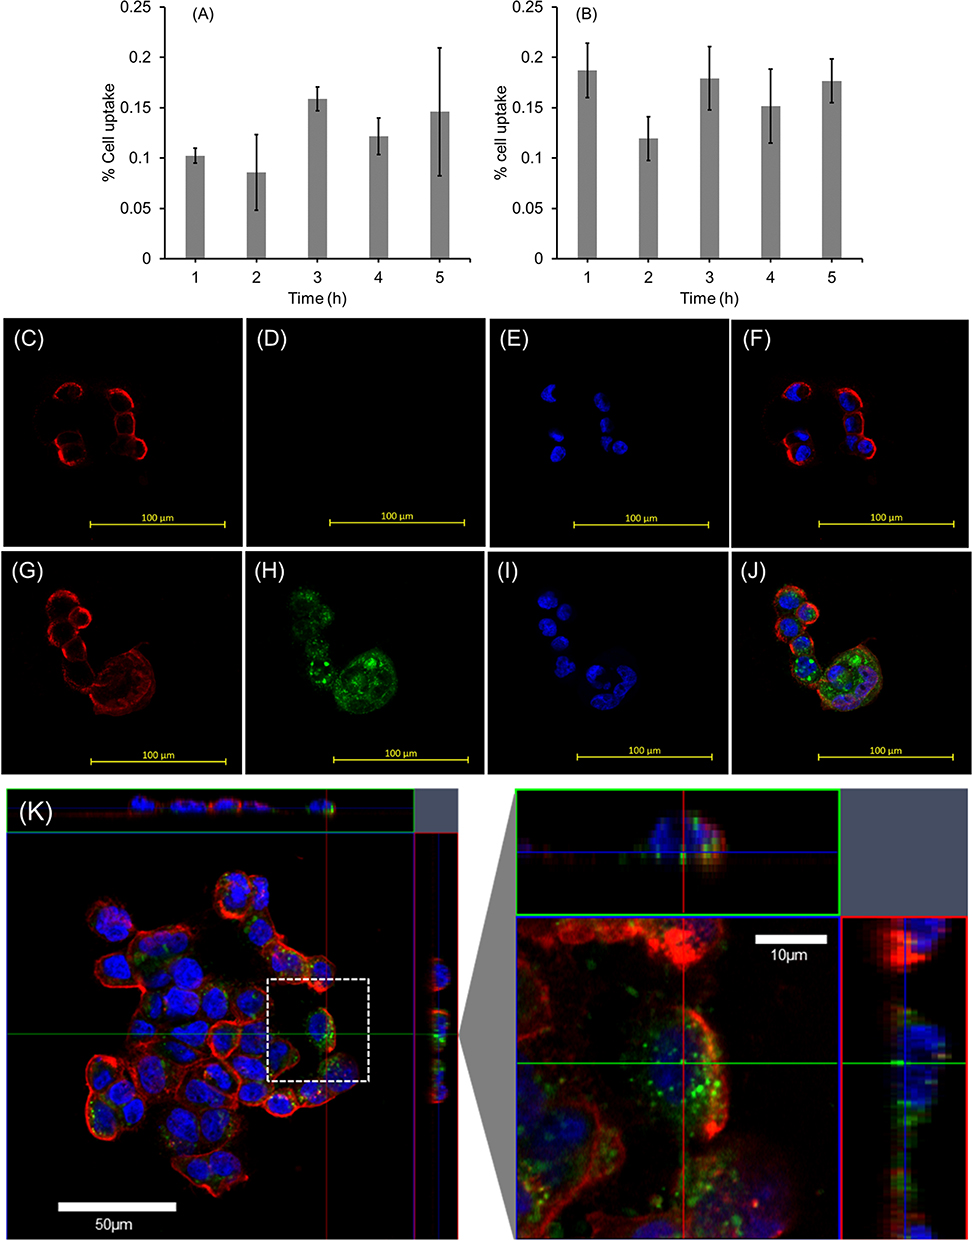 |
Figure 4 Quantitative determination of cellular accumulation of (A) LNP-PEP and (B) LNP-rhACE2 in Calu-3 cells over time. Representative confocal microscopy images from Calu-3 cells treated (3 hours) with cell-impermeable LNP-PEP (C‒F) and cell-permeable LNP- siACE2 (G‒J). Plasma membrane from Calu-3 cells was stained with WGA Alexa FluorTM 594 (C and G); LNP localization in Calu-3 cells was visualized with green fluorescent DiO dye (D and H); and cell nuclei were stained using Hoestch (E and I). Composite overlay of all three images showing cell membrane, nuclei, and LNPs (F and J). Orthogonal projections of Calu-3 cells treated with LNP-siACE2 (K) for 3 hours. Two-dimensional images in z-position where red lines indicate cross-section through y-position and green lines indicate cross-section through x-position. The white dashed box in image K is enlarged. Values are expressed as the mean ± standard error of the mean (n = 3). |
The LNP-Trim (MC3/DSPC/cholesterol/DiO/DMG-PEG) were loaded with siACE2 (LNP-Trim1) or siTMPRSS2 (LNP-Trim2) using the microfluidic mixing method. Both the LNP-Trim formulations resulted in LNPs with a hydrodynamic size of ~90 nm and a neutral zeta potential (Table S1). The transfection and gene knockdown efficiency of the LNP-Trim formulations was evaluated in HEK-293-hACE2 and Calu-3 cells. In HEK-293-hACE2 cells, both LNP-Trim1 and LNP-Trim2 at 40 nM siRNA concentration produced maximum knockdown (≥70%) of the target genes (ACE2 and TMPRSS2) at the mRNA level 72 hours after transfection (Figure 5A and B). In Calu-3 cells transfected with LNP-siACE2 (40 nM siACE2), the cell internalization/localization of LNPs were visualized using fluorescence microscopy (Figure S3). Cell association of LNP-Trim was observed as early as one hour (Figure S3A‒C). At three (Figure S3D‒F) and six (Figure S3G‒I) hours time points, a uniform LNP internalization in punctate form was observed, indicating endosomal localization. A maximum knockdown of ACE2 at the mRNA (~70%) and protein (~50%) levels was observed 72 hours after transfection with LNP-siACE2 (Figures 5C and D and S4).
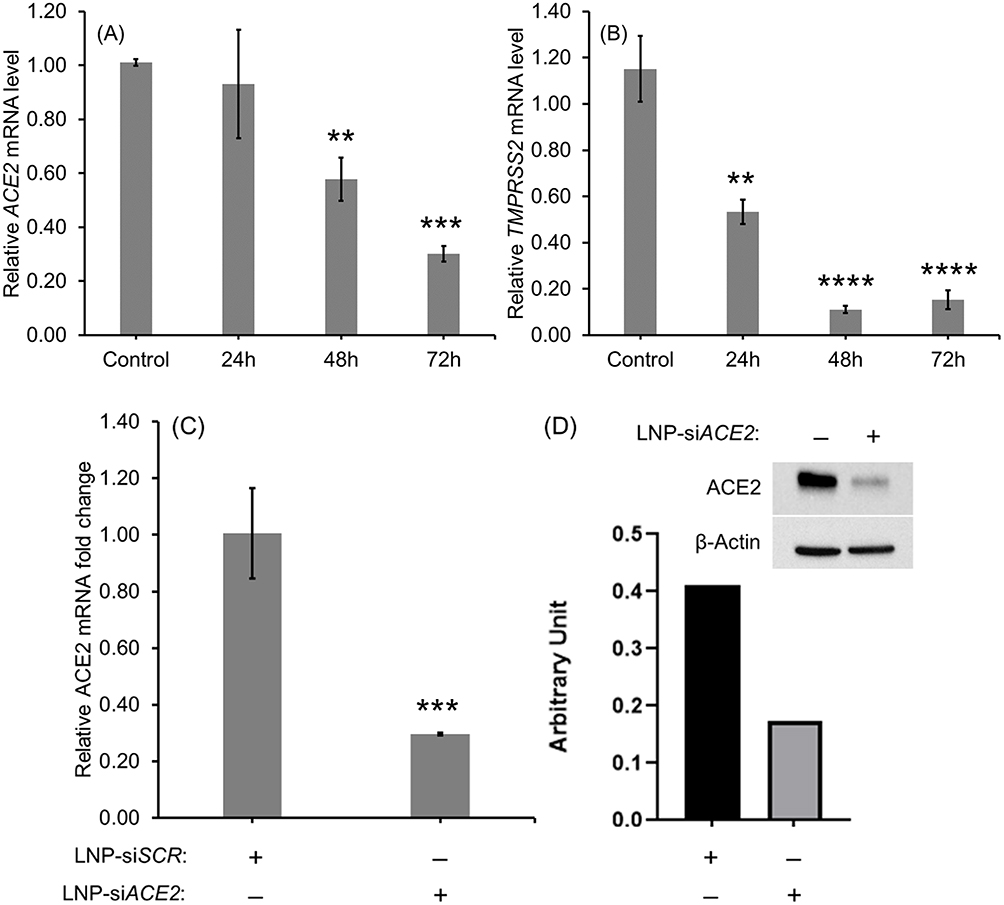 |
Figure 5 Relative ACE2 (A) and TMPRSS2(B) mRNA levels in HEK-293-hACE2 cells at different time points after transfection with LNP-siACE2 (40 nM siACE2) and LNP-siTMPRSS2 (40 nM siTMPRSS2), respectively. The control cells in (A) and (B) received LNP-siSCR. Relative ACE2 mRNA level in Calu-3 cells 72 hours after receiving LNP-siACE2 (40 nM siACE2) against control cells that received LNP-siSCR (C). Relative ACE2 protein level in Calu-3 cells 72 hours after receiving LNP-siACE2 (40 nM siACE2) against control cells that received LNP-siSCR (D). The uncropped blots are shown in Figure S3. Values are expressed as the mean ± standard error of the mean (n = 3). Statistical significance between the control and treatment groups were analyzed using t-test (**p < 0.01, ***p<0.001, ****p<0.0001; p < 0.05 was considered statistically significant). |
The transduction efficiency of the SARS-CoV-2 S pseudotyped luciferase lentivirus over a series of MOI was evaluated in HEK293 parental cells and HEK293-hACE2 (Figure 6A). In the non-transfected HEK-293 control cells, which do not express ACE2, there was no significant luminescence at any MOI examined, indicating a lack of infection in these cells (Figure 6A). In contrast, the HEK-293-hACE2 cells showed a concentration-dependent increase in luminescence following exposure to the SARS-CoV-2 pseudotyped lentivirus (MOI of 1 ‒ 3). These studies confirmed that SARS-CoV-2 pseudotyped lentivirus entry and infection is ACE2 dependent. The infectivity of the SARS-CoV-2 pseudotyped lentivirus was examined following treatment with LNP-siACE2 and LNP-siTMPRSS2 in HEK-293-hACE2 cells (Figure 6B). ACE2 and TMPRSS2 knockdown in HEK-293-hACE2 resulted in over 87% inhibition of infection compared to the control (Figure 6B). Similarly, in airway epithelial Calu-3 cells, knocking down ACE2 and TMPRSS2 resulted in over 90% inhibition of SARS-CoV-2 pseudovirus infection with concentrations of siRNA in the LNPs as low as 20 nM. Significant reductions in pseudovirus infection were observed with even lower concentrations of siRNA (Figure 6C and D). The IC50 values based on nonlinear regression fit for LNP-siACE2 and LNP-siTMPRSS2 were determined to be 21.9 nM and 1.7 nM, respectively. These results confirmed that SARS-CoV-2 pseudotyped lentivirus infected cells through an ACE2 and TMPRSS2-dependent process and that the extent of infection was reduced with LNP-siACE2 (LNP-Trim1) and LNP-siTMPRSS2 (LNP-Trim2) treatments.
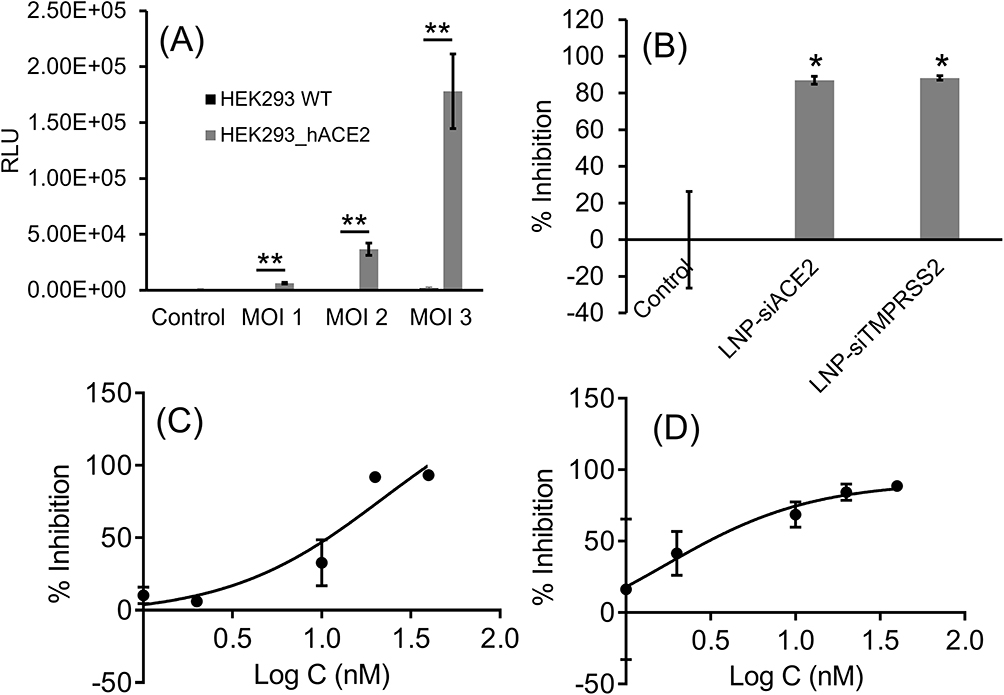 |
Figure 6 Transduction efficiency (luciferase expression) of SARS-CoV-2 S pseudotyped luciferase lentivirus at the given MOIs in HEK-293 and HEK-293-hACE2 cell lines (A). Percentage inhibition of infection in ACE2 KD and TMPRSS2 KD HEK-293-hACE2 cells (B). Percentage inhibition of infection in ACE2 KD (C) and TMPRSS2 KD (D) in airway epithelial Calu-3 cell line at different siRNA concentrations (LNP-siRNA: 1, 2, 10, 20 and 40 nM; presented in the graph as log 10 values). The nonlinear regression curve fit analysis of siRNA concentration vs inhibition is presented in the graphs. Values are expressed as the mean ± standard error of the mean (n =3). Statistical analysis was performed using one-way ANOVA, followed by Tukey’s test (*p < 0.05, **p<0.01; p < 0.05 was considered statistically significant). |
The viral neutralizing property of the LNP-Trap formulations towards SARS-CoV-2 pseudotyped luciferase lentivirus was also evaluated in Calu-3 human airway epithelial cells (Figure 7) and summarized in Table S2. Using free ACE2 peptide, the maximum achievable inhibition observed in the SARS-CoV-2 pseudovirus assay was 60% and occurred at concentrations of 1 µg/mL or above and with an estimated IC50 concentration of 0.1 µg/mL (Figure 7A). While the LNP-Trap1 displayed similar IC50 values, the maximal efficacy at inhibiting pseudovirus infectivity was increased to > 90% compared to the approximately 60% inhibition observed with free peptide (Figure 7A). In the case of rhACE2, the IC50 concentration for pseudovirus inhibition was determined to be 0.17 µg/mL, with over 70% inhibition observed at concentrations > 1 µg/mL (Figure 7B). Compared to rhACE2 (Figure 7B), both efficacy and potency were considerably better with LNP-Trap2. The free mAb displayed an IC50 concentration of 0.2 µg/mL and had over 95% inhibition of infection at 1 µg/mL concentration (Figure 7C). While the LNP-Trap3 (Figure 7C) formulation had a similar > 90% efficacy as free mAb, a significant increase in potency was observed. For each trapping ligand, improvements in overall activity were observed with the LNP-Trap formulations versus the trapping ligands alone (Figure 7; Table S2). In addition, the LNP-Trap, by design, could also enhance its stability and retention time in nasal mucosa as compared to free molecules.
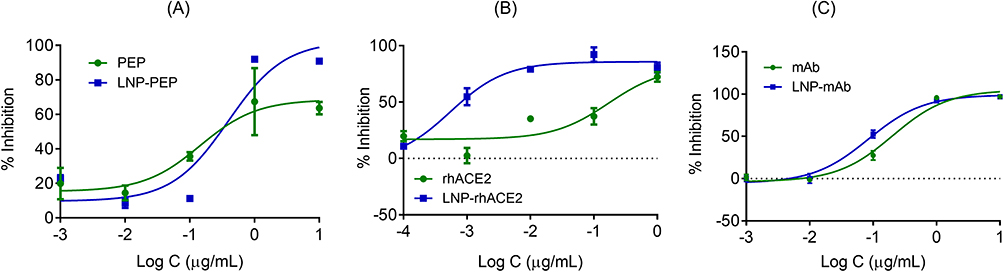 |
Figure 7 Percentage inhibition of SARS-CoV-2 S pseudotyped luciferase lentivirus (MOI = 2) infection in Calu-3 cells in the presence of different concentrations (Log (C) of ACE2 peptide and LNP-PEP (A), rhACE2 and LNP-rhACE2 (B), mAb and LNP-mAb (C). The nonlinear regression curve fit analysis of concentration vs inhibition is presented in the graphs. Values are expressed as the mean ± standard error of the mean (n = 3). |
Additional studies with the SARS-CoV-2 pseudovirus were performed to optimize dosing strategies and identify synergistic combinations of treatment. As shown in Figure 8, a treatment combining LNP-Trap1 and either of the LNP-Trim formulations had improved efficacy over a single treatment. The combination of LNP-Trap1 and LNP-Trim1 produced significantly higher inhibition levels than their individual responses, displaying synergism (CTI < 0.7). Combining these two LNP formulations could be desirable to achieve maximal inhibition of infection with reduced doses of LNPs. Various combinations of LNP-Trap1 (0.1 µg/mL) with other agents (lactoferrin, camostat mesylate, and carrageenan) reported to have SARS-CoV-2 antiviral properties were also evaluated (Figure 9). In the case of lactoferrin and carrageenan, studies suggest these agents interfere with SARS-CoV-2 viral uptake, while camostat mesylate is an inhibitor of viral proteases.34–37 Each of these agents were screened for activity, alone and in combination with LNP-Trap1, in the SARS-CoV-2 pseudovirus assay in Calu-3 cells (Figure 9D). Among the treatment combinations examined, the combination of LNP-Trap1 and carrageenan produced significantly higher levels of inhibition compared to the individual levels (CTI < 0.7).
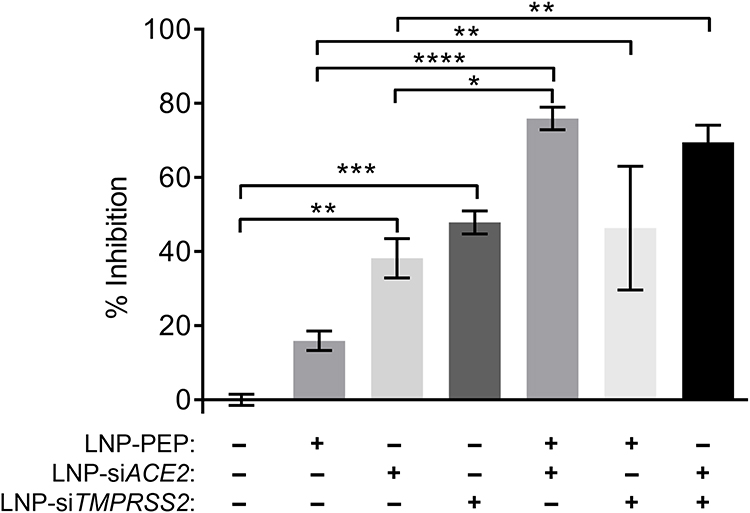 |
Figure 8 Percentage inhibition of SARS-Cov-2 S pseudotyped luciferase lentivirus infection (MOI = 2) in airway epithelial Calu-3 cell line following a combination of conditions including LNP-PEP treatment and ACE2 and TMPRSS2 knockdown. The extent of infection was measured following a luciferase assay. Values are expressed as the mean ± standard error of the mean (n = 3). Statistical analysis was performed using one-way ANOVA, followed by Tukey’s test (*p < 0.05, **p < 0.01, ***p<0.001, ****p<0.0001; p < 0.05 was considered statistically significant). |
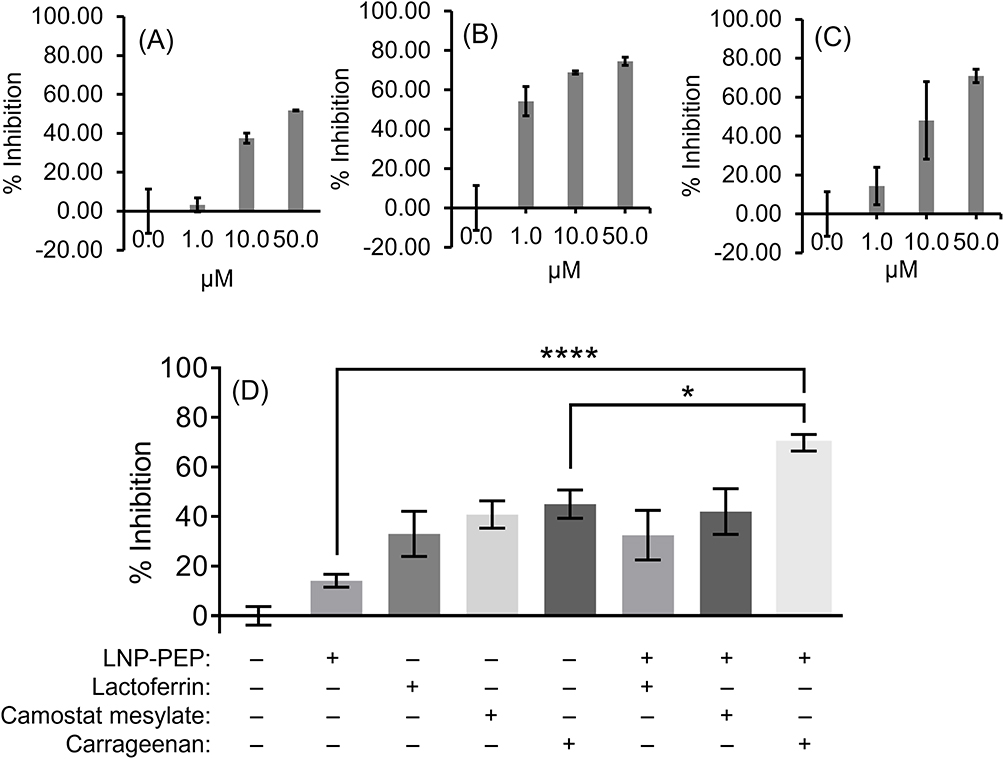 |
Figure 9 Percentage inhibition of SARS-Cov-2 S pseudotyped luciferase LV infection (MOI = 2) in airway epithelial Calu-3 cell line following treatment with different concentrations of lactoferrin (A), camostat mesylate (B), and carrageenan (C). Percentage inhibition of infection in Calu-3 cells with various combinatory treatments of LNP-PEP (0.1 µg/mL), lactoferrin (10 µM), camostat mesylate (1 µM), and carrageenan (1 µM) (D). The extent of infection was measured following a luciferase assay. Values are expressed as the mean ± standard error of the mean (n = 3). Statistical analysis was performed using one-way ANOVA, followed by Tukey’s test (*p < 0.05, ****p<0.0001; p < 0.05 was considered statistically significant). |
As the intended use of the LNP-Trap and LNP-Trim formulations is for local administration via the nose, the retention of representative formulations of each was examined in the nasal cavity following intranasal administration (Figure 10). The localization of LNPs was fluorescently tracked over different time points, as shown in Figure 10A and B. From the fluorescent images obtained, both the LNP-Trap1 (LNP-PEP) and LNP-Trim1 (LNP-siACE2) were retained in the nasal cavity for up to 3 hours. In the case of LNP-Trap1, fluorescent signals representing about 25% of the administered dose were present even after 24 hours. The quantitative analysis of the fluorescent signals with ROI encircling the head region showed a gradual drop in signal for LNP-Trap1 over three hours (Figure 10C). The region encircling the body showed an increase in fluorescence after one hour. Ex vivo imaging of the organs after 24 hours showed higher localization of LNP-Trap1 in the lungs and liver (Figure S5A and B). In the case of LNP-Trim1, the fluorescent signal in the nasal area remained stable over three hours, indicating the retention of the LNPs in the mucosa or the airway epithelial cells. An increase in whole-body fluorescence intensity was observed after 30 minutes. Ex vivo imaging of organs for LNP-Trim1 showed a higher localization in the intestine and liver, suggesting some of the nasally administered LNP-Trim was removed through gastrointestinal and liver routes (Figure S5C and D). The biodistribution studies indicated that the LNP-Trap and LNP-Trim formulations have sufficient residence time in the nasal cavity. Furthermore, the accumulation of the LNPs outside the nasal and upper airway was limited to the gastrointestinal tract (LNP-Trim), lung (LNP-Trap), and liver (LNP-Trap and LNP-Trim).
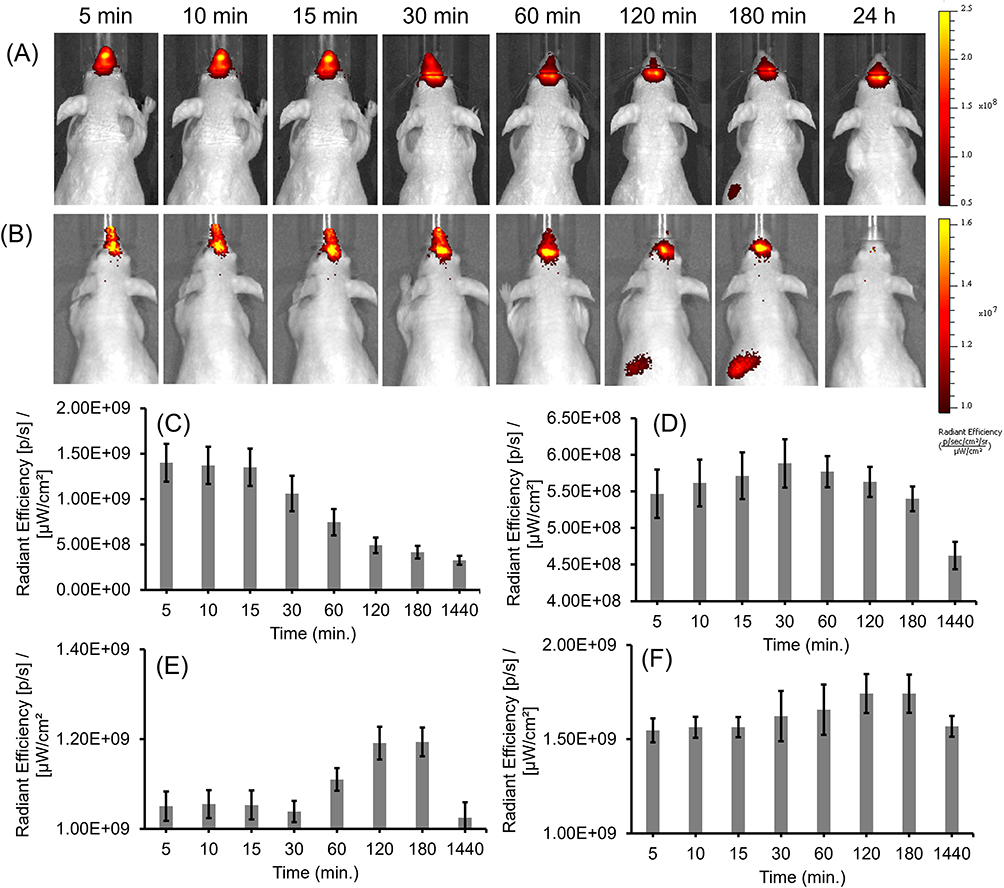 |
Figure 10 Distribution of LNP-PEP (A) and LNP-siACE2 (B) at different time points up to 24 hours after intranasal administration in nude mice. The LNPs were tagged with IR dye (DiR) to aid visualization. The NIR fluorescence images (Ex/Em 745/800) were acquired and analyzed using IVIS imager. The quantitative analysis of fluorescent LNP-PEP in the head (C) and body (D) regions at different time points. The quantitative analysis of fluorescent LNP-siACE2 in the head (E) and body (F) regions at different time points. Values are expressed as the mean ± standard error of the mean (n = 4). |
Discussion
Lipid nanoparticles have an important place in the development of safe and effective vaccines against the SARS-CoV-2 virus. In this study, we have demonstrated additional applications of LNP as a platform for potential treatments targeting the binding and uptake of the virus in host airway cells. Two different and complementary approaches were taken using cell impermeable LNP-Trap to bind and neutralize SARS-CoV-2 viral particles and cell-permeable LNP-Trim to deliver siRNA to knockdown host receptor targets of viral infection. Both LNP-Trap and LNP-Trim formulations were shown to be safe and effective, either alone or in combination with other agents, at inhibiting SARS-CoV-2 pseudotyped lentivirus infection in airway epithelial cells. Local administration in the nasal cavity in mice showed good retention of both LNP-Trap and LNP-Trim formulations.
The LNP-Trap and the LNP-Trim formulations were prepared following the microfluidic mixing method as described previously,32 in which the hydrophobic components (lipids) in the organic phase and hydrophilic components in the aqueous phase were perfused through and mixed in micron-sized channels. The microfluidic method offers precise control over the aqueous and organic channel flow rate ratio (FRR) and the total flow rate (TFR mL/min.). Manipulation of FRR and TFR, along with the lipid composition and concentrations, allows fine-tuning of the nanoparticle size and size distribution.38 In general, a fast rate of mixing of the organic and the aqueous phase causes a rapid change in polarity and burst nucleation of LNP, resulting in smaller sizes, while lowering the total lipid concentration results in smaller LNP sizes. For the present study, microfluidic parameters and the lipid component concentrations were optimized to yield LNPs that had a narrow size distribution as determined by the low polydispersity index values of 0.2 or lower. Microfluidic techniques offer scalability and reproducibility, allowing the production of lipid nanoparticles in large quantities with consistent quality.
LNPs have been used to encapsulate and deliver a wide range of therapeutics, including small molecules, siRNA, mRNA, etc.39–41 The various lipid components used in the present study included functional lipids (eg, Cationic, ionizing lipids such as DODAP, DODMA, and DLin-MC3-DMA) to promote the active loading of drug molecules of interest. In addition, helper lipids such as cholesterol, DSPC, DOPC, etc., were included for structural rigidity and PEG-lipids (DSPE-PEG-COOH, DMG-PEG) for surface modification, targeting ligand attachment and stabilization. The ratio of the lipid components determines the physicochemical and functional properties and the overall stability of the resulting LNPs. In this study, the LNP-Trap formulation did not encapsulate therapeutics, so the functional lipid component was excluded from the composition. The LNP-COOH composition included two phosphatidylcholines (PC) ‒ DOPC (46.5 molar %) and DSPC (10 molar %), cholesterol (38 molar %), DSPE-PEG-COOH (5 molar %) and lipophilic dye (0.5 molar %). These PC lipid molecules with hydrophilic phosphate heads and hydrophobic acyl tail groups may have cylindrical or conical shapes. The molecular shape determines their self-assembly and the resulting phase. The DOPC molecule is cylindrical and is known to spontaneously self-assemble to form a stable lamellar phase (bilayer structures). The phase studies of DOPC, DSPC, and cholesterol mixture have been a topic of interest concerning its abundance in cell membranes.42 Based on the ternary phase diagram reported for DOPC/DSPC/cholesterol, the prepared LNP-COOH should have a fluidic liquid-ordered (Lo) phase.42 Hence, the DOPC/DSPC/cholesterol core should offer structural rigidity and stability to LNP-Trap over its retention time at the target site.
For the LNP-Trim formulations, an ionizing cationic MC3 lipid was used as the functional lipid component to promote siRNA loading in the LNP. For siRNA-based cell delivery, ionizing cationic lipids with an acid dissociation constant (PKa) value below 7 are ideal.43 In the case of MC3, with a PKa value of 6.4, it has a positive charge under acidic (pH < 4) conditions, which can be advantageous during LNP assembly as the electrostatic attraction of the negatively charged siRNA enables high encapsulation efficiency. In this study, the LNP-siRNA LNP-Trim formulations had an encapsulation efficiency of >95%. Under physiological pH, during exposure to the cells, the MC3 carries a neutral charge and, following uptake into the acidic endosome, is once again charged, enabling the endosomal escape and delivery of siRNA into the cell cytosol, where they can interfere with target protein production. The shorter acyl chain in the DMG-PEG allows for more rapid disassociation from the surface of the LNP, promoting enhanced uptake and knockdown efficiency. Hence, the combination of MC3 and DMG-PEG has been widely used to deliver siRNA and mRNA in vitro and in vivo successfully.40,44
In the present study, the LNP-Trim formulation was shown to be very effective in knocking down ACE2 and TMPRSS2 in airway epithelial cells, with concentrations of siRNA of 20‒40 nM incorporated into the LNPs capable of knocking down host cell receptor mRNA expression by ~70% (Figure 5). Knocking down ACE2 and TMPRSS2 using the LNP-Trims 1 and 2 effectively inhibited pseudovirus infection in airway epithelial cells, most likely by inhibiting ACE2/TMPRSS2-dependent cell entry. Hence, LNP-Trim 1 and 2 alone or in combination are safe options for inhibiting infection. In our preliminary in vivo studies, intranasal administration of the LNP-Trim1 was retained for up to 3 hours in the nasal cavity of the mice. While the effectiveness of the LNP-Trim formulations in vivo remains to be determined, based on our in vitro knockdown studies and published literature on MC3 LNP-siRNA exhibiting gene knockdown in vivo, we predict that the LNP-Trim should be effective in knocking down ACE2 in the nasal cavity.45 Furthermore, as no accumulation of the LNP-Trim formulation was observed in the lungs or kidney, the potential toxicity resulting from reductions in ACE2 in the lung and kidney should be minimized.28 However, this will be confirmed in further studies.
In the preparation of LNP-Trap precursor, DSPE-PEG-COOH was included in the lipid mix to form LNP-COOH with surface carboxylic acid groups for further bioconjugation reactions. For the initial screening of LNP-Trap, two precursors (LNP-COOH), with 1.5 molar % and 5 molar % PEG-lipid (DSPE-PEG-COOH), were prepared and conjugated to ACE2 peptide. The LNP-COOH with 5 molar % PEG-lipid was smaller (~ 60 nm) than the LNP-COOH with 1.5 molar % PEG-lipid (~80 nm). The size difference was consistent with earlier reports where a higher percentage of PEG-lipid was shown to form smaller LNP sizes.38 Smaller sizes can be advantageous in terms of room available to build upon with bulky targeting ligands. The ability of LNP-COOH(1.5 molar %) and LNP-COOH(5 molar %) conjugated to ACE2 peptide to bind to SARS-CoV-2 spike protein was evaluated using ELISA. From ELISA, it was observed that only the LNP-COOH(5 molar %) conjugated to ACE2 peptide displayed a positive result for binding/inhibiting spike protein. The effectiveness of LNP-COOH(5 molar %)-PEP could be attributed to the denser PEG-lipid capping offering enhanced stabilization of the LNP and accessibility of the ligand for target binding.46 However, a density of lipid-PEG greater than 10% can adversely affect the nanoparticle targeting efficiency.46 All the LNP-Trap formulations, including LNP-PEP, LNP-rhACE2, and LNP-mAb, were shown to bind and inhibit pseudotyped SARS-CoV-2 infection in airway epithelial cells. Another important feature of these LNPs is the reduced host-cell association demonstrated by the negligible cell uptake in Calu-3 cells using both cell imaging and quantitative fluorescence analysis. In contrast to the LNP-Trim formulation, which displayed uptake into host cells both in vitro and in vivo, there was little evidence of cellular accumulation of the LNP-Trap formulations. Further imaging studies of LNP-PEP in mice post intranasal administration showed localization of LNP-PEP in the nasal cavity for up to 3 hours.
There is growing interest in developing nanomaterials that can bind to and inhibit viral infection of host cells. In a recent report, Papp et al used a gold nanoparticle platform surface modified with sialic acid-coated glycerol dendrons to bind and inhibit the host cell uptake of influenza virus.47 The influenza virus binds to sialic acid residue in the host cell via viral surface hemagglutinin (HA). In-vitro studies showed that AuNPs-HA inhibited infection by 40% compared to control. Similarly, AuNPs modified with ligands for targeting a variety of viruses ranging from influenza, herpes simplex virus type 1, HIV, etc., have been reported.48–50
Several studies have used ACE2-containing exosomes for trapping and inhibiting SARS-CoV-2. The exosomes were isolated from the plasma of COVID-19 patients or cell culture media.51 Others have focused on cloaking nanoparticles with host-cell receptor-expressing exosomes or cell membranes.26,52 Another alternative is synthetic nano virus traps from the nano core to surface ligands. Some of the advantages of synthetic nano virus traps include precise control over the formulation and scale-up processes and the choice of materials that are tried and tested for clinical applications. In a recent report, the gold nanoparticle platform surface modified with sialic acid-coated glycerol dendrons was shown to bind and inhibit the influenza virus.47 The influenza virus binds to sialic acid residue in the host cell via viral surface hemagglutinin (HA). In in vitro studies, AuNPs-HA inhibited infection by 40% compared to control. In another study, AuNPs were conjugated to truncated ACE2 peptide, and its binding to the SARS-CoV-2 spike receptor binding domain was assessed based on size growth observed in dynamic light scattering.53 The engineered nanoparticles with virus-trapping ligand molecules are nascent, and extensive studies are needed to realize their full potential. Among the various virus-trapping platforms, the LNP-based LNP-Trap presented here is a versatile and safe option that displayed high efficacy in trapping and inhibiting (>90%) pseudovirus infection in airway epithelial cells. It was also observed that conjugating ligands to the LNP-Trap platform, especially in the case of ACE2 peptide, improved inhibition of infection compared to free peptide. In the case of free peptide, the inhibition of infection plateaued at around 60% at concentrations above 1 µg/mL (Figure 7).
SARS-CoV-2 is primarily transmitted by inhaling virus-containing aerosols expelled by infected people. After entering the nasal cavity, the viral particles come in contact with the nasal mucosa lining the airway epithelium. The nasal and bronchial epithelial cells are known to express both ACE2 and TMPRSS2 required for SARS-CoV-2 cell entry and infection.54,55 The nasal cavity is estimated to have a surface area of 160 cm2 in adult humans, which is substantial space for lodging airborne viruses.56 Moreover, it is unclear if vaccinated people have immune protection in the nasal mucosa.57 Hence, nanoparticle virus traps localized in the nasal cavity could be an effective first line of defense in binding and neutralizing incoming viruses.
The intranasal delivery route has been successfully used for drug delivery. However, nanotherapeutics intended for the nasal cavity have to overcome the mucous barrier. The mucous lining of the airway epithelial cells presents a semi-permeable barrier to inhaled therapeutics, which may undergo rapid clearance by the motile cilia. Hence, nanotherapeutics should be designed to overcome these barriers to produce a therapeutic effect. For example, nanotherapeutics to deliver siRNA/mRNA that is intended to enter the airway epithelium must cross the mucous barrier. On the other hand, LNP-Trap for viruses should exhibit mucoadhesion and reasonable retention time.
Having a PEG chain on the nanoparticle surface can promote mucoadhesion properties.58 Polyacrylic hydrogels and PLGA nanoparticles attached to PEG showed mucoadhesion in ex vivo and in vivo studies.59,60 In recent reports, LNP-siRNA with a similar lipid-PEG composition as in LNP-siACE2 and LNP-siTMPRSS2 LNP-Trim was shown to deliver their siRNA payload inside the nasal cavity of mice. LNP encapsulated with luciferase mRNA and a mixture of luciferase mRNA and siRNA was shown to express luciferase in the nasal cavity and lungs four hours after intranasal administration in mice.45 Thus, we believe that the LNP-Trim should be able to penetrate the mucin layer and knock down the target gene in the nasal cavity. In the mice that were intranasally administered with LNP-siACE2, a significant drop in fluorescence intensity was not observed after three hours. This might indicate the accumulation of LNP-siACE2 inside the airway epithelial cells, thereby escaping mucous clearing. In the case of LNP-PEP, most of the nanoparticles appear to have cleared the nasal cavity at three hours. This could be attributed to the majority of nanoparticles being localized in the mucous layer and undergoing gradual clearing from the mucosa.
The versatile LNP-Trap and LNP-Trim were shown to be effective in inhibiting infection. Moreover, both LNP-Trap and LNP-Trims can be combined in combination therapy to achieve lower dosages and improved virus inhibition activity. The combination of LNP-Trap1 (0.1 ug/mL ACE2 PEP) and LNP-Trim1 (10 nM siACE2) displayed 80% inhibition of infection at lower concentrations that showed no inhibition. We also explored the possibility of achieving favorable combination effects with other commercially available antiviral agents such as lactoferrin, camostat mesylate, and carrageenan. The combination of LNP-Trap with carrageenan displayed a synergistic effect in inhibiting pseudovirus infection. Hence, both these platforms could be safe options for potential combination therapy for topical nasal cavity administration.
Conclusion
In conclusion, this study highlights a promising therapeutic strategy against SARS-CoV-2 using a two-pronged antiviral LNP treatment platform. This approach utilizes a cell-impermeable LNP-Trap formulation that binds spike protein and neutralizes SARS-CoV-2 pseudovirus and a cell-permeable LNP-Trim formulation to deliver siRNA that results in a knockdown of host receptor targets of viral infection. The LNP-Trap and LNP-Trim formulations were highly effective at inhibiting SARS-CoV-2 pseudovirus infectivity in vitro and showed synergy when combined together or with other treatments. Furthermore, the LNP formulations were retained within the nasal cavity in mice following intranasal administration, indicating their potential for local administration. Together, these findings provide critical proof-of-principle for this LNP-based treatment strategy directed at preventing or reducing SARS-CoV-2 infection within the epithelial cells of the nose and upper airway. As the nose is the primary route of entry and a long-term replication site for the virus,29 reducing viral infectivity at this site could have substantial benefits for reducing the severity of infections. The approach described should also be readily adaptable for other airborne viral pathogens.
Acknowledgments
Funding for these studies was provided by Research Manitoba – COVID-19 Proof-of-concept grant and utR Biotech. NS and MT were supported by MITACS COVID-19 Accelerate studentship. The authors thank Dr. Wai Hei Tse from the Children’s Hospital Research Institute of Manitoba Microscopy Platform for assistance with confocal microscopy.
Disclosure
VY has a patent Covid-19 Trap Technology pending to University of Manitoba. VD has a patent Covid-19 Trap Technology pending to University of Manitoba. DM has a patent Covid-19 trap technology platform pending to University of Manitoba. The authors report no other conflicts of interest in this work.
References
1. Available from: https://covid19.who.int/.
2. Pustake M, Tambolkar I, Giri P, Gandhi C. SARS, MERS and CoVID-19: an overview and comparison of clinical, laboratory and radiological features. J Family Med Prim Care. 2022;11:10–17. doi:10.4103/jfmpc.jfmpc_839_21
3. Ren SY, Wang WB, Gao RD, Zhou AM. Omicron variant (B.1.1.529) of SARS-CoV-2: mutation, infectivity, transmission, and vaccine resistance. World J Clin Cases. 2022;10:1–11. doi:10.12998/wjcc.v10.i1.1
4. Giovane RA, Rezai S, Cleland E, Henderson CE. Current pharmacological modalities for management of novel coronavirus disease 2019 (COVID-19) and the rationale for their utilization: a review. Rev Med Virol. 2020;30:e2136. doi:10.1002/rmv.2136
5. Hoffmann M, Kleine-Weber H, Schroeder S, et al. SARS-CoV-2 cell entry depends on ACE2 and TMPRSS2 and is blocked by a clinically proven protease inhibitor. Cell. 2020;181(2):271–280.e8. doi:10.1016/j.cell.2020.02.052
6. Arias M, Oliveros H, Lechtig S, Bustos RH. Biologics in COVID-19 so far: systematic review. Pharmaceuticals. 2022;15:783. doi:10.3390/ph15070783
7. Niknam Z, Jafari A, Golchin A, et al. Potential therapeutic options for COVID-19: an update on current evidence. Eur J Med Res. 2022;27:6. doi:10.1186/s40001-021-00626-3
8. Panahi Y, Gorabi AM, Talaei S, et al. An overview on the treatments and prevention against COVID-19. Virol J. 2023;20:23. doi:10.1186/s12985-023-01973-9
9. Sullivan DJ, Gebo KA, Shoham S, et al. Early outpatient treatment for Covid-19 with convalescent plasma. N Engl J Med. 2022;386:1700–1711. doi:10.1056/NEJMoa2119657
10. Gottlieb RL, Nirula A, Chen P, et al. Effect of bamlanivimab as monotherapy or in combination with etesevimab on viral load in patients with mild to moderate COVID-19: a randomized clinical trial. JAMA. 2021;325(7):632–644. doi:10.1001/jama.2021.0202
11. Yang H, Rao Z. Structural biology of SARS-CoV-2 and implications for therapeutic development. Nat Rev Microbiol. 2021;19:685–700. doi:10.1038/s41579-021-00630-8
12. V’kovski P, Kratzel A, Steiner S, Stalder H, Thiel V. Coronavirus biology and replication: implications for SARS-CoV-2. Nat Rev Microbiol. 2021;19:155–170. doi:10.1038/s41579-020-00468-6
13. Polack FP, Thomas SJ, Kitchin N, et al. Safety and efficacy of the BNT162b2 mRNA Covid-19 vaccine. N Engl J Med. 2020;383:2603–2615. doi:10.1056/NEJMoa2034577
14. Walsh SR, Seaman MS. Broadly neutralizing antibodies for HIV-1 prevention. Front Immunol. 2021;12:712122. doi:10.3389/fimmu.2021.712122
15. Politch JA, Cu-Uvin S, Moench TR, et al. Safety, acceptability, and pharmacokinetics of a monoclonal antibody-based vaginal multipurpose prevention film (MB66): a Phase I randomized trial. PLoS Med. 2021;18:e1003495. doi:10.1371/journal.pmed.1003495
16. Sneller MC, Blazkova J, Justement JS, et al. Combination anti-HIV antibodies provide sustained virological suppression. Nature. 2022;606:375–381. doi:10.1038/s41586-022-04797-9
17. Kreuzberger N, Hirsch C, Chai KL, et al. SARS-CoV-2-neutralising monoclonal antibodies for treatment of COVID-19. Cochrane Database Syst Rev. 2021;9(9):Cd013825. doi:10.1002/14651858.CD013825.pub2
18. Nathan R, Shawa I, De La Torre I, et al. A narrative review of the clinical practicalities of bamlanivimab and etesevimab antibody therapies for SARS-CoV-2. Infect Dis Ther. 2021;10:1933–1947. doi:10.1007/s40121-021-00515-6
19. Planas D, Veyer D, Baidaliuk A, et al. Reduced sensitivity of SARS-CoV-2 variant delta to antibody neutralization. Nature. 2021;596(7871):276–280. doi:10.1038/s41586-021-03777-9
20. Chan KK, Tan TJC, Narayanan KK, Procko E. An engineered decoy receptor for SARS-CoV-2 broadly binds protein S sequence variants. Sci Adv. 2021;7:eabf1738. doi:10.1126/sciadv.abf1738
21. Kuba K, Yamaguchi T, Penninger JM. Angiotensin-Converting Enzyme 2 (ACE2) in the pathogenesis of ARDS in COVID-19. Front Immunol. 2021;12:732690. doi:10.3389/fimmu.2021.732690
22. Han DP, Penn-Nicholson A, Cho MW. Identification of critical determinants on ACE2 for SARS-CoV entry and development of a potent entry inhibitor. Virology. 2006;350:15–25. doi:10.1016/j.virol.2006.01.029
23. Schütz D, Ruiz-Blanco YB, Münch J, Kirchhoff F, Sanchez-Garcia E, Müller JA. Peptide and peptide-based inhibitors of SARS-CoV-2 entry. Adv Drug Deliv Rev. 2020;167:47–65. doi:10.1016/j.addr.2020.11.007
24. Haschke M, Schuster M, Poglitsch M, et al. Pharmacokinetics and pharmacodynamics of recombinant human angiotensin-converting enzyme 2 in healthy human subjects. Clin Pharmacokinet. 2013;52:783–792. doi:10.1007/s40262-013-0072-7
25. Higuchi Y, Suzuki T, Arimori T, et al. Engineered ACE2 receptor therapy overcomes mutational escape of SARS-CoV-2. Nat Commun. 2021;12:3802. doi:10.1038/s41467-021-24013-y
26. Wei X, Zhang G, Ran D, et al. T-cell-mimicking nanoparticles can neutralize HIV infectivity. Adv Mater. 2018;30:e1802233. doi:10.1002/adma.201802233
27. Rao L, Xia S, Xu W, et al. Decoy nanoparticles protect against COVID-19 by concurrently adsorbing viruses and inflammatory cytokines. Proc Natl Acad Sci. 2020;117:27141–27147. doi:10.1073/pnas.2014352117
28. Jia H, Yue X, Lazartigues E. ACE2 mouse models: a toolbox for cardiovascular and pulmonary research. Nat Commun. 2020;11:5165. doi:10.1038/s41467-020-18880-0
29. Ahn JH, Kim J, Hong SP, et al. Nasal ciliated cells are primary targets for SARS-CoV-2 replication in the early stage of COVID-19. J Clin Investig. 2021;131:148517. doi:10.1172/JCI148517
30. Scopes RK. Measurement of protein by spectrophotometry at 205 nm. Analy Biochem. 1974;59:277–282. doi:10.1016/0003-2697(74)90034-7
31. J-l J, Gong J, T-j Y, et al. PTD4-apoptin protein and dacarbazine show a synergistic antitumor effect on B16-F1 melanoma in vitro and in vivo. Eur J Pharmacol. 2011;654:17–25. doi:10.1016/j.ejphar.2010.12.004
32. Yathindranath V, Safa N, Sajesh BV, et al. Spermidine/Spermine N1-Acetyltransferase 1 (SAT1)-A potential gene target for selective sensitization of glioblastoma cells using an ionizable lipid nanoparticle to deliver siRNA. Cancers. 2022;14:5179. doi:10.3390/cancers14215179
33. Chen B-M, Cheng T-L, Roffler SR. Polyethylene glycol immunogenicity: theoretical, clinical, and practical aspects of anti-polyethylene glycol antibodies. ACS Nano. 2021;15:14022–14048. doi:10.1021/acsnano.1c05922
34. Valenti P, Antonini G. Lactoferrin: an important host defence against microbial and viral attack. Cellular and molecular life sciences. Cell Mol Life Sci. 2005;62:2576–2587. doi:10.1007/s00018-005-5372-0
35. Wotring JW, Fursmidt R, Ward L, Sexton JZ. Evaluating the in vitro efficacy of bovine lactoferrin products against SARS-CoV-2 variants of concern. J Dairy Sci. 2022;105:2791–2802. doi:10.3168/jds.2021-21247
36. Álvarez-viñas M, Souto S, Flórez-Fernández N, Torres MD, Bandín I, Domínguez H. Antiviral activity of carrageenans and processing implications. Mar Drugs. 2021;19:437. doi:10.3390/md19080437
37. Hoffmann M, Hofmann-Winkler H, Smith JC, et al. Camostat mesylate inhibits SARS-CoV-2 activation by TMPRSS2-related proteases and its metabolite GBPA exerts antiviral activity. EBioMedicine. 2021;65:103255. doi:10.1016/j.ebiom.2021.103255
38. Belliveau NM, Huft J, Lin PJ, et al. Microfluidic synthesis of highly potent limit-size lipid nanoparticles for in vivo delivery of siRNA. Mol Ther Nucleic Acids. 2012;1:e37. doi:10.1038/mtna.2012.28
39. Hou X, Zaks T, Langer R, Dong Y. Lipid nanoparticles for mRNA delivery. Nat Rev Mater. 2021;6:1078–1094. doi:10.1038/s41578-021-00358-0
40. Tam YY, Chen S, Cullis PR. Advances in lipid nanoparticles for siRNA delivery. Pharmaceutics. 2013;5(4):498–507. doi:10.3390/pharmaceutics5030498
41. Bayón-Cordero L, Alkorta I, Arana L. Application of solid lipid nanoparticles to improve the efficiency of anticancer drugs. Nanomaterials. 2019;9(3):474. doi:10.3390/nano9030474
42. Zhao J, Wu J, Heberle FA, et al. Phase studies of model biomembranes: complex behavior of DSPC/DOPC/cholesterol. Biochim Biophys Acta. 2007;1768:2764–2776. doi:10.1016/j.bbamem.2007.07.008
43. Semple SC, Klimuk SK, Harasym TO, et al. Efficient encapsulation of antisense oligonucleotides in lipid vesicles using ionizable aminolipids: formation of novel small multilamellar vesicle structures. Biochim Biophys Acta. 2001;1510:152–166. doi:10.1016/S0005-2736(00)00343-6
44. van der Meel R, Chen S, Zaifman J, et al. Modular lipid nanoparticle platform technology for siRNA and lipophilic prodrug delivery. Small. 2021;17(37):2103025. doi:10.1002/smll.202103025
45. Tam A, Kulkarni J, An K, et al. Lipid nanoparticle formulations for optimal RNA-based topical delivery to murine airways. Eur J Pharm Sci. 2022;176:106234. doi:10.1016/j.ejps.2022.106234
46. Hak S, Helgesen E, Hektoen HH, et al. The effect of nanoparticle polyethylene glycol surface density on ligand-directed tumor targeting studied in vivo by dual modality imaging. ACS Nano. 2012;6:5648–5658. doi:10.1021/nn301630n
47. Papp I, Sieben C, Ludwig K, et al. Inhibition of influenza virus infection by multivalent sialic-acid-functionalized gold nanoparticles. Small. 2010;6(24):2900–2906. doi:10.1002/smll.201001349
48. Martinez-Avila O, Hijazi K, Marradi M, et al. Gold manno-glyconanoparticies: multivalent systems to block HIV-1 gp120 binding to the lectin DC-SIGN. Chem Eur J. 2009;15:9874–9888. doi:10.1002/chem.200900923
49. Baram-Pinto D, Shukla S, Gedanken A, Sarid R. Inhibition of HSV-1 attachment, entry, and cell-to-cell spread by functionalized multivalent gold nanoparticles. Small. 2010;6:1044–1050. doi:10.1002/smll.200902384
50. Bowman MC, Ballard TE, Ackerson CJ, Feldheim DL, Margolis DM, Melander C. Inhibition of HIV fusion with multivalent gold nanoparticles. J Am Chem Soc. 2008;130:6896. doi:10.1021/ja710321g
51. El-Shennawy L, Hoffmann AD, Dashzeveg NK, et al. Circulating ACE2-expressing extracellular vesicles block broad strains of SARS-CoV-2. Nat Commun. 2022;13:405. doi:10.1038/s41467-021-27893-2
52. Chen HW, Fang ZS, Chen YT, et al. Targeting and enrichment of viral pathogen by cell membrane cloaked magnetic nanoparticles for enhanced detection. ACS Appl Mater Interfaces. 2017;9:39953–39961. doi:10.1021/acsami.7b09931
53. Mesias VS, Zhu HN, Tang X, et al. Effective ACE2 peptide-nanoparticle conjugation and its binding with the SARS-Cov-2 RBD quantified by dynamic light scattering. Chem Comm. 2021;57:6979–6982. doi:10.1039/D1CC02267A
54. Sungnak W, Huang N, Bécavin C, et al. SARS-CoV-2 entry factors are highly expressed in nasal epithelial cells together with innate immune genes. Nat Med. 2020;26:681–687. doi:10.1038/s41591-020-0868-6
55. Nikiforuk AM, Kuchinski KS, Twa DDW, et al. The contrasting role of nasopharyngeal angiotensin converting enzyme 2 (ACE2) transcription in SARS-CoV-2 infection: a cross-sectional study of people tested for COVID-19 in British Columbia, Canada. eBioMedicine. 2021;66:103316. doi:10.1016/j.ebiom.2021.103316
56. Gizurarson S. The relevance of nasal physiology to the design of drug absorption studies. Adv Drug Deliv Rev. 1993;11:329–347. doi:10.1016/0169-409X(93)90015-V
57. Cahn D, Amosu M, Maisel K, Duncan GA. Biomaterials for intranasal and inhaled vaccine delivery. Nat Rev Bioeng. 2023;1:83–84. doi:10.1038/s44222-022-00012-6
58. Huang Y, Leobandung W, Foss A, Peppas NA. Molecular aspects of muco- and bioadhesion: tethered structures and site-specific surfaces. J Control Release. 2000;65:63–71. doi:10.1016/S0168-3659(99)00233-3
59. Xu Q, Ensign LM, Boylan NJ, et al. Impact of Surface Polyethylene Glycol (PEG) density on biodegradable nanoparticle transport in mucus ex vivo and distribution in vivo. ACS Nano. 2015;9:9217–9227. doi:10.1021/acsnano.5b03876
60. Serra L, Doménech J, Peppas NA. Design of poly(ethylene glycol)-tethered copolymers as novel mucoadhesive drug delivery systems. Eur J Pharm Biopharm. 2006;63:11–18. doi:10.1016/j.ejpb.2005.10.011
 © 2024 The Author(s). This work is published and licensed by Dove Medical Press Limited. The full terms of this license are available at https://www.dovepress.com/terms.php and incorporate the Creative Commons Attribution - Non Commercial (unported, v3.0) License.
By accessing the work you hereby accept the Terms. Non-commercial uses of the work are permitted without any further permission from Dove Medical Press Limited, provided the work is properly attributed. For permission for commercial use of this work, please see paragraphs 4.2 and 5 of our Terms.
© 2024 The Author(s). This work is published and licensed by Dove Medical Press Limited. The full terms of this license are available at https://www.dovepress.com/terms.php and incorporate the Creative Commons Attribution - Non Commercial (unported, v3.0) License.
By accessing the work you hereby accept the Terms. Non-commercial uses of the work are permitted without any further permission from Dove Medical Press Limited, provided the work is properly attributed. For permission for commercial use of this work, please see paragraphs 4.2 and 5 of our Terms.