")
Back to Journals » Journal of Multidisciplinary Healthcare » Volume 14
Logistics Management Information System Performance of Program Medicines in Public Health Facilities of East Gojjam Zone, Northwest Ethiopia: A Cross-Sectional Study
Authors Bekele A , Anbessa GT
Received 20 October 2020
Accepted for publication 23 December 2020
Published 13 January 2021 Volume 2021:14 Pages 81—89
DOI https://doi.org/10.2147/JMDH.S286981
Checked for plagiarism Yes
Review by Single anonymous peer review
Peer reviewer comments 3
Editor who approved publication: Dr Scott Fraser
Azmeraw Bekele, Gizachew Tilahun Anbessa
Department of Social and Administrative Pharmacy, Institute of Health, Jimma University, Jimma, Ethiopia
Correspondence: Azmeraw Bekele
Department of Social and Administrative Pharmacy, Institute of Health, Jimma University, Jimma, Ethiopia
Email [email protected]
Background: Logistics management information system enables the users to gain the right data, in the right quantity, in the right quality, at the right time, to the right place, and for the right cost. Without a logistics management information system, programs inevitably waste valuable resources.
Methods: A facility-based descriptive cross-sectional study supplemented with a qualitative method was conducted in selected public health facilities of East Gojjam zone from March 21 to April 23, 2018. Twenty health facilities (15 health centers and 5 hospitals) were included in the study, and we selected randomly health facilities in proportion to their size. Data collectors were collected quantitative data through a physical count and document review. Key informants were selected using the purposive sampling technique and one of the researchers conducted an in-depth interview. Semi-structured questionnaires and observational checklists were used to collect relevant data. Quantifiable data entered EpiData software version 3.1 and exported to SPSS version 20 for analysis. The qualitative data were analyzed using a thematic analysis method.
Results: The result showed that the availability and utilization of bin card records and report and requisition reports were 20 (100%). Out of 640 bin card records reviewed, 408 (63.8%) had accurate data ranged from 40 to 100% at hospitals and 20 to 86.6% at health centers. Likewise, 1089 (61.9%) of report and requisition form reports data were accurate ranged from 31 to 100% that 49 (89%) were complete and 51 (92.7%) were timely reported with health facilities reporting rate of 55 (91.7%). Poor facility setup and lack of organizational supports identified as principal bottlenecks of logistics management information system performance.
Conclusion: The data accuracy of bin card records and report and requisition form reports were under an ideal condition while others were promising. The average data accuracy of bin card records of anti-malaria drugs was the highest with the lowest accurate report, and there is a need for improvement in data quality, organizational support, and facility setups.
Keywords: logistics management information system, public health facility, program medicines, East Gojjam zone, Ethiopia
Introduction
A supply chain is dynamic and involves the constant flow of information, product, and funds between different stages; therefore, supply chain management integrates supply and demand management.1 Logistics is part of supply chain management that plans, implements, and controls the efficient, effective forward and reverses flow and storage of goods, services, and related information between the point of origin and the point of consumption to meet customers’ requirements.2
Logistics management aims to achieve the six rights of the right goods, in the right quantities, in the right condition, delivered to the right place at the right time for the right cost.2 Logistics management information system (LMIS) is a system of records and reports whether paper-based or electronic. Therefore, LMIS aims to record and report the right data, in the right quantity, in the right quality, at the right time, to the right place (a place where decisions are made) and for the right cost (should not spend more to collect data than spend on supplies).3,4
Therefore, logistic managers make an informed decision at all levels based on accurate and timely logistics data;5–7 however, supply chain and logistics managers in developing and middle-income countries usually depend on experience, guesswork, and very poor information systems. Once more, logistic activities preferably deployed on paperwork and failed to follow official procedures so that decisions made without access to logistic data.8,9
A study in Tanzania revealed that some vital logistic data like consumption data were rarely available. Most of the facilities did not send their reports to a higher level and others sent out of the scheduled time. Besides, there was a lack of communication and confusion about the operating system.10 Another study conducted in Uganda found that many stock records were not up-to-date and end up with wrong decisions.11
In reality, LMIS allows logisticians to gather the statistics to make knowledgeable choices that will eventually enhance client service though it is difficult to practice. In Nigeria, lack of standard operating procedures, lack of power supply, lack of computer and internet, lack of training, inadequate store, and poor record-keeping were among major constraints of LMIS.12
A study result in the southern part of Ethiopia showed that timeliness of report and requisition form (RRF) report was only 57%, and complete RRF reports were nearly similar at hospitals 63% and health centers 59%.6 Another study result in Ethiopia showed that most health care facilities were problematic in data quality of stock-keeping records and requisition reports.5 In this regard, in Western Amhara, data management of health-related information was found poor.13 Therefore, this study aimed to evaluate logistics management information system performance of program drugs and also explore associated challenges in public health facilities of East Gojjam Zone, Amhara Region, Ethiopia.
Methods
Study Design and Settings
A facility based descriptive cross-sectional study supplemented with a qualitative method was conducted to assess the logistics management information system performance and to explore challenges in public health facilities of East Gojjam zone from March 21 to April 23, 2018. The East Gojam zone is located to the northwest of Ethiopia, which is 299 km away from the capital city, Addis Ababa. It is administratively allocated into 18 districts and has an estimated population of 2,632,632. Currently, the zone has a total of 517 public health facilities (406 health posts, 102 health centers, and 9 hospitals).14
Study Units and Participants
The study included thirty-two drug products managed under four selected programs in twenty public health facilities. Relevant data were retrieved by reviewing bin card records and RRF reports used for managing the program drugs. Seven pharmacy heads and seven store managers were included in the study as the key informant so that they were in charge of the overall activities of the pharmaceutical logistics system to their position of information.
Inclusion and Exclusion Criteria
Public health facilities provided all selected program services and drugs common to these selected health facilities were included together with documents available. However, drugs that had not documents and incomplete documents were excluded from the study. We excluded vaccines as they were administered under a cold chain program and managed differently than other program drugs selected for this study. Health posts were excluded since they did not manage all selected program drugs that can affect the consistency of information. Likewise, we exclude pharmacy staffs that were not present at the time of data collection.
Sample Size Determination
The sample size of health facilities was determined based on the logistics indicators assessment tool that recommends 15% of health facilities15 when constraints are available that we had in the current study such as budget and time constraints. This study included program drugs such as antiretroviral, anti-tuberculosis, anti-malaria, and drugs for family planning/maternal and child health (FP/MCH), which was commonly managed at 32 public health facilities (8 hospitals, 24 health centers). This is because the antiretroviral drugs managed just in 32 public health facilities bunched into their optimal distance to the client. However, 15% of 32≈5 was small. Such a small sample size affects the generalizability of the result and therefore, the actual study included 20 public health facilities. Together with this, we have taken thirty-two drugs, managed by all sampled health facilities, 640 bin card records and 60 RRF reports.
Sampling Procedures
Public health facilities were stratified into hospitals and health centers based on their service levels. Therefore, the numbers of health facilities were determined to the proportion of their size so that 15 health centers and 5 hospitals were included in the study (Figure 1). Store managers and pharmacy heads were purposively included in the study by their position of information. The number of bin card records was comparable to the numbers of drugs selected and the number of RRF reports was determined based on their reporting schedule affirmed by the integrated pharmaceuticals logistics system of Ethiopia16 that hospitals and health centers were forced to send their RRF report bi-monthly to the next higher officials. Based on the logistics indicators assessment tool developed by United States aid for international development/Delivery Project, one year or six months logistic data enables to represent ate service performance.15 Therefore; this study was considered six months RRF reports (three RRFs from every 20 facilities).
 |
Figure 1 Flow diagram showing health facilities and documents selection in East Gojjam zone, March 2018. |
Data Collection Procedure
Data collection instruments were adapted from the logistics system assessment tool17 and logistics indicators assessment tool,15 which were used to collect necessary logistics data. Data collectors were pharmacists and one of the authors have provided training for three hours. Besides, they have provided a written interpretation of logistic variables. The collected data were consist of socio-demographic characteristics of study participants, availability and utilization of LMIS documents (IFRR, bin card, RRF), data quality of bin card records and RRF reports including health facility reporting rate. These data were gathered through a physical count and document review on the day of the facility visit and one of the researchers conducted an in-depth interview.
Regarding the Qualitative Study
Regarding qualitative data, fourteen semi-structured interviews were conducted with key informants such as store managers and pharmacy heads. They have selected by the researchers based on their position of information about the pharmaceutical logistics management information system. The interviews were interactive and conducted by one of the researchers to maintain the consistency of the data by using an interview guide (Supplementary appendix-1), adapted from the logistic system assessment tool.17 Key informants were asked in-depth and probing questions to get further information on the topic of interest, and each interview lasted between 20–25 minutes. The thematic analysis method was used to analyses qualitative data and it did manually; therefore, authors closely examined and familiarized themselves with the data via taking notes of the interview in a witness of the data collector. Afterward, the data were coded manually using an excel sheet. Such coded data were organized to search for themes that were reviewed, defined, and finally, a report was generated.
Quality Assurance
A pilot study was conducted in 5% of public health facilities to check the completeness and to clear confusing contents of the questionnaire. Data collectors were experienced pharmacists and they have provided training for three hours. The data collection process was under close supervision to check the completeness and consistency of data.
Data Processing and Analysis
Computable data were coded, checked for completeness, and then entered into EpiData software |version 3.1| and analyzed using statistical package for social sciences |version 20| software. A descriptive statistical analysis was used to determine frequency count, average, and percentage outputs. Results were presented by using texts and graphs based on the nature of the data. Data analysis for the qualitative study was done manually using a thematic analysis method.
The following indicators were considered for this study, but it was difficult to define an overall LMIS performance as poor, good, and/or excellent.18
I. Accuracy of bin cards was determined as follows,

II. Accuracy of RRF reports was determined as follows,

III. Completeness: Among the six months complete and submitted RRF reports, the number of cells expected to be complete on the RRF (other than cells for services not offered by the facility) was calculated, and the number of cells that are complete were counted. Lastly, the percentage of completeness was calculated. Hence, reports considered complete if all the columns for each selected product listed in the RRF report filled unless the facility does not manage the product.
IV. Timeliness of RRF reports was determined as follows,

*No. of health facilities that should report× Number of RRF reports expected from each facility.
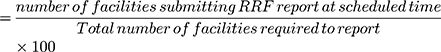
V. Facility Reporting Rate was determined as follows,
Operational Definitions
Program Drug
For this study, the program drug includes anti-tuberculosis/leprosy, anti-malaria, antiretroviral, and drugs for FP/MCH program.
Quality
Performance indicator used to measure LMIS in terms of data accuracy, completeness, and timeliness.
Completeness
A report is complete if all the columns for each selected product listed in the RRF report filled unless the facility does not manage the product.5
Timeliness
If facilities submit their approved RRF report to the next higher officials.16
- Hospitals and health Centre’s should submit RRF to the pharmaceutical supply agency or zonal health department until the 10th day of the month following the reporting period.
- Health centers served through the Woreda health office should submit RRF to the Woreda health office until the 5th day of the month.
Accuracy
In this study, accuracy is as the matching of stock on hand on bin cards with physical count and matching of balance on the bin card with a balance on the RRF report. Ideal if accuracy is equaled to100%.19
Near Accurate
This study report is considered to be near accurate if a ±10% percent discrepancy between the balance on the bin card to the physical count and the RRF report is considered near to accurate.5
Bin Card Update
The bin card is updated if it had to be updated within the previous 30 days; otherwise, last updated with the balance of zero and the facility has not received any of that products.8 If the bin card contains an item that did not have a transaction for more than 30 days considered not updated.
Feedback
This study considered it as the report and any information forwarded by higher official towards lower-level health facility about their performance.
Supervision
In the present study, supervision is about the direction, guidance, and control of the pharmacy unit intending to accomplish their assigned work by higher officials.
Results
The Socio-Demographic Characteristics of Study Participants
Forty pharmacy staff were involved in this study, of which 33 (82.5%) were pharmacists and 7 (15%) were nurses. Of them, 27 (67.5%) were first-degree holders and 13 (32.5%) were diploma qualifiers where 26 (65%) had service experience of 3–5 years and 14 (35%) had >5 years of experience. Among the total staff, 28 (70%) were males and the rest 12 (30%) were females.
Training and Supervision Provided at Health Facilities
The result showed that integrated pharmaceuticals logistics systems training provided to 29 (72.5%) of study participants and among them, 18 (62%) have received on-the-job training, the preferred mode of training, 12 (41.4%) had received pre-service training and the rest 5(17%) have participated in the related workshop. Besides, 15 (75%) health facilities were supervised within six months. Of which, 11 (73.3%) were health centers and 4 (26.6%) were hospitals. Such supervisions were provided bi-monthly 3 (20%), quarterly 5(33.3%), and unscheduled 7(46.7%); however, only 9(45%) of health facilities have received any course of feedback within six months via telephone calls 4(44.4%) and written reports 5(55.5%).
Availability and Utilization of LMIS Tools
The result indicated that bin card records and RRF reports were 20 (100%) available and fully utilized. Likewise, IFRR was available in 20 (100%) health facilities while utilized by 14 (70%) health facilities. Thus, IFRR was 15 (100%) available in at least one major and 12 (80%) in 75% of the health center dispensing units. Electronic records were available only at half 10 (50%) of health facilities and fully available at hospitals but only utilized at 7 (35%) of health facilities.
Data Quality of LMIS Records and Reports
Bin Card Data Accuracy
Out of 640 bin card records, 495 (77.3%) were updated while 408 (63.8%) of recorded data were accurate ranged from 40 to 100% at hospitals and 20–86.6% at health centers. Where anti-retroviral, FP/MCH, anti-tuberculosis, and anti-malaria drug products accounted for 62.1%, 71.9%, 55.6%, and 73.3%, respectively (Figure 2). Whereas 494 (77.2%) of the total bin card records were near accurate to (10%) tolerable rate (Supplementary file Table 1).
 |
Figure 2 Data accuracy of bin card records by-product and facility type in selected public health facilities of East Gojjam zone, March 2018 (Hospitals=5, Health centers=15). Abbreviation: FP/MCH, family planning/maternal and child health. |
RRF Data Accuracy
Threateningly, five (5) of RRF reports were not sent to the pharmaceutical and supply agency and remain left throughout the analysis, so 55 RRF reports were considered for analysis.
Out of the total RRF reports of the total drugs reviewed, 1089 (61.9%) were accurate that ranged from 31 to 100%. As a result, data accuracy of anti-retroviral, anti-malaria, FP/MCH, and anti-tuberculosis drugs accounted for 384 (58.2%), 92 (55.8%), 282 (64.1%), and 331 (66.9%) respectively (Figure 3). 1283 (72.9%) of RRF reports were nearly accurate for a 10% tolerable error (Supplementary file Table 2). RRF data were more accurate at hospitals 293 (70.4%) than health centers 796 (59.2%). The mean value of accurate RRF reports was 54.45 (SD±11. 199) and a half (50%) of accurate RRF reports were under the mean accurate value.
 |
Figure 3 Data accuracy of RRF reports by product and facility type in selected public health facilities of East Gojjam zone, March 2018 (Hospitals=5, Health centers=15). Abbreviation: FP/MC, family planning/maternal, and child health. |
Completeness, Timeliness, and Reporting Rate of RRF Reports
Among the total RRF reports submitted to the pharmaceutical supply agency within six months, 49 (89%) were complete and the facility reporting rate of RRF reports were 55 (91.7%), of which 51 (92.7%) were timely reported (Figure 4).
 |
Figure 4 Completeness and timeliness of RRF reports in selected public health facilities of East Gojjam zone, March 2018 (hospitals n=5, Health centers n=15). |
Qualitative Results
Semi-structured interviews were conducted using in-depth and we explored the following challenges associated with logistics management information system performance. Thus, fourteen key informants took part in the study.
Organizational Support and Related Challenges
In most of the health facilities (n=13), there was a lack of staff cooperation and high staff turnover. These challenges reduced the data consistency of the logistics management information system of the health facilities. For instance, some requisition reports were for administrative regulation and deliberately changed into complete and well-organized reports. One of the store managers tried to explain the situation as follows,
In the last three years of my experience, the store man was also responsible for dispensing drugs. I am in the same state of the high workload with no additional income or an incentive. Updating records during each transaction is right difficult. I recommend creating a friendly working environment.
Some health facilities (n=9) have experienced with lack of skilled professionals and therefore, they had poor utilization of computerized recording systems. For instance, they have used the system mainly for expiry date monitoring activities. A computerized recording and reporting system links health facilities with the central store to collect and distribute logistics data in real-time, but this was not the case in nine of these study health facilities. One of the store managers tried to explain the condition as follows,
As a responsible pharmacist, I remind a bold dispute continued for the last two years that only one computer technician has allotted for many health facilities so that the system is not used for daily activities. Some drugs were recorded into the computer system while others were paper registered, so we have poor documenting practices.
Findings from health facilities (n=5) showed that there was a lack of supportive supervision and higher-level officials were reluctant to give a quick response for emergent issues. Pharmaceuticals supply agencies refused to supply full quantity demand to the health facilities. Besides, they push health facilities to do what they have ordered them. In essence, healthcare-related activities need close monitoring and ongoing capacity building but this was not the case in five of these study health facilities. One of a pharmacy heads stated as follows,
I saw communication gaps between different levels of health care facilities in the past three years of my experience and it is a burning issue. There is a low commitment to higher officials’ to give quick feedback. Our staff members are repelling using internal facility requisition and reporting forms. This is common to all dispensing units as close monitoring is less justifiable.
Infrastructure-Related Challenges
Some health facilities (n=7) have experienced a lack of mechanical instruments and poor working environments which were prominent at health centers. The commonest problems were frequent interruption of electric power that affects the qualities of pharmaceutical logistics services. One of the store managers forwarded the condition as follows,
Over the past four years, the main problem encountered in providing pharmaceutical logistics management service was the interruption of electric power supply. Currently, good storage management practice is difficult because of the said problem and limited capacity stores. As a pharmacist, I recommended having an immediate solution since these issues are encompassing to a poor inventory control practice.
In half of the health facilities (n=10), there were poor facility setups that limited service transitions and slowed down the flexibility of drug management information system activities. This resulted from the poor administrative allotment. One pharmacy head stated this as follows,
In my three years of experience, this facility had some issues and the current challenges consist of the shortage of vehicles and poor facility infrastructure including dispensing units which disturbs service integrity and need for the additional service cost.
Discussions
This study was conducted to evaluate program drug logistics management information system performance in health facilities, which ensures the availability of drug products. The significance of having drug treatments at a health facility cannot overstate. This relies upon how the logistics management information system is performing.20 Thus, the current study revealed that LMIS recording and reporting tools such as bin card records, and RRF reports were available and utilized at all, 20 (100%) health facilities but IFFR was fully available and utilized at 14 (70%) health facilities. The result, 20 (100%) found in the present study is higher than a study conducted in Ethiopia at which the availability and utilization of bin cards and RRF reports were beyond 90% at hospitals and 80% at health centers.5 This is might be for the lower sample size in the present study than the previous national survey. The higher sample size could represent low-performing facilities that lower the overall performance and most of the bin card records within the present study result found up to date with accurate information.
Logistic records should always be available when and where needed;16 however, shortages were identified by the current study which is common in developing countries. For instance, a study done on the contraceptive logistics management system, in Nigeria identified gaps in the availability of all the forms at health facilities.21 Poor utilization of LMIS tools does not represent the absence of drug product loss, expiration, movement, and others. It can be a cause for corruption and miss informed decisions that encourage unavailability of a drug product and loss of trust in public health care service.
The available data on bin card records and RRF reports should be able to generate reliable information. The usefulness of information mainly depends on the accuracy of the data contained within it, which is the weakest link in developing countries.4
Therefore, in the current study, only 408 (63.8%) bin card had accurately recorded data and similarly, the accuracy of data transferred from the bin card into the RRF report was 1089 (61.9%) but half of the accurate RRF reports were below the mean value (54.45) and under ideal conditions. This showed that some program drugs were lost, wasted or out of the right service due to different unfortunate reasons. These, the current study, accurate data of RRF reports, 408 (63.8%) and accurate data of bin card records, 408 (63.8%) are higher than a study done in Addis Ababa in 32 health facilities,22 at which 32% of bin card records and 40% of RRF reports were accurate. Again, in the present study, the accuracy of RRF reports is lower than a study results in Nigeria21 that 70.8% of store reports were accurate. Such differences might be due to the difference in the number of study facilities included in each study so that the previous study in Nigeria was a national survey and the other had more sample size than the current study and in Nigeria, all store managers trained to complete the store report. Discrepancies of over 10% should cause concern and may require efforts to improve data quality5 since any inaccuracy infiltrates the entire information system(s), which affects every aspect of information use, and overall logistics performance.
Complete and timely data is indispensable to make the right decision but there are potential gaps and low performances.23 In the current study, the completeness of RRF reports was 49 (89%), of which hospitals reports were 100% complete but 85.7% at health centers. These figures are higher than reported from 30 health facilities in the southern part of Ethiopia that 63% of hospital reports and 59% of health center reports were complete.6 Such difference possibly for the lower sample size in the current study that the previous study may consist of low-performing facilities that lower the overall performance.
Timeliness, in the current study, of RRF reports was 51 (92.7%) which is lower than a study finding in Bangladesh that 99% of reports were timely24 but it is higher than the other study result in the southern part of Ethiopia that timeliness of RRF report was 57%.6 These differences might be for differences in organizational support and health facility setups identified as the principal challenges in the present study. Comprehensive electronic LMIS improved the quality, timeliness, and completeness of data by reducing supervision visits by 70%.24 In the present study, half of the health facilities had an electronic recording system, and only utilized at 7 (35%) health facilities to monitor the expiry date of products, and none of them had an electronic reporting system. Likewise, the in-depth interview explored that electronic LMIS was not properly utilized following poor organizational support, which could lower data quality. This study, therefore, helps the audience such as facility heads, non-governmental organizations, and product service managers to make informed decisions as if to take policy measures regarding logistic management information system services. Whereas poor data arrangement in selected public health facilities was the challenge and therefore, efforts were made to retain the generalizability of findings.
Conclusions
This study reveals that data accuracy of logistics management information system records and reports is not acceptable, nearly similar both at hospitals and at health centers, which is expected to be a hundred percent. Whereas timeliness, completeness, and facility reporting rate was encouraging, but there is room for improvement. Lack of organizational support and poor health facility infrastructure were identified as major contests, and need attention to improve health facilities setups and encourage organizational support.
Abbreviations
FP, family planning; IFRR, internal facility report, and requisition; LMIS, logistics management information system; MCH, maternal, and child health; RRF, report and requisition form.
Data Sharing Statement
The data sets generated during the current study will be available upon reasonable request.
Ethics Approval and Consent to Participate
Ethical approval was received from the institutional review board of Jimma University (Ref. IHRPG/238/2018), and then the authors communicated with administrative staffs of the health care facilities using letters of support provided by East Gojjam zonal health department about ethical approval. The study was conducted according to the criteria set by the declaration of Helsinki. Key informants were asked to sign a consent form to confirm their willingness to take part in the study, and they have provided informed written consent to participate. Both written and verbal consent from participants were obtained. They have assured that their personal information should not indicate at the data collection tool and social as well as professional principles retained confidentially.
Acknowledgments
The authors would like to thank Jimma University for facilitating the study and East Gojjam Zone for providing us all the requested data. We would also like to thanks the staff of Jimma University Mr.Yimenu Yitayih (Ph.D. candidate) for revising the final manuscript.
Funding
Global health supply chain program-procurement and supply management (GHSC-PSM) covered costs spent on stationery materials and data collection process. The funder had no role in the study design, data collection, and analysis, decision to publish, or preparation of the manuscript.
Disclosure
Azmeraw Bekele reports grants from global health supply chain program-procurement and supply management (GHSC-PSM), during the conduct of the study. The authors report no other potential conflicts of interest for this work.
References
1. Chopra S, Meindl P. Supply Chain Management.
2. USAID deliver project. The logistics handbook: a practical guide for the supply chain management of health commodities, arlington, VA, USD: task Order 1; 2011. [Online]. Available from: https://apps.who.int/medicinedocs/documents/s20211en/s20211.en.pdf.
3. Hare L. Logistics Management Information Systems. John Snow, Inc; 2012.
4. Chikumba PA. Geographic information system as a tool for enriching drug logistics information at district level in malawi: challenges on data quality. 2014;135:209–218.
5. Shewarega A, Dowling P, Necho W, et al. Ethiopia: National survey of the integrated pharmaceutical logistics System. Arlington, Va.: USAID | DELIVER PROJECT, Task Order 4, and Pharmaceuticals Fund and Supply Agency (PFSA). 2015.
6. Damtie TA, Ibrahim AJ, Yikna BB. Supply chain management performance of HIV/AIDS commodities and factors affecting it at health facilities of SNNPRS of Ethiopia; from the perspective of achieving 90-90-90 strategies. Integrated Pharmacy Research Practice. 2020;9:11–21. doi:10.2147/IPRP.S228162
7. Building Blocks for logistics system design for HIV tests and ARV drugs Inventory Control systems, logistics management information systems, and Storage and distribution [Internet]; 2008. Available from: https://publications.jsi.com/JSIInternet/Inc/Common/_download_pub.cfm?id=11098&lid=3.
8. The Logistics Management Information System (LMIS) assessment guidelines [Internet]. PSM Toolbox. Available from: https://www.psmtoolbox.org/en/tool/inventory-management/hiv-aids/medicines/the-logistics-management-information-system-lmis-assessment-guidelines/.
9. Monitoring and evaluation indicators for assessing logistics systems performance [Internet]; 2006. Available from: http://iaphl.org/wpcontent/uploads/2016/05/M_E_indicators_hdbk.pdf.
10. Chimnani A, Kamunyori J, Tuddenham TSJ. Tanzania: TB and leprosy logistics system assessment quantitative and qualitative results from the LIAT and the LSAT [Internet]; 2011. Available from: https://publications.jsi.com/JSIInternet/Inc/Common/_download_pub.cfm?id=12240&lid=3.
11. MAUL. Report of the Baseline Assessment of HIV/AIDS-Related Commodities’ Logistics System for New Health Facilities. Uganda: CDC; 2013.
12. Kingston U, Chinedum OK, Emmanuel IO, Michael O, Negedu O. Evaluation of laboratory logistics management information system in HIV/AIDS comprehensive health facilities in Bayelsa State, Nigeria. Int J Curr Res Med Sci. 2017;3(1):21–38.
13. Asemahagn MA, Lee A. Determinants of routine health information utilization at primary healthcare facilities in Western Amhara, Ethiopia. Cogent Medicine. 2017;4(1):1. doi:10.1080/2331205X.2017.1387971
14. Asemahagn MA, Alene GD, Yimer SA. Geographic accessibility, readiness, and barriers of health facilities to offer tuberculosis services in East Gojjam Zone, Ethiopia: A convergent parallel design. Res Rep Trop Med. 2020;11:3–16. doi:10.2147/RRTM.S233052
15. USAID deliver project, task order 1. logistics indicators assessment tool (LIAT): antiretroviral drugs. Arlington, VA.: USAID deliver project, task order 1; 2009. http://deliver.jsi.com/dlvr_content/resources/./LIAT_ARV.doc.
16. PFSA. Standard operating procedures (SOP) manual for the integrated pharmaceuticals logistics system in health facilities of Ethiopia. Addis Ababa, Ethiopia; Nov. 2015. [Online]. Available from: www.pfsa.gov.et/webadmin/./IPLS%20-%20SOP%20-%20Nov%20-%202015.pdf.
17. USAID deliver project, task order 1. logistics system assessment tool (LSAT) [Internet]. Arlington, Va.: USAID DELIVER PROJECT, Task Order 1; 2009. Available from: https://publications.jsi.com/JSIInternet/Inc/Common/_download_pub.cfm?id=14130&lid=3.
18. Harmonized monitoring and evaluation indicators for procurement and supply management systems [Internet]. Available from: https://apps.who.int/iris/bitstream/handle/10665/44546/9789241500814_eng.pdf.
19. Inventory Management Assessment Tool (IMAT) management sciences for health [internet]. Available from: https://www.msh.org/resources/inventory-management-assessment-tool-imat.
20. MEASURE Evaluation. The malaria routine data quality assessment (MRDQA) Tool [Internet]. Chapel Hill, NC, USA: University of North Carolina; 2020. Available from: https://www.measuremalaria.org/wp-content/uploads/2020/04/ms-20-190.pdf.
21. Kolapo U, Bunde E, Ronnow E, Igharo E. Nigeria: contraceptive logistics management system assessment report [internet]. Arlington, VA.: USAID deliver project, task order 1.; 2009. Available from: https://esaro.unfpa.org/sites/default/files/pub-pdf/Nigeria_contlogimanaasse.pdf.
22. Tilahun A, Geleta D, Abeshu M, et al. Assessment of integrated pharmaceutical logistic system for the management HIV/AIDS and tuberculosis laboratory diagnostic commodities in public health facilities in Addis Ababa, Ethiopia. J Pharma Care Health Sys. 2016;3:2376–2419.
23. Cai L, Zhu Y. The challenges of data quality and data quality assessment in the big data era. Data Science J. 2015;14:2. doi:10.5334/dsj-2015-002
24. Toward Building resilient pharmaceutical systems: SIAPS final report [Internet]. [
 © 2021 The Author(s). This work is published and licensed by Dove Medical Press Limited. The full terms of this license are available at https://www.dovepress.com/terms.php and incorporate the Creative Commons Attribution - Non Commercial (unported, v3.0) License.
By accessing the work you hereby accept the Terms. Non-commercial uses of the work are permitted without any further permission from Dove Medical Press Limited, provided the work is properly attributed. For permission for commercial use of this work, please see paragraphs 4.2 and 5 of our Terms.
© 2021 The Author(s). This work is published and licensed by Dove Medical Press Limited. The full terms of this license are available at https://www.dovepress.com/terms.php and incorporate the Creative Commons Attribution - Non Commercial (unported, v3.0) License.
By accessing the work you hereby accept the Terms. Non-commercial uses of the work are permitted without any further permission from Dove Medical Press Limited, provided the work is properly attributed. For permission for commercial use of this work, please see paragraphs 4.2 and 5 of our Terms.