")
Back to Journals » Clinical, Cosmetic and Investigational Dermatology » Volume 16
Low Expression of CLEC2B Indicates Poor Prognosis in Melanoma
Received 18 November 2022
Accepted for publication 11 February 2023
Published 21 February 2023 Volume 2023:16 Pages 463—477
DOI https://doi.org/10.2147/CCID.S395854
Checked for plagiarism Yes
Review by Single anonymous peer review
Peer reviewer comments 2
Editor who approved publication: Dr Jeffrey Weinberg
Yanqiu Zhang, Yaling Li, Hongwei Yan
Department of Dermatology, The First Hospital of China Medical University, Shenyang, 110001, People’s Republic of China
Correspondence: Hongwei Yan, Department of Dermatology, The First Hospital of China Medical University, Shenyang, 110001, People’s Republic of China, Email [email protected]
Background: Melanoma is a highly malignant skin tumor with a poor prognosis. Identification of novel biomarkers might potentially reveal the underlying mechanisms of melanoma progression.
Methods: We demonstrated the relationship between pan-cancer CLEC2B expression and melanoma samples in The Cancer Genome Atlas (TCGA) database. Next, the Kaplan-Meier plot and Cox regression analysis determined the prognostic value of CLEC2B in melanoma. Biological pathway enrichment was screened by Gene Ontology (GO), Kyoto Encyclopedia of Genes and Genomes (KEGG), and Gene Set Enrichment Analysis (GSEA), enabling the correlation analysis between the immune infiltration level and CLEC2B expression in melanoma. Our final claim was validated using qPCR, immunohistochemistry, Western blot, cell colony formation assays, ethynyldeoxyuridine (Edu) analysis, and cell Invasion assays.
Results: Our study revealed that the high CLEC2B expression correlates with poor overall survival of melanoma patients. Moreover, a low expression of CLEC2B was found in the A375 cell line. In addition, CLEC2B has significant prognostic value in melanoma diagnosis, with an AUC of 0.896. Prognostic analysis showed the low expression of CLEC2B to be independently associated with melanoma patients. Moreover, the expression of CLEC2B was significantly correlated with B cells, eosinophils, macrophages, neutrophils, NK cells, T helper cells, Tregs, Th1 cells, Th17 cells, and Th2 cells. PCR and immunohistochemistry indicated CLEC2B to be significantly downregulated in melanoma. The cell colony formation assay showed CLEC2B knockout increased the proliferation of A375 cells.
Conclusion: Our study established low levels of CLEC2B to be poor prognostic markers, enabling immunosuppressive cell infiltration in melanoma.
Keywords: melanoma, CLEC2B, prognosis, immune infiltration, TCGA
Introduction
Melanoma is the deadliest type of skin cancer, with a rising yearly incidence.1,2 Despite the rapid development of checkpoint immunotherapy and targeted therapies, the main melanoma treatment methods include surgical resection and chemotherapy.3,4 Recent immunosuppressive agents increase the one-year survival rate of melanoma patients to more than 50%. However, many patients do not respond to these drugs, while many who have previously responded acquire secondary drug resistance.4 Therefore, critically determining prognostic biomarkers will help doctors to timely and accurately predict the state of melanoma patients by using improved personalized treatment plans.
Increasing evidence suggests that CLEC2B is a crucial regulator in tumor evolution.5,6 CLEC2B is a member of the C-type lectin domain family two member B and encodes a member of the C-type lectin/C-type lectin-like domain (CTL/CTLD) superfamily. These family members share common protein folding techniques and have multiple functions, including intercellular signal transduction, glycoprotein conversion, and its role in inflammation.7 CLEC2B is a well-known prognostic biomarker of endometrial cancer.8 However, the expression and clinical significance of CLEC2B in melanoma have not been studied.
We studied CLEC2B expression in melanoma using patient data from TCGA database. We studied the transcriptional level and prognostic significance of CLEC2B by analyzing data obtained by TCGA-SKCM. We also explored its biological mechanism using GO, KEGG and GSEA to assess the association between CLEC2B and immune infiltration. qPCR, immunohistochemistry, Western blot, cell colony formation assays, ethynyldeoxyuridine (Edu) analysis, and cell invasion assays confirmed our conclusion. This study established the vital role of CLEC2B in melanoma and provided an in-depth understanding of the potential underlying mechanisms of CLEC2B and tumor immune interactions.
Materials and Methods
Data Preparation
RNA-sequencing and follow-up data for melanoma patients were acquired from TCGA-SKCM (n=471). We acquired data from UCSC Xena (https://xenabrowser.net/datapages/) to evaluate the pan-cancer expression level of CLEC2B.
Patients and Tissues
Twelve melanoma samples and matched non-tumor tissues were obtained from the First Affiliated Hospital of China Medical University. The ethics committee of the First Affiliated Hospital of China Medical University approved this study. And the study was conducted in accordance with the declaration of Helsinki. Melanoma tissues were obtained, frozen in liquid nitrogen, and stored at −80 °C after surgery for qPCR detection.
Gene Ontology (GO), Kyoto Encyclopedia of Genes and Genomes (KEGG) and Gene Set Enrichment Analysis (GSEA)
We used GO, KEGG, and GSEA to identify the enrichment patterns in the genome and pathways related to CLEC2B based on the transcriptional sequences of TCGA-SKCM. Functional enrichment in the DEGs was analyzed using Gene Ontology (GO) and Kyoto Encyclopedia of Genes and Genomes (KEGG) using the R package GOplot (version 1.0.2). Gene set enrichment analysis (GSEA) was carried out using the R package clusterProfiler, and an adjusted p-value <0.05 and false discovery rate (FDR) < 0.25 were regarded as statistically significantly enriched functions or pathway terms.
Immune Cell Infiltration
A total of 24 immune cells were used to investigate the level of immune infiltration. The relative enrichment score of these immune cells in breast cancer was assessed by single-sample GSEA (ssGSEA) using the R package GSVA. The correlation between CLEC2B expression and the immune cells was investigated using Spearman correlation analysis. The immune infiltration differences between the high and low CLEC2B expression groups were evaluated using the Wilcoxon rank-sum test.
Survival and Prognosis Analysis
The Kaplan-Meier method with the Log rank test was used for survival analysis, and the median expression level of CLEC2B was set as the cut-off value. Univariate and multivariate Cox regression analysis were used to assess the effect of clinical variables on patient outcomes. The prognostic variables p < 0.1 in the univariate Cox regression analysis were incorporated into the multivariate Cox regression analysis. The R package ggplot2 was used to visualize the forest map.
Construction and Validation of the Nomogram
A nomogram based on independent prognostic factors in multivariate Cox analysis was constructed to predict the overall survival probability. Calibration plots assessed the performance of the nomogram, while the concordance index (C-index) quantified the discrimination of the nomogram. This nomogram and calibration plots were created using the R package RMS (version 5.1–4)8. The time-dependent receiver-operating characteristic (ROC) curve evaluated the predictive accuracy using the timeROC package.
Cell Culture and Transfection
The A375 cell line was obtained from The Chinese Academy of Sciences. Small interfering RNA (siRNA) and Lipofectamine 2000 (Invitrogen, Shanghai, China) were used, as previously described,9 for cell transfection.
RNA Isolation and qPCR Analysis
RNA extraction from tissues was performed using TRIzol reagent (Invitrogen, Carlsbad, CA, USA). RNA was reverse-transcribed into cDNA with the QuantiTect Reverse Transcription Kit (QIAGEN, Valencia, CA, USA). qPCR analyses were performed using SYBR-Green (Takara, Otsu, Shiga, Japan), and the gene expression levels were normalized to GAPDH levels. Sequences of upstream and downstream primers were as follows: CLEC2B: 5′-GTTCCACTCAACATGCCGAC-3′ and 5′-TGCCATCTTCAGTCCAATCCA-3′.
Immunohistochemistry
Immunohistochemistry (IHC) staining was carried out as previously described.10 Briefly, each group of melanoma samples was fixed in 10% formalin, embedded in paraffin, and processed as 5μm continuous sections. Samples were dewaxed with discontinuous ethanol concentration gradients and blocked to inhibit endogenous peroxidase. They were then heated in a microwave for antigen retrieval, cooled to room temperature, and blocked in goat serum for 30 minutes at 37°C. Samples were incubated in rabbit anti-CLEC2B (Abcam, Cambridge, UK; 1: 1, 200) overnight at 4°C, followed by horseradish peroxidase (HRP)-coupled goat anti-rabbit secondary antibody at 37°C for 30 minutes, and stained by 3,3′-diaminobenzidine. The cell nucleus was stained blue by hematoxylin. Sections were then dehydrated, cleared by xylene, and mounted. CLEC2B expression was detected by IHC using a streptavidin peroxidase method.
Cell Colony Formation Assay
The cells were seeded at a density of 1×10³/mL per well in the 6-well plates per 2 mL of DMEM supplemented with 10% FBS, 100 U/mL penicillin, and 100 μg/mL streptomycin. Single-cell-derived clones were grown for ten days. The culture was pre-cooled three times with PBS, fixed with methanol for 15 min, stained with crystal violet for 20 min, and the water was rinsed and air dried. The number of visible clones was visually counted, and the colony formation rate was calculated:  . This procedure was repeated three times.
Western Blotting Assay
Cells were lysed using RIPA Lysis containing Protease/Phosphatase Inhibitor Cocktail (Abcam). The extracted proteins were separated in 10% SDS‐polyacrylamide gel and then transferred to immobilon‐P membranes (Merck Millipore). The membrane was blocked with 5% nonfat dry milk in PBS containing 0.1% Tween 20 (PBST) for one h at room temperature and then incubated with primary antibodies overnight at 4°C. The next day, the membranes were washed three times with Tris‐buffered saline Tween and then incubated with HRP‐conjugated secondary antibody (1:1000, Santa Cruz Biotech) at room temperature for two hours. Finally, all the bands were detected using ECL Western blotting kit (Amersham Biosciences). GAPDH was used as an internal reference.10
Cell Invasion Assays
Cells were harvested, resuspended in serum-free media, and placed in the upper chamber of a Transwell membrane filter coated with Matrigel (Corning) for invasion assays. A culture medium with 10% FBS and 0/5/10 nM Tanespimycin was added to the lower compartment as a chemoattractant. After 24 h of incubation, cells were fixed with methanol, stained with 0.1% crystal violet, imaged, and counted using an Olympus microscope (Tokyo, Japan).
Ethynyldeoxyuridine (Edu) Analysis
The cells were cultured in 96-well plates at a density of 4 × 10⁴ cells/well. Forty-eight hours after transfection, 20 μM Edu labeling media (Beyotime Biotechnology, Shanghai, China) was added to the wells and incubated for two h at 37 °C and 5% CO2. The cells were then treated with 4% paraformaldehyde and 0.5% Triton X-100 and finally stained with an anti-Edu working solution. The percentage of Edu-positive cells was calculated after fluorescence microscopy analysis.
Statistical Analysis
The statistical tool SPSS 21.0 was used to statistically analyze the data (IBM Corporation, Armonk, NY, USA). GraphPad Prism 8.0 was used to generate the graphs (GraphPad Software, Inc., San Diego, CA). Student’s t-tests were used for the statistical analysis of the data. A two-tailed p < 0.05 indicated a significant value, wherein “ns” represented p > 0.05, *represented p <= 0.05, **represented p <= 0.01 and ***represented p <= 0.001.
Result
Expression Analysis of CLEC2B in Pan-Cancer and Melanoma
The expression analysis of CLEC2B in 33 cancers showed that CLEC2B was less expressed in most cancers, including adrenocortical carcinoma (ACC), urothelial bladder carcinoma (BLCA), breast invasive carcinoma (BRCA), COAD (colon adenocarcinoma), kidney chromophobe (KICH), liver hepatocellular carcinoma (LIHC), lung adenocarcinoma (LUAD), lung squamous cell carcinoma (LUSC), ovarian serous cystadenocarcinoma (OV), prostate adenocarcinoma (PRAD), rectal adenocarcinoma (READ), skin cutaneous melanoma (SKCM), thyroid carcinoma (THCA), uterine corpus endometrial carcinoma (UCEC) and uterine carcinosarcoma (UCS). However, CLEC2B was highly expressed in cholangiocarcinoma (CHOL), glioblastoma (GBM), head and neck squamous cell carcinoma (HNSC), kidney renal clear cell carcinoma (KIRC), acute myeloid leukemia (LAML), pancreatic adenocarcinoma (PAAD) and stomach adenocarcinoma (STAD) and thymoma (THYM) (Figure 1A). We assessed the expression of CLEC2B in melanoma in the TCGA-SKCM, which confirmed its low expression in melanoma (Figure 1B). We further studied the association between CLEC2B expression and clinical outcomes. Survival analysis revealed significant differences between different cancer types. In the SKCM cohort, patients with high CLEC2B levels showed more prolonged overall survival (OS), progression-free interval (PFI), and disease-specific survival (DSS) than those with low CLEC2B levels (Figure 1C–E). In the following research, we focussed on exploring the role of CLEC2B in melanoma.
 |
Figure 1 CLEC2B expression level in mRNA based on TCGA database. (A) Overview of CLEC2B mRNA expression in different tumor tissues and adjacent normal tissues. (B) Comparison of CLEC2B expression between SKCM and normal tissues. Risk plot of the correlation between CLEC2B: (C) OS. (D) PFI. (E) DSS. (right represents HR > 1 (risky); left represents HR < 1 (protective)) “ns” represented p > 0.05, “*” represented p <= 0.05 and “***” represented p <= 0.001. |
Clinical Correlation of CLEC2B Expression in Patients with Melanoma
The clinical characteristics and gene expression data of 471 patients with melanoma from TCGA-SKCM helped us divide the patients into CLEC2B high (n = 236) and low expression groups (n = 235) to investigate the correlation between CLEC2B expression and the clinicopathological features of patients. The expression of CLEC2B significantly correlated with T stage (P < 0.001), pathological stage (P < 0.001), radiation therapy (P = 0.018), age (P = 0.010), melanoma ulceration (P = 0.002), and Breslow depth (P < 0.001), and was also associated with age (P < 0.001) (Table 1).
 |
Table 1 CLEC2B Expression in SKCM Patients with Different Clinical Parameters |
Correlation Between CLEC2B Expression and Survival Prognosis of Melanoma Patients
CLEC2B expression showed a significant correlation with overall survival (OS), disease-related survival (DSS), and progression-free survival (PFI) in melanoma patients. Kaplan-Meier plots showed that patients with lower CLEC2B had a worse prognosis for OS (HR = 0.57, 95% CI: 0.43–0.74, P < 0.001) (Figure 2A) and DSS (HR = 0.57, 95% CI: 0.43–0.76, P < 0.001) (Figure 2B). For PFI also, a similar trend was observed (HR = 0.71, 95% CI: 0.56–0.89, P = 0.003) (Figure 2C). In addition, we generated receiver operating characteristic (ROC) curves to assess the feasibility of distinguishing melanoma tissues from normal skin tissues based on CLEC2B expression levels, which revealed the area under the ROC curve (AUC) to be 0.896 (Figure 2D). Therefore, our results indicated that CLEC2B might be a potential prognostic biomarker in patients with melanoma.
 |
Figure 2 Survival in patients with high and low CLEC2B. (A) OS. (B) DSS. (C) PFI (D) ROC analysis illustrated that CLEC2B expression accurately discriminated SKCM tumor tissues from normal tissues. |
Univariate and Multivariate Survival Analysis
We then conducted univariate and multivariate analyses, in which the former showed that low expression of T3 and T4 of T stage, N1 and N3 of N stage, M1 of M stage, age > 60, stage 2, stage 3 and 4 of the pathological stage, other of tumor tissue site and CLEC2B were associated with OS. The latter analysis revealed independent risk factors. We found that the main T4 stage and low expression of CLEC2B were independent prognostic factors of OS in SKCM inpatients (Table 2 and Figure 3).
 |
Table 2 Univariate Analysis and Multivariate Analysis of the Correlation Between Clinicopathological Characteristics and OS in SKCM |
 |
Figure 3 Univariate and multivariate survival analysis. (A) Univariate Analysis of the Overall Survival of Melanoma Patients (B) Multivariate Analysis of the Overall Survival of Melanoma Patients. (p-value is log rank test p). Abbreviation: HR, hazard ratio. |
CLEC2B Gene Enrichment Analysis
Three thousand four hundred twenty-eight genes were differentially expressed between groups with low and high levels of CLEC2B expression, including 879 downregulated and 2549 upregulated DEGs (adjusted p-value <0.05, |Log2-FC| > 1) (Figure 4A and Supplementary Table 1). GO, KEGG and GSEA analyses of the DEGs showed enrichment of GO terms, including molecular functions, cellular components, and biological processes, enriched in receptor ligand activity, antigen binding, skin development, and human immune response (Figure 4B). The KEGG pathway analysis demonstrated significant enrichment of the Cytokine cycloline receiver interaction, Neuroactive light receiver interaction, and Haematopoietic cell lineage (Figure 4C). In addition, GSEA of the DEGs identified some immune-related biological processes, such as GPCR ligand binding, interleukins signaling, and neuronal system (Figure 4D). Next, analyzing the relationship between the top 20 upregulated and downregulated DEGs and CLEC2B revealed most DEGs to be significantly associated with CLEC2B (Figure 4E and F).
 |
Figure 4 Differentially expressed genes (DEGs) related to CLEC2B and functional enrichment analysis of CLEC2B in melanoma. (A) Volcano plot. The blue dot and red dot indicate the DEGs that are significantly downregulated and upregulated, respectively. (B) GO analysis. (C) KEGG analysis. (D) GSEA. (E) Heatmap of the correlation between CLEC2B expression and the upregulated 20 DEGs. (F) Heatmap of the correlation between CLEC2B expression and the downregulated 20 DEGs. *p<0.05, **p< 0.01, ***p<0.001. |
Relationship Between CLEC2B Expression and Immune Cell Infiltration
We further evaluated the relationship between CLEC2B expression and immune cell infiltration using ssGSEA and Spearman’s R to study the potential relationship between CLEC2B expression and 24 immune cell types. The analysis revealed CLEC2B expression to be significantly positively correlated with B cells, eosinophils, macrophages, neutrophils, NK cells, T helper cells, Tregs, Th1 cells, Th17 cells, and Th2 cells (Figure 5A). Varying degrees of correlation between the ratios of 24 different types of tumor-infiltrating immune cell subsets were evaluated and visualized via heatmap (Figure 5B).
 |
Figure 5 (A) Lollipop chart of CLEC2B expression levels in 24 immune cell types. (B) Heatmap of 24 infiltrating immune cells in SKCM and CLEC2B have the vital role in the immune infiltration in SKCM. |
Nomogram Construction and Validation Based on the Independent Factors
A nomogram based on independent OS factors was generated to predict melanoma patients’ prognosis. In this analysis, the higher the total score, the worse the prognosis (Figure 6A). In addition, the calibration curve was used to evaluate the prediction power of the nomogram (Figure 6B–D), indicating its suitability.
 |
Figure 6 A nomogram and calibration curves for the prediction of one-, three-, and five-year overall survival rates of patients with melanoma. (A) A nomogram for the prediction of the one-, three-, and five-year overall survival rates of patients with melanoma. (B–D) Calibration curves of the nomogram prediction of one-, three-, and five-year overall survival rates of patients with melanoma. |
CLEC2B is Expressed at Low Levels in Melanoma
Further verification of CLEC2B expression in melanoma tissues by qPCR, immunohistochemistry, Western blot, cell colony formation assays, ethynyldeoxyuridine (Edu) analysis, and cell Invasion assays validated the low levels of CLEC2B in melanoma (Figure 7A and B). Next, we transfected the CLEC2B-targeted pEZ-M03 vector into the A375 cell line. Western blot showed that CLEC2B was highly expressed in A375 cells after transfection (Figure 7C). The colony formation assay results showed decreased proliferation of A375 cells transfected with CLEC2B (Figure 7D). Moreover, the proliferation of A375 cells decreased upon CLEC2B overexpression, determined by Edu assays (Figure 7E). Cell invasion assays showed that CLEC2B overexpression inhibited the invasion ability of cells (Figure 7F). These findings collectively indicated that CLEC2B may act as tumor suppressor in melanoma.
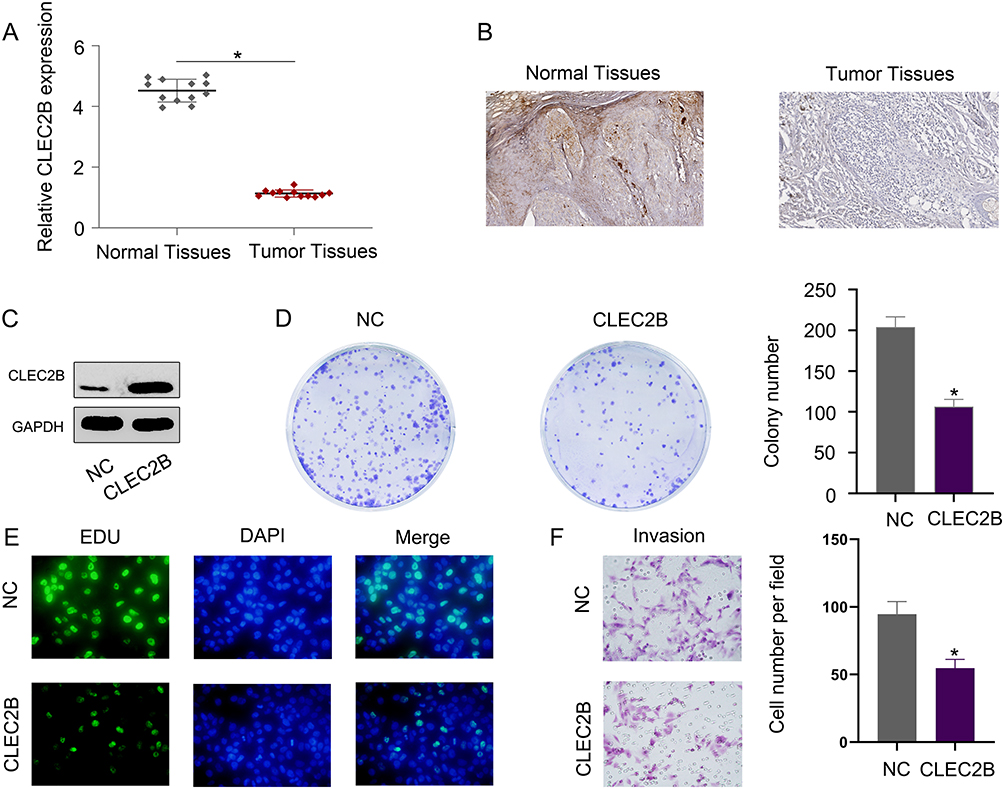 |
Figure 7 CLEC2B is expressed at low levels in melanoma. (A) The expression of CLEC2B mRNA was measured by qPCR. (B) The expression of CLEC2B proteins was measured by immunohistochemistry. (C) The expression of CLEC2B proteins was measured by Western blot. (D) Decreased proliferation of A375 cells transfected with CLEC2B vector. (E) The proliferation rate of A375 cells was measured by Edu assays. (F) Cell invasion assays were used to measure the effect of CLEC2B on cell invasion. *p<0.05. |
Discussion
The mortality rate of melanoma remains high, and its occurrence results from multiple genetic changes.11,12 Due to the high heterogeneity of melanoma, it is crucial to find different prognostic biomarkers.
In this study, we evaluated the role of CLEC2B as a prognostic melanoma biomarker. We evaluated the expression of CLEC2B in melanoma patients and across cancers by analyzing RNA-seq data from TCGA-SKCM, which revealed low CLEC2B expression in melanoma and worse prognosis in patients with low CLEC2B expression. The ROC curve also indicates that CLEC2B can be a potential biomarker for melanoma prognosis. Subsequently, univariate and multivariate survival analyses in melanoma patients showed that the T4 stage and low expression of CLEC2B were independent prognostic factors of OS. Moreover, the over expression of CLEC2B decreased the proliferation and invasion ability of melanoma cells. Overall, these results suggest the possible effect of the expression of CLEC2B on the prognosis of melanoma.
GSEA on the CLEC2B coexpression data set revealed that CLEC2B was involved in the GPCR_LIGAND_BINDING and SIGNALING_BY_INTERLEUKINS pathways with positive correlation. These two pathways extensively affect cell proliferation, migration, differentiation, and metabolism. In melanoma, GPCR-mediated signal transduction is activated by combining paracrine factors and their receptors or by activating mutations to promote proliferation, invasion, and migration.13,14 In addition, the interleukin signaling pathway is also implicated in the treatment of melanoma. Various interleukins inhibit melanoma development by regulating the tumor microenvironment’s immunity and inflammation,15–17 suggesting a possible role of CLEC2B in the immune response of melanoma.
ssGSEA and Spearman correlation to investigate the relationship between the expression of CLEC2B and the level of immune infiltration in melanoma revealed CLEC2B to be positively correlated with macrophages, B cells, neutrophils, T helper cells, Tregs, Th1 cells, and Th2 cells. B cells are activated in the germinal center of the tertiary lymphatic structure, increasing antigen presentation to T cells or killing tumor cells, thus producing beneficial clinical effects.18 The macrophage infiltration of tumors is related to chemoresistance and poor prognosis in most cancers. Macrophages promote tumor malignancy and its occurrence by stimulating angiogenesis, increasing tumor cell invasion, migration, and intravascular infiltration, and inhibiting antitumor immunity.19 The high ratio of circulating neutrophils to lymphocytes is a robust biomarker of poor clinical outcomes of various cancers.20 Neutrophils may be reprogrammed to promote cancer in their microenvironment.21 Treg cells adversely improve cancer progression by regulating immune monitoring and inhibiting the antitumor immune response. Increased Treg cell levels are related to disease progression and low survival in various cancers.22 The cytokines and chemokines secreted by Th1 cells are the primary effector molecules downstream of immune cell signal transduction. Th2 cells conduct IL-4 signal transduction through STAT6 and upregulated transcription. IL-4 binds to the IL-4 receptor on immune cells, resulting in nuclear translocation, STAT6 phosphorylation, and GATA3 transcription factor expression, leading to 2-cell factor secretion and final tumor metastasis and growth.23
Moreover, CLEC2B was negatively correlated with eosinophils, NK cells, and Th17 cells. Studies have shown that eosinophils have the regulatory function of other immune cell subsets in the tumor microenvironment or cytotoxic function to tumor cells, resulting in either antitumor or tumor-promoting effects.24 Natural killer (NK) cells efficiently kill adjacent tumor cells, which increases in the context of targeted molecular therapy.25 Th17 cells and related cytokines promote tumorigenesis or tumor inhibition, depending on the proportion of Th17 and Treg cells.26 ssGSEA analysis showed how CLEC2B plays an essential role in regulating the immune infiltration of melanoma.
Finally, our results were validated using qPCR, immunohistochemistry, Western blot, cell colony formation assays, ethynyldeoxyuridine (Edu) analysis, and cell Invasion assays. We proved that the CLEC2B expression was significantly lower than that in matched non-tumor tissues. In addition, the overexpression of CLEC2B decreased the proliferation and invasion ability of melanoma A375 cells. In conclusion, these results collectively suggested CLEC2B as a potential predictive tumor marker in patients with melanoma.
Our research has some shortcomings. First, the data has been used from public databases. Second, more volume of tissue samples from patients with melanoma is warranted to verify the potential of these biomarkers. Moreover, we need more experiments in cell lines and animal models to illustrate the mechanism to demonstrate the usefulness of the biomarkers.
Conclusion
Overall, our study highlights how the low expression of CLEC2B is associated with the prognosis of melanoma patients. In addition, CLEC2B was positively correlated with B cells, neutrophils, macrophages, T helper cells, Tregs, Th2 cells, and Th1 cells and negatively correlated with eosinophils, NK cells, and Th17 cells. Therefore, CLEC2B indicates a probable relation to immune infiltration, which can be used as a prognostic factor in melanoma patients.
Data Sharing Statement
The data that support the findings of this study are available from the corresponding author upon reasonable request.
Ethics Approval and Informed Consent
Before undergoing the treatment, all patients and their legal guardians provided written informed consent for their data to be published in the article. The study was conducted in accordance with the declaration of Helsinki and the study was also approved by the First Affiliated Hospital of China Medical University.
Author Contributions
All authors made a significant contribution to the work reported, whether that is in the conception, study design, execution, acquisition of data, analysis and interpretation, or in all these areas; took part in drafting, revising or critically reviewing the article; gave final approval of the version to be published; have agreed on the journal to which the article has been submitted; and agree to be accountable for all aspects of the work.
Funding
This work was supported by National Science and Technology Major Projects of China, Grant/Award Number (2018ZX10101003 and 2018ZX10712001).
Disclosure
The authors declare that there are no conflicts of interest regarding the publication of this study.
References
1. O’Neill CH, Scoggins CR. Melanoma. J Surg Oncol. 2019;120:873–881. doi:10.1002/jso.25604
2. Bobos M. Histopathologic classification and prognostic factors of melanoma: a 2021 update. Ital J Dermatol Venerol. 2021;156:300–321. doi:10.23736/S2784-8671.21.06958-3
3. Curti BD, Faries MB. Recent advances in the treatment of melanoma. N Engl J Med. 2021;384:2229–2240. doi:10.1056/NEJMra2034861
4. Davis LE, Shalin SC, Tackett AJ. Current state of melanoma diagnosis and treatment. Cancer Biol Ther. 2019;20:1366–1379. doi:10.1080/15384047.2019.1640032
5. Gao Y, Li Y, Niu X, et al. Identification and validation of prognostically relevant gene signature in melanoma. Biomed Res Int. 2020;2020:5323614. doi:10.1155/2020/5323614
6. Tang S, Huang X, Jiang H, Qin S. Identification of a five-gene prognostic signature related to B cells infiltration in pancreatic adenocarcinoma. Int J Gen Med. 2021;14:5051–5068. doi:10.2147/IJGM.S324432
7. Suzuki-Inoue K. Platelets and cancer-associated thrombosis: focusing on the platelet activation receptor CLEC-2 and podoplanin. Blood. 2019;134:1912–1918. doi:10.1182/blood.2019001388
8. Guo C, Tang Y, Zhang Y, Li G. Mining TCGA data for key biomarkers related to immune microenvironment in endometrial cancer by immune score and weighted correlation network analysis. Front Mol Biosci. 2021;8:645388. doi:10.3389/fmolb.2021.645388
9. Li Y, Gao Y, Niu X, et al. LncRNA BASP1-AS1 interacts with YBX1 to regulate notch transcription and drives the malignancy of melanoma. Cancer Sci. 2021;112:4526–4542. doi:10.1111/cas.15140
10. Li YL, Gao YL, Niu XL, et al. Identification of subtype-specific metastasis-related genetic signatures in sarcoma. Front Oncol. 2020;10:544956. doi:10.3389/fonc.2020.544956
11. Rastrelli M, Tropea S, Rossi CR, Alaibac M. Melanoma: epidemiology, risk factors, pathogenesis, diagnosis and classification. In Vivo. 2014;28:1005–1011.
12. Teixido C, Castillo P, Martinez-Vila C, Arance A, Alos L. Molecular markers and targets in melanoma. Cells. 2021;10. doi:10.3390/cells11010010
13. Lissitzky JC, Parriaux D, Ristorcelli E, Vérine A, Lombardo D, Verrando P. Cyclic AMP signaling as a mediator of vasculogenic mimicry in aggressive human melanoma cells in vitro. Cancer Res. 2009;69:802–809. doi:10.1158/0008-5472.CAN-08-2391
14. Raymond JH, Aktary Z, Larue L, Delmas V. Targeting GPCRs and their signaling as a therapeutic option in melanoma. Cancers. 2022;14(3):706. doi:10.3390/cancers14030706
15. Hong JT, Son DJ, Lee CK, Yoon DY, Lee DH, Park MH. Interleukin 32, inflammation and cancer. Pharmacol Ther. 2017;174:127–137. doi:10.1016/j.pharmthera.2017.02.025
16. Majidpoor J, Mortezaee K. Interleukin-2 therapy of cancer-clinical perspectives. Int Immunopharmacol. 2021;98:107836. doi:10.1016/j.intimp.2021.107836
17. Kirkwood JM, Tarhini AA, Panelli MC, et al. Next generation of immunotherapy for melanoma. J Clin Oncol. 2008;26:3445–3455. doi:10.1200/JCO.2007.14.6423
18. Fridman WH, Petitprez F, Meylan M, et al. B cells and cancer: to B or not to B. J Exp Med. 2021;218. doi:10.1084/jem.20200851
19. Cassetta L, Pollard JW. Targeting macrophages: therapeutic approaches in cancer. Nat Rev Drug Discov. 2018;17:887–904. doi:10.1038/nrd.2018.169
20. Shaul ME, Fridlender ZG. Tumour-associated neutrophils in patients with cancer. Nat Rev Clin Oncol. 2019;16:601–620. doi:10.1038/s41571-019-0222-4
21. Xiong S, Dong L, Cheng L. Neutrophils in cancer carcinogenesis and metastasis. J Hematol Oncol. 2021;14:173. doi:10.1186/s13045-021-01187-y
22. Togashi Y, Shitara K, Nishikawa H. Regulatory T cells in cancer immunosuppression - implications for anticancer therapy. Nat Rev Clin Oncol. 2019;16:356–371. doi:10.1038/s41571-019-0175-7
23. Basu A, Ramamoorthi G, Albert G, et al. Differentiation and regulation of T(H) cells: a balancing act for cancer immunotherapy. Front Immunol. 2021;12:669474. doi:10.3389/fimmu.2021.669474
24. Simon S, Utikal J, Umansky V. Opposing roles of eosinophils in cancer. Cancer Immunol Immunother. 2019;68:823–833. doi:10.1007/s00262-018-2255-4
25. Shimasaki N, Jain A, Campana D. NK cells for cancer immunotherapy. Nat Rev Drug Discov. 2020;19:200–218. doi:10.1038/s41573-019-0052-1
26. Knochelmann HM, Dwyer CJ, Bailey SR, et al. When worlds collide: th17 and treg cells in cancer and autoimmunity. Cell Mol Immunol. 2018;15:458–469. doi:10.1038/s41423-018-0004-4
 © 2023 The Author(s). This work is published and licensed by Dove Medical Press Limited. The full terms of this license are available at https://www.dovepress.com/terms.php and incorporate the Creative Commons Attribution - Non Commercial (unported, v3.0) License.
By accessing the work you hereby accept the Terms. Non-commercial uses of the work are permitted without any further permission from Dove Medical Press Limited, provided the work is properly attributed. For permission for commercial use of this work, please see paragraphs 4.2 and 5 of our Terms.
© 2023 The Author(s). This work is published and licensed by Dove Medical Press Limited. The full terms of this license are available at https://www.dovepress.com/terms.php and incorporate the Creative Commons Attribution - Non Commercial (unported, v3.0) License.
By accessing the work you hereby accept the Terms. Non-commercial uses of the work are permitted without any further permission from Dove Medical Press Limited, provided the work is properly attributed. For permission for commercial use of this work, please see paragraphs 4.2 and 5 of our Terms.