")
Back to Journals » Open Access Journal of Sports Medicine » Volume 15
Maximal Oxygen Uptake, Muscular Oxidative Capacity, and Ventilatory Threshold in Amateur Triathletes: Eight-Month Training Follow-Up
Authors Assis MGC, Barbosa Junior JGG, Seffrin A, Ribeiro dos Anjos Souza V, Vivan L, Matos Rodrigues MA, de Lira CAB , Vancini RL , Knechtle B , Weiss K, Andrade MS
Received 23 December 2023
Accepted for publication 11 March 2024
Published 15 March 2024 Volume 2024:15 Pages 9—17
DOI https://doi.org/10.2147/OAJSM.S453875
Checked for plagiarism Yes
Review by Single anonymous peer review
Peer reviewer comments 2
Editor who approved publication: Prof. Dr. Andreas Imhoff
Mateus Guilherme Calixto Assis,1 José Geraldo Gomes Barbosa Junior,2 Aldo Seffrin,2 Vinícius Ribeiro dos Anjos Souza,2 Lavínia Vivan,2 Mila Alves Matos Rodrigues,3 Claudio André Barbosa de Lira,3 Rodrigo Luiz Vancini,4 Beat Knechtle,5 Katja Weiss,5 Marilia Santos Andrade6
1Department of Orthopedics and Traumatology, Federal University of São Paulo, São Paulo, Brazil; 2Postgraduate Program in Translation Medicine, Federal University of São Paulo, São Paulo, Brazil; 3Human and Exercise Physiology Division, Federal University of Goiás, Goiás, Brazil; 4Center for Physical Education and Sports, Federal University of Espírito Santo, Espírito Santo, Brazil; 5Institute of Primary Care, University of Zurich, Zurich, Switzerland; 6Department of Physiology, Federal University of São Paulo, São Paulo, Brazil
Correspondence: Beat Knechtle, Medbase St. Gallen Am Vadianplatz, Vadianstrasse 26, St. Gallen, 9001, Switzerland, Tel +41 (0) 71 226 93 00, Fax +41 (0) 71 226 93 01, Email [email protected]
Purpose: Endurance sports performance is influenced by several factors, including maximal oxygen uptake (⩒O2max), the percentage of ⩒O2max that can be sustained in endurance events, running economy, and body composition. Traditionally, ⩒O2max can be measured as an absolute value, adjusted for body mass, reflecting the athlete’s central capacity (maximal cardiac output), or adjusted for lean mass (LM), reflecting the athlete’s peripheral capacity (muscular oxidative capacity). The present study aims to evaluate absolute, total body mass, and lower limb LM-adjusted ⩒O2max, ventilatory thresholds (VT), respiratory compensation points (RCP), and body composition during two training periods separated by 8 months.
Patients and Methods: Thirteen competitive amateur triathletes [seven men (40.7± 13.7 years old, 76.3± 8.3kg, and 173.9± 4.8cm) and six women (43.5± 6.9 years old, 55.0± 2.7kg, 164.9± 5.2cm)] were evaluated for body composition with dual-energy X-ray absorptiometry and ⩒O2max, VT, RPC, and maximal aerobic speed (MAS) with a cardiorespiratory maximal treadmill test.
Results: The absolute ⩒O2max (p = 0.003, d = 1.05), body mass–adjusted ⩒O2max (p < 0.001, d = 1.2859), and MAS (p = 0.047, d = 0.6139) values differed significantly across evaluation periods. Lower limb LM–adjusted ⩒O2max (p = 0.083, d = − 0.0418), %⩒O2max at VT (p = 0.541, d = − 0.1746), speed at VT (p = 0.337, d = − 0.2774), % ⩒O2max at RCP (p = 0.776, d = 0.0806), and speed at RCP (p = 0.436, d = 0.2234) showed no difference.
Conclusion: The sensitivities of ⩒O2max adjusted for body mass and ⩒O2max adjusted for LM to detect changes in physical training state differ. Furthermore, decreases in physical fitness level, as evaluated by ⩒O2max values, are not accompanied by changes in VT.
Keywords: amateur triathletes, skeletal muscle oxidative capacity, triathlon, performance
Introduction
Endurance sports performance is determined by maximal oxygen uptake (⩒O2max), the percentage of ⩒O2max that can be sustained, and running economy.1 Given the importance of ⩒O2max and its association with endurance performance,2 it has become one of the most investigated variables in exercise physiology. The absolute oxygen uptake rate per unit of time (L·min−1) is measured as ⩒O2max. However, adjusting for total body mass is recommended when demonstrating cardiorespiratory fitness and comparing individuals.3 Elite endurance athletes may present more than 80 mL·min−1·kg−1 and patients with cardiovascular disease less than 20 mL·min−1·kg−1 values for ⩒O2max.3 In this context, the effects of training have been commonly assessed by ⩒O2max adjusted to total body mass.4 Although ⩒O2max is dependent on the integrated functioning of the respiratory, cardiovascular, and skeletal muscle systems at maximal exercise intensity,5 there is a consensus that the main limiting factor for ⩒O2max in healthy individuals is the maximum cardiac output, not the pulmonary or muscular skeletal systems.6
Maximal oxygen uptake can also be adjusted based on skeletal muscle mass, and researchers have also investigated this measurement in endurance-trained athletes once it reflects different physiological characteristics.3 Skeletal muscle mass adjusted ⩒O2max represents the muscle’s ability to consume oxygen, often known as “aerobic muscle quality”.3 While absolute and body mass–adjusted ⩒O2max are primarily limited by central conditions (maximum cardiac output), LM adjusted ⩒O2max is limited mainly by peripheral conditions (skeletal muscle mass characteristics), and both variables can be used to demonstrate training or detraining effects. Moreover, the percentage of ⩒O2max that can be sustained also has been considered an important determinant factor of endurance performance. As with LM adjusted ⩒O2max, the percentage of ⩒O2max that may be sustained is primarily limited by adaptations in skeletal muscles caused by aerobic exercise training.7
Determining whether performance measures (such as absolute, adjusted ⩒O2max, and the percentage of ⩒O2max that can be sustained) are similarly sensitive to identifying changes in training status might help coaches evaluate athletes and use these indices for exercise prescription. However, to the best of our knowledge, no previous studies have examined the changes in these variables between two different periods of training periodization over a long period. Therefore, the present study aims to evaluate absolute, total body mass and lower limb LM adjusted⩒O2max, ventilatory thresholds (percentage of ⩒O2max that can be sustained during endurance exercise), and body composition between two training periods separated by 8 months. We hypothesize that when different physiological factors influence each of these variables, the sensitivity in identifying changes in training status will not be equal for ⩒O2max values adjusted for absolute body mass (BM) and lower limb LM (LLLM).
Materials and Methods
Participants
Amateur triathletes of both sexes, between the ages of 26 and 60 participated in the study. They were recruited to participate in this study via social media (WhatsApp and Instagram). The inclusion criteria were age from 18 to 60 years old, at least 2 years of experience in the modality (triathlon), and no medical restrictions to maximal effort. Exclusion criteria included having to take a 30-day break from training, had underlying cardiovascular, respiratory, or muscular health conditions, suffered from acute musculoskeletal injuries, were pregnant, and failed to undergo laboratory testing for any reason. The initial evaluation tests were performed by 40 athletes in March 2022. The second evaluation occurs in November 2022, 1 month after the target race (at the end of September or beginning of October). Fourteen participants met the inclusion criteria and returned for retests. The most common reasons for follow-up losses were acute injury (n = 4), unavailability (n = 2), personal reasons (n = 5), no response after contact (n = 13), and a change in contact number (n = 2). After data collection, one participant was excluded from the study due to inconsistencies in cardiac monitoring, leaving 13 final participants from 26 to 60 years old, seven males (40.7±13.7 years old, 76.3±8.3kg, 173.9±4.8cm) and six females (43.5±6.9 years old, 55.0±2.7kg, 164.9±5.2cm) (Figure 1). There were no participants with less than 12 months of triathlon experience, 15.4% (n = 2) with 12 to less than 24 months, 23.1% (n = 3) with 24 to less than 36 months, and 61.5% (n = 8) with more than 36 months. All the participants were involved with resistance and triathlon training.
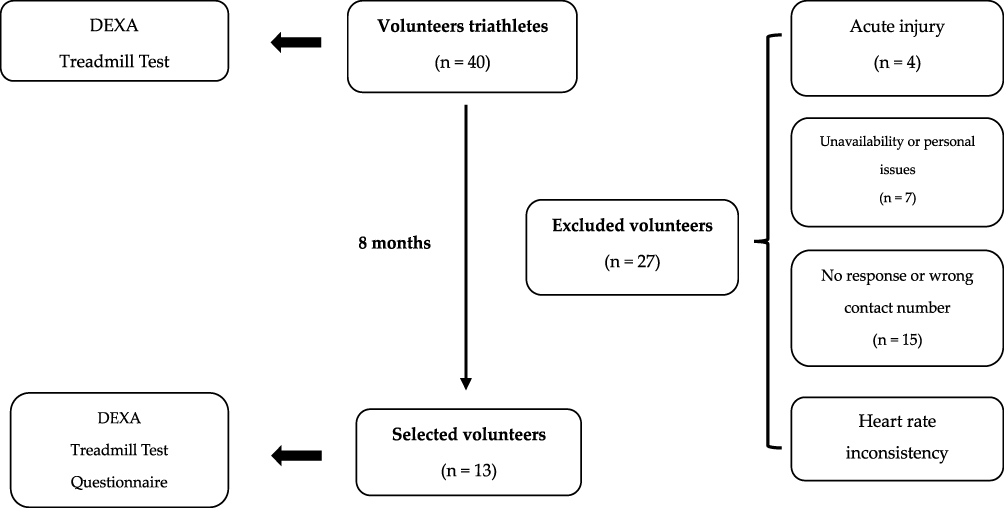 |
Figure 1 Study flowchart. |
In terms of swimming, 53.8% (n = 7) trained 1 to <3 h/week, 46.1% (n = 6) 3 to <5 h/week, and nobody trained 5 to <7 h/week or more. In terms of cycling training, none trained 1 to <4 h/week, 46.1% (n = 6) 4 to <7 h/week, 53.8% (n = 7) 7 to <9 h/week, and nobody trained more than 9 h/week. According to Table 1, in terms of running, 61.5% (n = 8) trained 1 to <4 h/week, 38.4% (n = 5) 4 to <7 h/week, 53.8% (n = 7) 7 to <9 h/week, and nobody trained more than 9 h/week. All the participants were training for long-distance triathlon races during the period (Half or Full Ironman distance, that is 3800 swimming, 180km cycling, and 42 running).
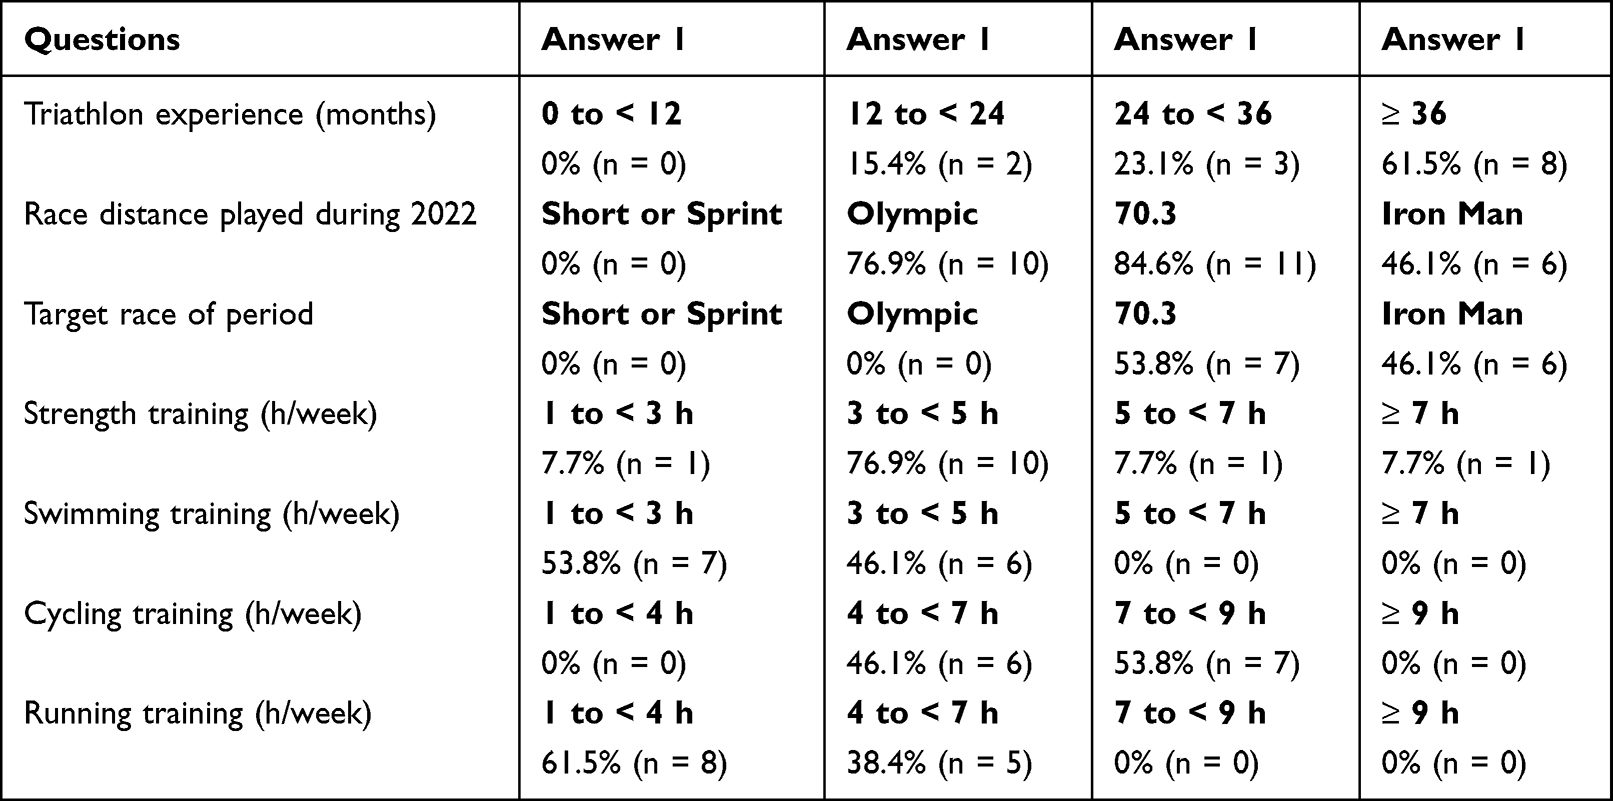 |
Table 1 Characteristics of the Participants |
Experimental Procedures
This was a longitudinal and observational study of amateur triathletes. The study adhered to the Declaration of Helsinki and the Recommendations for the Conduct, Reporting, Editing, and Publication of Scholarly Work in Medical Journals. The study was approved by the Human Ethics Committee of the University Federal of São Paulo-UNIFESP (approval number 5.059.538 on October 25, 2021). Participants were informed about the research objectives, proposed physiological laboratory tests, and associated risks and benefits, with the researchers ensuring that principles of respect, privacy, confidentiality, and anonymity were preserved. Informed consent forms were obtained from all participants. Following that, the participants proceeded to the UNIFESP Exercise Physiology Laboratory twice to have their height, BM, and body composition measured. The participants were then subjected to a maximal treadmill test to determine their cardiorespiratory function. They were instructed not to engage in strenuous physical activity within 24 h of the test and not to consume stimulating foods, such as coffee, on the test day. Additionally, the researchers recommended that participants wear comfortable running shoes and lightweight clothing for the test.
The participants were evaluated twice at different times. The first evaluation occurred during the pre-competition period (March 2022), and the second occurred after the target race period (November 2022) for each participant, with an average interval of 8.7 ± 0.5 months. A retrospective questionnaire was included during the second evaluation to collect retrospective information on training, race participation, and health status between the two assessments.
Questionnaire
During the second assessment, a retrospective questionnaire was administered, which included targeted questions about the duration of triathlon participation, the number and length of races completed, the primary/target race (and its distance) during the period, and the amount of time spent each week on swimming, cycling, and running exercises. Participants were also asked about any withdrawal from athletics, underlying health conditions, or medication use between evaluations (Annex 1). A response summary is presented in Table 1.
Body Composition and Anthropometry
Body mass and height were measured with a precision of 0.1 kg and 0.1 cm, respectively, using a calibrated stadiometer Filizola® PL (Filizola, São Paulo, Brazil). Body composition (fat-free and fat mass) was evaluated using the dual-energy X-ray absorptiometry (DXA, software version 12.3, Lunar DPX, Wisconsin, USA). This method provides a rapid and non-invasive assessment of fat (FM) and fat-free mass with low radiation exposure and is a reference method in clinical research for determining body composition.8,9 Tests were performed with the participants in a supine position, wearing comfortable clothing, with no metal objects, centrally aligned with 10 cm between the feet and 5 cm between the hands and trunk, and performed after bladder emptying.10 The DXA was calibrated before each test according to the manufacturer’s instructions.
Cardiorespiratory Maximal Treadmill Test
A cardiorespiratory maximal treadmill test (Inbrasport, ATL, Porto Alegre, Brazil) was performed by the participants. A computer-based system for analyzing breath-based gas exchange (Quark, Comed, Italy) was used to determine ⩒O2max, VT, RCP. This equipment presents a good accuracy.11 The metabolic analyzer was calibrated before each test using the manufacturer’s recommended procedures. On the day of the tests, participants were encouraged to avoid vigorous exercise, coffee, or stimulating foods. All the tests were performed during the morning period, by an experienced physician under the supervision of the principal investigator who has over 20 years of experience in cardiorespiratory maximal treadmill test, at room temperature of 20 ± 2°C and relative air humidity between 50% and 70%.12
The test began with a 3-min warm-up period at 8 km/h, followed by 1-min increments of 1 km/h until voluntary exhaustion was reached. The total test duration for all participants ranged from 8 to 12 min. To simulate the challenges of outdoor running, the treadmill was kept at 1% inclination throughout the test.13 Each stage ended with the Borg Rating of Perceived Exertion14 applied, and the heart rate (HR) was monitored using a HR monitor (Ambit 2S, Suunto, Finland).
The oxygen uptake (⩒O2), carbon dioxide production (⩒CO2), oxygen end-tidal pressure (PETO2), carbon dioxide pressure (PETCO2), and minute ventilation (⩒E) were measured breath by breath. Data averages were calculated at 20-s intervals. The ⩒O2max was defined as the point at which oxygen consumption stabilized (or increased by less than 2.1 mL·min−1·kg −1) even while the treadmill speed was increased.15 VT and RCP were identified using the O2 and CO2 ventilatory equivalents (⩒E/⩒O2 and ⩒E/⩒CO2) and PETO2 and PETCO2 by two independent investigators.16 Speed and the ⩒O2max percentage were calculated at VT and RCP. The maximal aerobic speed (MAS) was measured and defined as the lowest exercise intensity resulting in ⩒O2max.
Statistical Analysis
The sample size was calculated using the G*Power version 3.1.9.7 (Franz, Universität Kiel, Germany). A total sample size of 15 individuals was determined for an effect size of 0.7, type I error of 5%, and type II error of 20%. Data were presented as the mean and standard deviation. All variables exhibited a normal distribution and homogeneous variability, according to Shapiro–Wilk and Levene’s tests. To compare the mean values between evaluation moments, a Student’s t test for paired samples was performed. The analysis was performed using the Jamovi Project (Version 2.3, Sydney, Australia, 2022).
The analysis considered mean values, standard deviations, and effect sizes (Cohen’s d). We calculated the variable mean difference divided by the pooled standard deviation to measure the effect size for mean differences between first and second evaluation, and the thresholds of 0.2, 0.3, 0.5, 0.7, and 0.9 for small, moderate, large, very large, and extremely large were used.17 The significance level was set at p < 0.05.
Results
In the initial evaluation, participants in the present study showed significantly higher values for ⩒O2max (L·min−1; p = 0.003, d = 1.05), BM-adjusted ⩒O2max (mL·min−1·kg BM−1; p < 0.001, d = 1.2859), and MAS (km·h−1; p = 0.047, d = 0.6139) than in the second evaluation. In contrast, no difference between tests was observed for ⩒O2max adjusted for LLLM (mL·min−1·kg LLLM−1; p = 0.083, d = −0.0418), VT %⩒O2max (p = 0.541, d = −0.1746), VT speed (km·h−1; p = 0.337, d = −0.2774), RCP % ⩒O2max (p = 0.776, d = −0.0806), and RCP speed (km·h−1; p = 0.436, d = 0.2234; Table 2).
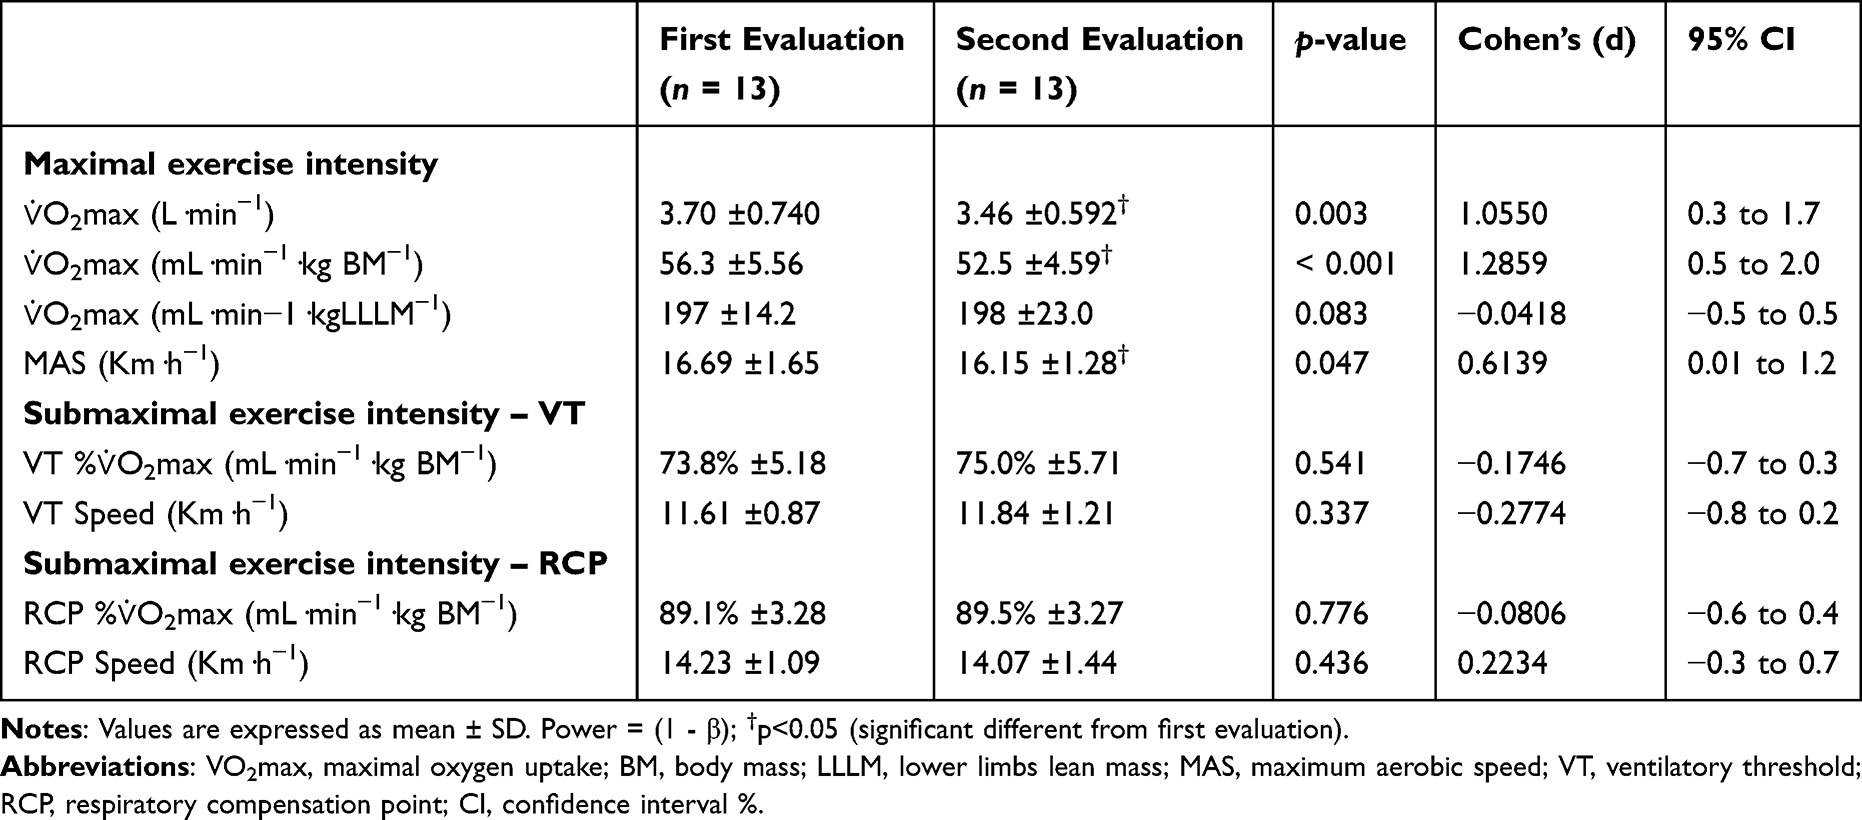 |
Table 2 Physiological Characteristics of the Participants |
Furthermore, BM (p = 0.820, d = 0.0644), total LM (TLM; p = 0.568, d = −0.1630), and FM (p = 0.173, d = −0.4018) did not differ significantly between the two moments, with the exception of LLLM, which was lower in the second evaluation (p = 0.045, d = 0.6199; Table 3).
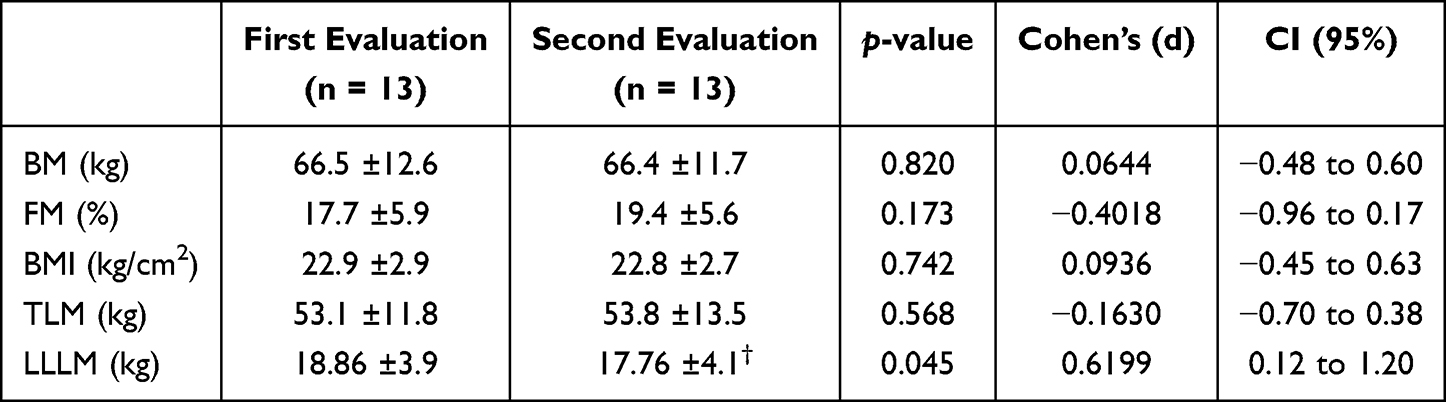 |
Table 3 Body Composition Characteristics of Participants |
Discussion
The main results of the present study were as follows: (a) absolute ⩒O2max and BM-adjusted ⩒O2max were significantly higher in the first evaluation, (b) LLLM adjusted ⩒O2max did not change between the two evaluations, (c) speed and ⩒O2max percentage assessed at VT and RCP were not different between the two evaluation moments, and (d) FM (%) and TLM (kg) did not differ between the two evaluation moments. Therefore, the initial hypothesis of the study was confirmed as the different forms of ⩒O2max expression presented different sensibilities to detect changes in training status.
The first important finding of the present study was that absolute ⩒O2max and BM-adjusted ⩒O2max were significantly higher in the first evaluation than in the second. Therefore, these two variables were sensitive enough to detect different levels of training. It is important to note that the second evaluation was performed 1 month after the target race (at the end of September or beginning of October), when the training volumes and intensities decreased significantly. Therefore, these results are expected, because it is reasonable to assume that participants were in a detraining period.
Traditionally, ⩒O2max has been defined as the highest rate at which oxygen can be taken in by the lungs, transported by the blood, and used by the muscles during whole-body activity, such as cycling or running.5 Even though various physiological factors, such as pulmonary diffusing capacity, ventilatory capacity, maximal cardiac output, blood oxygen carrying capacity, and skeletal muscle capacity to consume oxygen, can limit ⩒O2max, there are several reasons to believe that the most important limiting factors are those associated with maximal cardiac output.18,19 Pulmonary variables were excluded because the average individual does not have arterial oxygen desaturation even at maximal exercise intensity.18,19 Furthermore, the possibility of skeletal muscle limitation as a restricting factor for ⩒O2max was dismissed. This is because enhancing the oxygen supply to the active muscle mass, for instance, through higher inspired oxygen levels or blood doping, increases ⩒O2max.
As a result, the observed changes relative to the absolute and BM-adjusted ⩒O2max represent a lower central capacity to maintain the previous maximal cardiac output. This sensitivity of absolute and BM-adjusted ⩒O2max in identifying training differences is consistent with previous literature findings. It has previously been proven that increasing training has a positive effect, with overall aerobic capacity increasing by approximately 0.4 ± 0.2 L·min−1after a training period.20 These findings support using absolute and BM-adjusted ⩒O2max values to demonstrate training status change.
Similarly, the MAS was also lower in the second evaluation than in the first, and one more time, it is important to remember that the second evaluation was performed 1 month after the target race, and when the training volumes and intensities have dropped. MAS is known to directly correlate with ⩒O2max and is an important predictor of an athlete’s performance, which performs even better than ⩒O2max in some race distances, such as Olympic distance.2 The reduction in absolute and BM-adjusted ⩒O2max during the second evaluation might be attributed to the decrease in MAS.
However, in addition to physiological differences, the results may also have been influenced by the fact that both sexes were analyzed together, and it has been previously demonstrated that the effects of resistance training on muscular function, and the effects of endurance training on ⩒O2max were larger in males compared with female sex.21,22 In the same direction, the age varied considerably for the participants included in the present study and it is very likely this factor can contribute to training response, despite more studies should be done to verify this hypothesis.23
Regarding, LLLM-adjusted ⩒O2max did not change during the same follow-up period. As shown in the present results, it has previously been demonstrated that there is no significant difference in LM-adjusted ⩒O2max in a 1-yr training cycle for endurance or sprint athletes3. The lower limb lean mass-adjusted ⩒O2max has been claimed to reflect the ability of the muscle mass to consume oxygen and is used as an index of “aerobic muscle quality”, referring to the amount of oxygen consumed per kilogram of muscle mass.3,7
Despite changes in training status, aerobic muscle quality did not change over the present study’s follow-up period. However, this discovery should be interpreted alongside the conclusion that while this variable signifies oxygen extraction by muscle mass, it might not represent the utmost extraction capacity but rather the extraction evaluated during maximum exercise. There is a wide range of reported values for LM-adjusted ⩒O2max, ranging from less than 100 to more than 700 mL·min−1·kg−1.24–27 The amount of muscle mass engaged in physical activity is one of the main reasons for this wide variation.28 Physical activities involving small muscle mass provide greater LM-adjusted ⩒O2max than full body dynamic exercises. This is because, as previously stated, the absolute ⩒O2max values are limited in most participants by cardiac output rather than skeletal muscle oxygen extraction capacity. Therefore, if a small muscle mass performs an activity, oxygen delivery to the active muscles can increase oxygen muscular extraction and, consequently, the LM-adjusted ⩒O2max values. However, this variable has received far less attention than the absolute or BM-adjusted ⩒O2max, and more studies presenting accurate, reliable, and precise methods to estimate muscle mass and oxygen uptake should be conducted to confirm this hypothesis.
Despite the significant decrease in ⩒O2max values, there was no significant difference in the ventilatory thresholds. Similarly, there was no difference between the two evaluations in the speed observed at ventilatory thresholds.29 Ventilatory thresholds are mainly influenced by peripheral adaptations to training stimuli, with little contribution from central aspects.5,30 Furthermore, the operating economy affects the ventilatory thresholds.31 Therefore, these results support the hypothesis that research participants could sustain peripheral adaptations to training stimulus despite a decrease in absolute and BM-adjusted ⩒O2max.
As shown in Table 3, there were no statistically significant differences in BM, TLM (kg), or FM (%) between the two evaluation time points. Anthropometric data (ie, body fat, abdominal circumference, BM, body mass index, and LM) are well-known to be associated with performance in endurance athletes of both sexes.32,33 BM was associated with the final race time34 and marathon split35 in male triathletes competing over long distances (Ironman).
It has been demonstrated that among Olympic-distance amateur triathletes, LM for female athletes and FM for male athletes are important variables that comprise predictive performance regression equations.33 Therefore, the nonsignificant differences observed between the two moments for anthropometric variables indicate that these variables have a minimal impact on the other determinants of performance evaluated throughout the season, which changed significantly, such as absolute, BM-adjusted ⩒O2max and MAS, indicating that there are independent factors associated with performance.
Limitations
The volume and intensity of training were not managed, which can be considered a bias of the study. However, it is important to note that all the athletes were preparing for long-distance races, such as the Ironman (3.8 km swimming, 180 km cycling, and 42 km running) or the 70.3 Ironman (1.9 km swimming, 90 km cycling, and 21 km running) by the same coach using the same training methodology, which may mitigate this possible bias. Second, the large range of age among participants from both sexes can also be a bias of the study. Third, caution should be taken in interpreting the results of no significant difference between means, once the sample size evaluated in the present study was not large. Therefore, to clarify this issue, the authors suggest that future researchers should be performed considering male and female athletes separately and studying a larger sample size with a smaller range of age.
Conversely, a strength of the study is that all athletes took both assessments in the same phase of training, the first evaluation during the pre-season and the second evaluation approximately 30 days after the year’s target competition.
Conclusion
In conclusion, absolute or total body mass adjusted ⩒O2max are sensitive measures to identify physical training status changes among amateur triathletes. However, lower limb lean mass adjusted ⩒O2max was not able to identify changes in physical training status. Therefore, coaches and athletes aiming to verify the endurance training effects on ⩒O2max should prefer to look for absolute or total body mass adjusted ⩒O2max instead of lower limb lean mass adjusted ⩒O2max.
Data Sharing Statement
Data supporting the reported results can be requested from the corresponding author.
Institutional Review Board Statement
The study was conducted in accordance with the Declaration of Helsinki and approved by the Institutional Review Board of UNIFESP (protocol code 5.059.538).
Informed Consent Statement
Informed consent was obtained from all subjects involved in the study.
Acknowledgments
We would like to thank all of the participants who volunteered their time to participate in the study, the Olympic Training and Research Center (Centro Olímpico de Treinamento e Pesquisa, COTP, São Paulo, Brazil), the Medicina Translacional post-graduation program, UNIFESP, Brazil, and the Sports Medicine Residency Program (Department of Orthopedics and Traumatology, Federal University of São Paulo, São Paulo, Brazil).
Author Contributions
All authors made a significant contribution to the work reported, whether that is in the conception, study design, execution, acquisition of data, analysis and interpretation, or in all these areas; took part in drafting, revising, or critically reviewing the article; gave final approval of the version to be published; have agreed on the journal to which the article has been submitted; and agree to be accountable for all aspects of the work.
Funding
This research was funded by FAPESP, grant number 2021/08114-1.
Disclosure
The authors declare no conflicts of interest in this work.
References
1. Shaw AJ, Ingham SA, Atkinson G, Folland JP. The correlation between running economy and maximal oxygen uptake: cross-sectional and longitudinal relationships in highly trained distance runners. PLoS One. 2015;10(4):e0123101. doi:10.1371/JOURNAL.PONE.0123101
2. Puccinelli PJ, Lima GHO, Pesquero JB, et al. Previous experience, aerobic capacity and body composition are the best predictors for Olympic distance triathlon performance: predictors in amateur triathlon. Physiol Behav. 2020;225:113110. doi:10.1016/J.PHYSBEH.2020.113110
3. Trinschek J, Zieliński J, Kusy K. Maximal oxygen uptake adjusted for skeletal muscle mass in competitive speed-power and endurance male athletes: changes in a one-year training cycle. Int J Environ Res Public Health. 2020;17(17):1–13. doi:10.3390/ijerph17176226
4. Burtscher M. Exercise limitations by the oxygen delivery and utilization systems in aging and disease: coordinated adaptation and deadaptation of the lung-heart muscle axis - a mini-review. Gerontology. 2013;59(4):289–296. doi:10.1159/000343990
5. Bassett DR, Howley ET. Limiting Factors for Maximum Oxygen Uptake and Determinants of Endurance Performance. Int J Med. 2000;32(1):70–84. doi:10.1097/00005768-200001000-00012
6. Ranković G, Mutavdžić V, Toskić D, et al. Aerobic capacity as an indicator in different kinds of sports. Bosn J Basic Med Sci. 2010;10(1):44–48. doi:10.17305/BJBMS.2010.2734
7. Beekley MD, Abe T, Kondo M, Midorikawa T, Yamauchi T. Comparison Of Normalized Maximum Aerobic Capacity And Body Composition Of Sumo Wrestlers To Athletes In Combat And Other Sports. J Sports Sci Med. 2006;5(CSSI).
8. Choi YJ, Seo YK, Lee EJ, Chung YS. Quantification of visceral fat using dual-energy x-ray absorptiometry and its reliability according to the amount of visceral fat in Korean Adults. J Clin Densitom. 2015;18(2):192–197. doi:10.1016/j.jocd.2015.02.001
9. Borga M, West J, Bell JD, et al. Advanced body composition assessment: from body mass index to body composition profiling. J Invest Med. 2018;66(5):887–895. doi:10.1136/jim-2018-000722
10. Sanfilippo J, Krueger D, Heiderscheit B, Binkley N. Dual-Energy X-Ray Absorptiometry Body Composition in NCAA Division I Athletes: exploration of Mass Distribution. Sports Health. 2019;11(5):453–460. doi:10.1177/1941738119861572
11. Van Hooren B, Souren T, Bongers BC. Accuracy of respiratory gas variables, substrate, and energy use from 15 CPET systems during simulated and human exercise. Scand J Med Sci Sports. 2024;34(1):e14490. doi:10.1111/sms.14490
12. Coordenador N, Ilha J, Editores G, et al. Normatização de técnicas e equipamentos para realização de exames em ergometria e ergoespirometria. Arq Bras Cardiol. 2003;80(4):457–464. doi:10.1590/S0066-782X2003000400011
13. Jones AM, Doust JH. A 1% treadmill grade most accurately reflects the energetic cost of outdoor running. J Sports Sci. 1996;14(4):321–327. doi:10.1080/02640419608727717
14. Borg G. Borg ́s Perceived Exertion and Pain Scales. Champaign: Human Kinetics; 1998.
15. Molinari CA, Edwards J, Billat V. Maximal Time Spent at VO2max from Sprint to the Marathon. Int J Environ Res Public Health. 2020;17(24):1–11. doi:10.3390/IJERPH17249250
16. Whipp BJ, Ward SA, Wasserman K. Respiratory markers of the anaerobic threshold. Adv Cardiol. 1986;35:47–64. doi:10.1159/000413438
17. Hopkins WG, Marshall SW, Batterham AM, Hanin J. Progressive statistics for studies in sports medicine and exercise science. Med Sci Sports Exerc. 2009;41(1):3–12. doi:10.1249/MSS.0B013E31818CB278
18. Bassett DR, Howley ET. Maximal oxygen uptake: “classical” versus “contemporary” viewpoints. Med Sci Sports Exerc. 2000;32(1):85–88. doi:10.1097/00005768-200001000-00013
19. Saltin B, Strange S. Maximal oxygen uptake: “old” and “new” arguments for a cardiovascular limitation. Med Sci Sports Exerc. 1992;24(1):30–37.
20. Bouchard C, Sarzynski MA, Rice TK, et al. Genomic predictors of the maximal O2 uptake response to standardized exercise training programs. J Appl Physiol. 2011;110(5):1160–1170. doi:10.1152/JAPPLPHYSIOL.00973.2010
21. Diaz-Canestro C, Montero D. Sex Dimorphism of VO2max Trainability: a Systematic Review and Meta-analysis. Sports Med. 2019;49(12):1949–1956. doi:10.1007/S40279-019-01180-Z
22. Noh KW, Park S. Effects of resistance training and protein supplementation interventions on muscle volume and muscle function: sex differences in humans. Phys Act Nutr. 2023;27(4):15. doi:10.20463/PAN.2023.0033
23. Williams CJ, Gurd BJ, Bonafiglia JT, et al. A Multi-Center Comparison of O2peak Trainability Between Interval Training and Moderate Intensity Continuous Training. Front Physiol. 2019;1(5):10–19. doi:10.3389/FPHYS.2019.00019
24. Neder JA, Nery LE, Silva AC, Andreoni S, Whipp BJ. Maximal aerobic power and leg muscle mass and strength related to age in non-athletic males and females. Eur J Appl Physiol Occup Physiol. 1999;79(6):522–530. doi:10.1007/S004210050547
25. Proctor DN, Joyner MJ. Skeletal muscle mass and the reduction of VO2max in trained older subjects. J Appl Physiol. 1997;82(5):1411–1415. doi:10.1152/JAPPL.1997.82.5.1411
26. Richardson RS, Saltin B. Human muscle blood flow and metabolism studied in the isolated quadriceps muscles. Med Sci Sports Exerc. 1998;30(1):28–33. doi:10.1097/00005768-199801000-00005
27. Shephard RJ. Maximal oxygen intake and Independence in old age. Br J Sports Med. 2009;43(5):342–346. doi:10.1136/BJSM.2007.044800
28. Sanada K, Kearns CF, Kojima K, Abe T. Peak oxygen uptake during running and arm cranking normalized to total and regional skeletal muscle mass measured by magnetic resonance imaging. Eur J Appl Physiol. 2005;93(5–6):687–693. doi:10.1007/S00421-004-1250-Y
29. Yoshida T, Chida M, Ichioka M, Suda Y. Blood lactate parameters related to aerobic capacity and endurance performance. Eur J Appl Physiol Occup Physiol. 1987;56(1):7–11. doi:10.1007/BF00696368
30. Joyner MJ. Physiological limits to endurance exercise performance: influence of sex. Journal of Physiology. 2017;595:2949–2954. doi:10.1113/JP272268
31. Støa EM, Helgerud J, Rønnestad BR, Hansen J, Ellefsen S, Støren Ø. Factors Influencing Running Velocity at Lactate Threshold in Male and Female Runners at Different Levels of Performance. Front Physiol. 2020;11:585267. doi:10.3389/FPHYS.2020.585267
32. Knechtle B. Relationship of Anthropometric and Training Characteristics with Race Performance in Endurance and Ultra-Endurance Athletes. Asian J Sports Med. 2014;5(2):73.
33. Barbosa JG, de Lira CAB, Vancini RL, et al. Physiological Features of Olympic-Distance Amateur Triathletes, as Well as Their Associations with Performance in Women and Men: a Cross-Sectional Study. Healthcare. 2023;11(4):622. doi:10.3390/HEALTHCARE11040622
34. Rüst CA, Knechtle B, Wirth A, et al. Personal best times in an Olympic distance triathlon and a marathon predict an Ironman race time for recreational female triathletes. Chin J Physiol. 2012;55(3):156–162. doi:10.4077/CJP.2012.BAA014
35. Knechtle B, Wirth A, Rüst CA, Rosemann T. The Relationship between Anthropometry and Split Performance in Recreational Male Ironman Triathletes. Asian J Sports Med. 2011;2(1):23–30. doi:10.5812/ASJSM.34823
 © 2024 The Author(s). This work is published and licensed by Dove Medical Press Limited. The full terms of this license are available at https://www.dovepress.com/terms.php and incorporate the Creative Commons Attribution - Non Commercial (unported, v3.0) License.
By accessing the work you hereby accept the Terms. Non-commercial uses of the work are permitted without any further permission from Dove Medical Press Limited, provided the work is properly attributed. For permission for commercial use of this work, please see paragraphs 4.2 and 5 of our Terms.
© 2024 The Author(s). This work is published and licensed by Dove Medical Press Limited. The full terms of this license are available at https://www.dovepress.com/terms.php and incorporate the Creative Commons Attribution - Non Commercial (unported, v3.0) License.
By accessing the work you hereby accept the Terms. Non-commercial uses of the work are permitted without any further permission from Dove Medical Press Limited, provided the work is properly attributed. For permission for commercial use of this work, please see paragraphs 4.2 and 5 of our Terms.