")
Back to Journals » Clinical Interventions in Aging » Volume 17
Prediction of Prognosis in Geriatric Palliative Care Patients with Diagnosed Malnutrition: A Comparison of Nutritional Assessment Parameters
Received 7 July 2022
Accepted for publication 14 December 2022
Published 28 December 2022 Volume 2022:17 Pages 1893—1900
DOI https://doi.org/10.2147/CIA.S380536
Checked for plagiarism Yes
Review by Single anonymous peer review
Peer reviewer comments 2
Editor who approved publication: Prof. Dr. Nandu Goswami
Özlem Deligöz, Osman Ekinci
University of Health Sciences, Haydarpaşa Numune Training and Research Hospital, Istanbul, Turkey
Correspondence: Özlem Deligöz, University of Health Sciences, Haydarpaşa Numune Training and Research Hospital, Istanbul, Turkey, Email [email protected]
Objective: Malnutrition is very commonly encountered in palliative care centers (PCC), especially in geriatric patients. It is known that development of malnutrition increases morbidity and mortality. In this study, we aimed to investigate the effectiveness of commonly used nutritional assessment parameters in predicting prognosis in geriatric patients diagnosed in PCC with malnutrition.
Methods: Our study included 1451 patients aged ≥ 65 years, who were diagnosed with malnutrition in PCC between 2016– 2020 and did not yet start receiving nutritional support. Demographic data, comorbidities, The Nutritional Risk Screening 2002 (NRS-2002), body mass index (BMI), albumin, prealbumin and C-reactive protein (CRP) values of the patients were recorded. Prognostic course was evaluated by dividing the patients into 3 groups, namely mortal patients during PCC follow-up, patients transferred from PCC to Intensive Care (ICU) and patients discharged to home from PCC.
Results: Logistic Regression analysis showed that low albumin levels affected transfer to ICU (P< 0.05). Elevated NRS-2002 and low albumin and prealbumin levels were found to be factors affecting mortality (P< 0.05). Areas under the ROC Curve were calculated to attain patients’ differential diagnosis. The area under the ROC Curve of low albumin in patients transferred to ICU was found to be significant (P< 0.05). In the differential diagnosis of patients with mortal course, the area under the ROC Curve of low albumin and prealbumin and high CRP was found to be significant (P< 0.05).
Conclusion: We found that BMI had no prognostic predictive effects in geriatric PCC patients with malnutrition. We concluded that NRS-2002 and high CRP and low albumin and prealbumin can be used to predict mortality. In addition, we found that low albumin indicates a poor prognosis and predicts patients to be transferred to ICU.
Keywords: NRS-2002, malnutrition, albumin, prealbumin, CRP, mortality
Introduction
With improving life conditions, developing technology and new treatment methods, human lifespan is getting longer. The increase in the geriatric population also leads to increased chronic diseases and related symptoms. Palliative care centers (PCC) are healthcare units which aim to increase patient quality of life by remedying these symptoms. Adequate and balanced nutrition is known to increase the quality of life.1 Malnutrition may develop in case of inadequate or unbalanced nutrition. Inadequate and unbalanced nutrition may lead to malnutrition. Malnutrition is more common in geriatric patients due to reasons such as cognitive retardation, comorbid diseases, polypharmacy, depression, and anorexia.2 The catabolic process caused by malnutrition can further increase morbidity and mortality.3 All these reasons indicate a necessity to conduct a nutritional risk assessment in hospitalized geriatric patients. These reasons demonstrate the importance of regular nutritional risk assessment, follow-up, and early treatment of malnutrition in geriatric patients treated in PCC.
The diagnosis of malnutrition is established using The Nutritional Risk Screening 2002 (NRS-2002), body mass index (BMI) measurements and biochemical blood tests such as serum albumin, prealbumin and C-reactive protein (CRP).4 Many studies emphasized that NRS-2002 is more effective in determining nutrition. The use of parameters such as BMI, albumin, prealbumin and CRP alone is controversial.5 Studies on current nutritional assessment parameters to predict prognosis in geriatric patients are not sufficient.
For this reason, in our study, we aimed to investigate the effectiveness of NRS-2002, BMI, albumin, prealbumin and CRP, which are commonly used nutritional assessment tests, in predicting prognosis in geriatric patients diagnosed with malnutrition in PCC. We believe that the use of parameters that can predict prognosis in the follow-up and treatment of geriatric patients with malnutrition will contribute to the reduction of morbidity and mortality.
Material and Methods
Study Design
We performed a retrospective study to compare the abilities of the NRS-2002, BMI, albumin, prealbumin and CRP level to predict the prognosis of patients diagnosed with malnutrition admitted to the Palliative Care department of Haydarpaşa Numune Training and Research Hospital (HNTRH), Istanbul, Turkey, between January 2016 and December 2020. This study was approved by the Ethics Committee of HNTRH (no: 59, dated: 21.03.2022). With the authorization granted by the WMA (World Medical Association) Declaration of Helsinki – Ethical Principles for Medical Research Involving Human Subjects, in the local legislation of our country, there is no obligation to submit an informed consent sample in scientific studies based on retrospective data review applied to ethics committees. Since it is not practically possible in our country to reach the patients themselves and obtain informed consent to use the medical data of patients in scientific research in studies based on retrospective data scans, these data can be used in scientific research with the decision of the local ethics committee and as anonymous information in accordance with our national legislation. In the application forms, an original signed commitment is obtained from the researchers indicating that they will use the medical information of the patients only for scientific research purposes and will not share it with others, and that they will keep the privacy and confidentiality of these data for five years in accordance with the “Good Clinical Practices Guidelines” and the “Personal Data Protection Law”.
Geriatric patients aged ≥65 years, diagnosed with malnutrition in our hospital’s PCC, were included in our study on the condition that nutritional support was not initiated when malnutrition was diagnosed. Patients aged <65 years and with a clinical history of cancer-related cachexia were excluded from the study.
Data Collection
Demographic data of the patients, age, gender, diagnosis of PCC hospitalization, comorbidities, height, weight and NRS-2002 values of the day of malnutrition diagnosis were recorded. During follow-up, BMI was calculated for each patient diagnosed with malnutrition. Albumin, prealbumin and CRP parameters were checked. Consequently, appropriate nutritional support was started. Additional patient information and desired laboratory results were acquired from HNTRH’s hospital information system. Patients were divided into 3 groups as those who were mortal during PCC follow-up, those who were transferred from PCC to Intensive Care (ICU) and those who were discharged to home from PCC.
Nutritional Assessment Parameters
- NRS-2002 is a widely used, reliable and current method developed by The European Society for Clinical Nutrition and Metabolism, which is non-invasive and easy to implement, and is based only on evidence in terms of evaluating nutrition.6 In our study, the diagnosis of malnutrition was established with an NRS-2002 value of ≥3.7 Patients with a score of <3 were considered as patients with normal nutrition.
- BMI is a universal method used to assess nutritional status.8 BMI value groups are as follows: <18.5 kg/m² are underweight, 18.5–24.9 kg/m² are normal weight, 25–29.9 kg/m² are overweight, 30.0–34.9 kg/m² are in obesity class I, 35.0–39.9 kg are in obesity class II, and ≥40 kg/m² are in obesity class III.9
- Albumin is a protein which is abundant in plasma, can be easily measured, and is widely used to evaluate nutritional status.10 Patients with an albumin value of ≥3.5 g/dL are classified as normal, 3.0–3.49 g/dL as mild, 2.5–2.9 g/dL as moderate, and <2.5g/dL as severe.11
- Prealbumin is an important protein which is synthesized in the liver and carries thyroid hormones. It is used as a nutritional marker, especially during refeeding in the older patients.12 Prealbumin values of >20 mg/dL are classified as normal, 20–12 mg/dL as low, and ≤11 mg/dL as very low.13
- CRP: It can be said that inflammatory markers are important in nutritional assessment and in predicting mortality.14 The value range of 0–10 mg/L is classified as normal, the value range of 11–50 mg/L is classified as high, and values >50 mg/L are classified as very high.13
Statistical Analyses
In this study, statistical analyses were made using the NCSS (Number Cruncher Statistical System) 2007 Statistical Software (Utah, USA) package program. In the evaluation of the data, besides descriptive statistical methods (mean, standard deviation, median, interquartile range), the distribution of variables was examined using the Shapiro–Wilks Normality test. One-way analysis of variance was used for intergroup comparisons of normally distributed variables, and Tukey multiple comparison test was used for subgroup comparisons. The Kruskal Wallis test was used for the intergroup comparisons of the variables without normal distribution, Dunn’s multiple comparison test was used for subgroup comparisons, and the chi-square test was used for the comparisons of qualitative data. Logistic Regression analysis was performed to separate the factors affecting ICU transfer and mortality. For the differential diagnosis of transfer to ICU and mortality, the areas under the ROC Curve were calculated and sensitivity, specificity, positive predictive value, negative predictive value and LR (+) values and cut-off values of the variables were determined. The results were evaluated at the significance level of p<0.05.
Results
Patient Characteristics
A total of 2005 patients diagnosed with malnutrition were admitted to Palliative Care Unit in our hospital from 2016 to 2020. Of those patients, 1451 were enrolled in our study. A flowchart of the reasons for exclusion is presented in Figure 1. The characteristics of the included cohort are summarized in Tables 1 and 2.
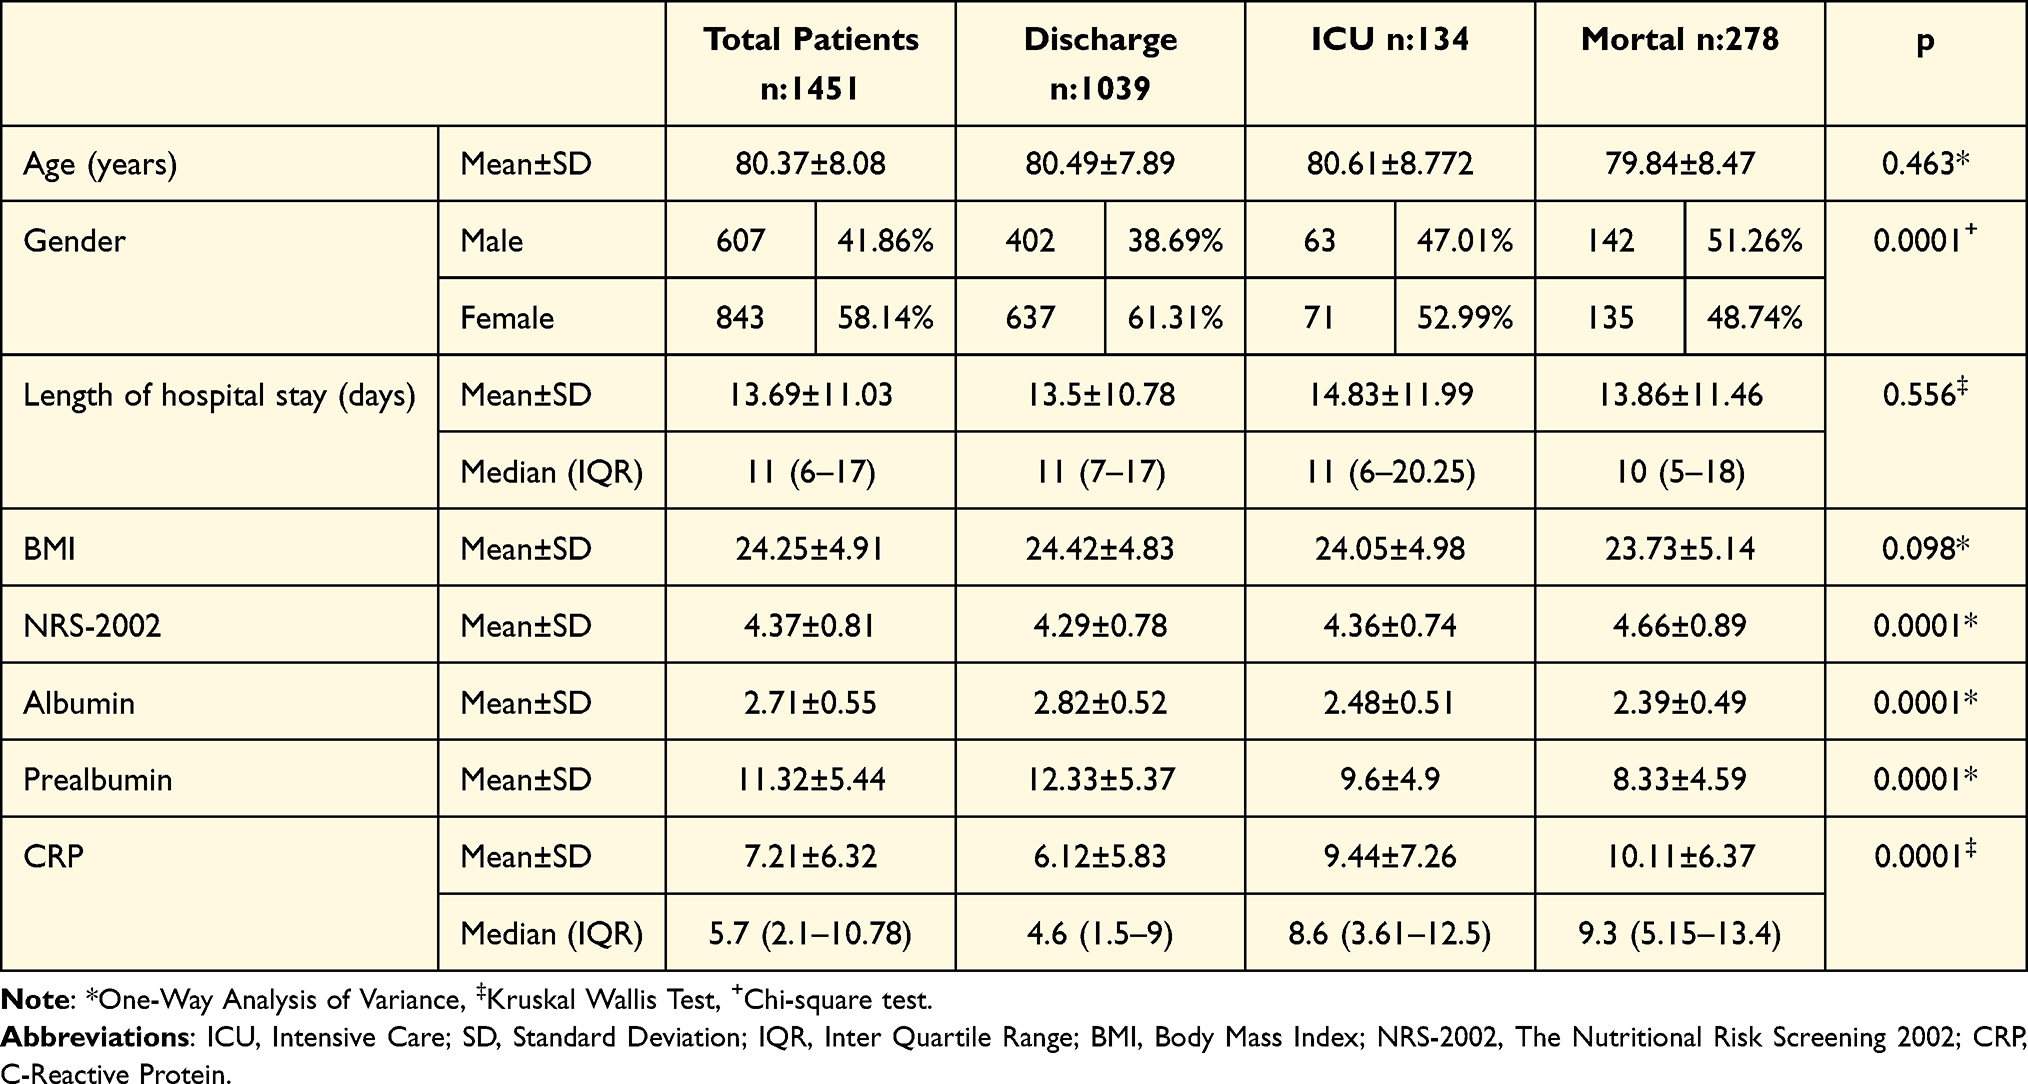 |
Table 1 Comparison of Demographic, and Laboratory Results of Prognosis Groups |
 |
Table 2 Comparison of Chronic Diseases of Prognosis Groups |
 |
Figure 1 Flowchart for the study. |
Significant differences were observed between the mean NRS-2002 (p=0.0001), albumin (p=0.0001), prealbumin (p=0.0001) and CRP (p=0.0001) in the discharge, ICU, and Mortal groups (Table 1). In the multiple comparison test, the NRS-2002 averages of the Mortal group were found to be statistically significantly higher than those of the Discharged and ICU groups (p=0.0001, p=0.001). No statistically significant difference was observed between the NRS-2002 mean scores of the discharged and ICU groups (p=0.650) (Table 3).
 |
Table 3 Multiple Comparison Test |
The albumin averages of the discharged group were found to be statistically significantly higher than those of the ICU and Mortal groups (p=0.0001), and no statistically significant difference was observed between the albumin averages of the ICU and Mortal groups (p=0.213) (Table 3). The prealbumin averages of the discharged group were found to be statistically significantly higher than those of the ICU and Mortal groups (p=0.0001), and no statistically significant difference was observed between prealbumin averages of the ICU and Mortal groups (p=0.059) (Table 3). The CRP averages of the discharged group were found to be statistically significantly lower than those of the ICU and Mortal groups (p=0.0001), and no statistically significant difference was observed between the CRP averages of the ICU and Mortal groups (p=0.116) (Table 3).
Logistic Regression Analysis
Logistic Regression analysis was performed with gender, hypertension, NRS-2002, albumin, prealbumin and CRP variables to determine the factors affecting mortality and transfer to ICU (Table 4). It was observed that low albumin (0.001) affected transfer to ICU. High NRS-2002 (p=0.003) and low albumin (p=0.001) and prealbumin (p=0.019) were found to be factors affecting mortality (Table 4).
 |
Table 4 Multivariate Logistic Regression Analyses of Patients Transferred to ICU, and Mortal Patients |
ROC Analysis
The areas under the ROC Curve of NRS, albumin, prealbumin and CRP variables were calculated in the differential diagnoses of patients who were transferred to ICU. The area of albumin under the ROC Curve was found as 0.703 (0.664–0.740). The areas under the ROC curve for NRS (0.534), prealbumin (0.645) and CPR (0.653) were below 0.700. For the ≤2.44 Predictive value of the albumin variable, Sensitivity was found as 54.62, Specificity 74.28, Positive Predictive Value 31.5, Negative Prediction value 92.7, and LR (+) value 2.12.
The areas under the ROC Curve of NRS, albumin, prealbumin and CRP variables were calculated in the differential diagnosis of mortal patients. The area under the ROC Curve of the albumin variable was found as 0.744 (0.709–0.777), the area under the ROC Curve of the prealbumin variable 0.743 (0.708–0.776), and the area under the ROC Curve of the CRP variable, 0.706 (0.669–0.740) (Figure 2). The area under the ROC Curve of the NRS variable is below 0.700 (0.626).
 |
Figure 2 ROC curves for the albumin, prealbumin and CRP for predicting mortality. |
For the ≤2.56 Predictive value of the albumin variable, Sensitivity was found as 68.50, Specificity 67.03, Positive Predictive Value 36.0, Negative Prediction value 88.7, and LR (+) value 2.08. For Prealbumin variable ≤8 Predictive value, Sensitivity was found as 59.39, Specificity 74.70, Positive Prediction 38.2, Negative Prediction 87.5, and LR (+) 2.35. For CRP variable >5.7 Predictive value, Sensitivity was found as 72.89, Specificity 59.01, Positive Prediction 32.8, Negative Prediction 88.8 and LR (+) 1.98.
Discussion
Malnutrition is very commonly encountered in PCC, especially in geriatric patients. The development of malnutrition may lead to treatment failure, poor prognosis, and increased mortality.15 For this reason, patients should be screened for nutritional risk at regular intervals and appropriate nutritional support should be provided to requiring patients. Studies on current nutritional assessment parameters to predict prognosis in geriatric patients are not sufficient. Therefore, we aimed to investigate the efficiency of commonly used nutritional assessment parameters in predicting prognosis in this study. We believe that conducting our study in a single center, regular follow-up, and system logging of the patients by the same team will contribute positively to the purpose of our study.
In our study, we investigated the effectiveness of NRS-2002, BMI, albumin, prealbumin and CRP, which are commonly used nutritional assessment tests, in predicting prognosis in 1451 geriatric patients diagnosed with malnutrition in PCC. Our results showed that; BMI has no prognostic predictive effect, high NRS-2002 and CRP and low albumin and prealbumin levels can be used to predict mortality, and low albumin indicates poor prognosis and can predict patients who will be transferred to the ICU.
There are several studies reporting NRS-2002 as an independent predictor of malnutrition-related mortality and length of hospital stay.16 In a study conducted in ICU, it was stated that mortality increased by 2.1 times if NRS-2002 ≥3.17 Again, in a retrospective study conducted on 5698 patients, it was reported that if NRS-2002 is ≥3, then mortality is doubled, and that NRS-2002 is a good mortality indicator for 3–6 months and 1 year.15 It was shown that NRS-2002 is associated with high mortality in hospitalized patients,18 and even by itself it is still a mortality indicator (17 olacak). It was also shown that NRS-2002 is an independent predictor of mortality in patients aged ≥65 years,19 is a strong and independent factor in demonstrating early and late mortality,15,20 and is a good predictor to demonstrate 2-year mortality.16 In our study, we found that NRS-2002 averages were higher in the Mortal group than in the Discharge and ICU groups, which is in line with the literature (p=0.0001, p=0.001) (Table 3). In addition, we supported the fact that the height of NRS-2002 is a risk factor for mortality with our logistic regression analysis (Table 4).
In our study, BMI did not predict the prognosis in geriatric patients with malnutrition.21 A retrospective study, which investigates the effects of malnutrition markers in geriatric cancer patients, reports many studies that did not find a relationship between BMI and patient outcomes.22
It was shown that a decrease in albumin levels is associated with increased morbidity and mortality in hospitalized patients. Therefore, it is commonly reported as a prognostic indicator.23 Various studies demonstrated that albumin is associated with survival24–27. A clear relationship was found between albumin concentration and all-cause mortality in older patients.28 In our study, we found that low albumin level is a risk factor for mortality (Table 4). In addition, it was shown in various studies that low albumin level is associated with poor prognosis.29 We also found that low albumin levels reveal poor prognosis in patients, and that a low albumin level is decisive regarding ICU transfer (Table 4). In a prospective observational study on 54,215 patients, it was found that when the albumin level decreased from 4.6 g/dL to 2.1 g/dL, the mortality rate increased from <1% to 29%, and the morbidity rate increased from 10% to 65%.30 We also found that a decrease in ALB level below ≤2.44 increased the rate of transfer to the ICU by 2.12 times, and a decrease below ≤2.56 increased mortality 2.08 times.
Prealbumin was also reported to be a prognostic indicator for mortality in patients at risk of malnutrition.31 In this study, we also found that low prealbumin is a risk factor for mortality (Table 3). The same study, reports that a prealbumin level of <11 mg/L increases the length of hospital stay and mortality.31 We can also say that prealbumin ≤8 mg/L increases mortality 2.35 times.
When the catabolic process caused by inflammatory diseases is coupled with old age, the risks of malnutrition, mortality and morbidity also increase.3,14,32,33 A relationship was demonstrated between CRP and survival.24–27 We can also say that the CRP level is lower in discharged patients (Tables 1 and 3), and high CRP may be an indicator of mortality.27 In addition, we can say that a CRP level above 5.7 increases mortality 1.98 times.
There are certain limitations to our study. Although we did not include patients with cachexia due to malignancy, in our study, we worked with a large group of comorbid patients diagnosed with malnutrition. We believe that new studies with a more specific patient group will bring more clarity to this issue.
Conclusion
Based on the results of our study, we found that BMI had no prognostic predictive effect. We concluded that high NRS-2002 and CRP, and low albumin and prealbumin levels can be used to predict mortality in patients diagnosed with malnutrition aged ≥65 years in PCC. We found that low albumin also indicates a poor prognosis and can predict patients who will be transferred to the ICU. There is a need for further studies on the prognostic predictive power of malnutrition parameters to support these results.
Disclosure
The authors declare no conflicts of interest in this work.
References
1. Serdar KA, Can SM, Gokce A, Yüce BH, Feza YK. The Effect of Nutritional Status on Quality of Life in Palliative Care Patients. Indian J Surgery. 2020;82(4):492–496. doi:10.1007/s12262-019-02013-z
2. Volkert D, Beck AM, Cederholm T, Cruz-Jentoft A, Goisser S, Hooper L. ESPEN guideline on clinical nutrition and hydration in geriatrics. Clin Nutr. 2019;38(1):10–47.
3. Agarwal E, Miller M, Yaxley A, Isenring E. Malnutrition in the elderly: a narrative review. Maturitas. 2013;76(4):296–302. doi:10.1016/j.maturitas.2013.07.013
4. Zhou J, Wang M, Wang H, Chi Q. Comparison of two nutrition assessment tools in surgical elderly inpatients in Northern China. Nutr J. 2015;14(1):1–8. doi:10.1186/s12937-015-0054-8
5. Drescher T, Singler K, Ulrich A, Koller M, Keller U, Christ-Crain M. Comparison of two malnutrition risk screening methods (MNA and NRS 2002) and their association with markers of protein malnutrition in geriatric hospitalized patients. Eur J Clin Nutr. 2010;64(8):887–893. doi:10.1038/ejcn.2010.64
6. Velasco C, García E, Rodríguez V, Frías L, Garriga R, Álvarez J. Comparison of four nutritional screening tools to detect nutritional risk in hospitalized patients: a multicentre study. Eur J Clin Nutr. 2011;65(2):269–274. doi:10.1038/ejcn.2010.243
7. Kondrup J, Rasmussen HH, Hamberg O, Stanga Z; An ad hoc ESPEN Working Group. Nutritional risk screening (NRS 2002): a new method based on an analysis of controlled clinical trials. Clin Nutr. 2003;22(3):321–336. doi:10.1016/S0261-5614(02)00214-5
8. Jésus P, Achamrah N, Grigioni S, Charles J, Rimbert A, Folope V. Validity of predictive equations for resting energy expenditure according to the body mass index in a population of 1726 patients followed in a Nutrition Unit. Clin Nutr. 2015;34(3):529–535. doi:10.1016/j.clnu.2014.06.009
9. National Heart, Lung, and Blood Institute. Morbidity & Mortality. National Institutes of Health NH, Lung, and Blood Institute; 2012.
10. Gama-Axelsson T, Heimbürger O, Stenvinkel P, Bárány P, Lindholm B, Qureshi AR. Serum albumin as predictor of nutritional status in patients with ESRD. Clin J Am Soc Nephrol. 2012;7(9):1446–1453. doi:10.2215/CJN.10251011
11. De Ulíbarri JI, González-Madroño A, de Villar NG, et al. CONUT: a tool for controlling nutritional status. First validation in a hospital population. Nutricion Hospitalaria. 2005;20(1):38–45.
12. Ingenbleek Y. Plasma transthyretin as a biomarker of sarcopenia in elderly subjects. Nutrients. 2019;11(4):895. doi:10.3390/nu11040895
13. Üreyen O, Kunduracı YE, Bulut Y, İnal C, Ortan P. Comparison of Nutritional Status with Clinical Status, Laboratory Results and NRS-2002 Score in Patients Requiring Nutritional Support. Eur Arch Med Res. 2019;35(2):60. doi:10.4274/eamr.galenos.2017.02679
14. Orlandoni P, Venturini C, Jukic Peladic N, Costantini A, Di Rosa M, Cola C. Malnutrition upon hospital admission in geriatric patients: why assess it? Front Nutr. 2017;4:50. doi:10.3389/fnut.2017.00050
15. Hersberger L, Bargetzi L, Bargetzi A, Tribolet P, Fehr R, Baechli V. Nutritional risk screening (NRS 2002) is a strong and modifiable predictor risk score for short-term and long-term clinical outcomes: secondary analysis of a prospective randomised trial. Clin Nutr. 2020;39(9):2720–2729. doi:10.1016/j.clnu.2019.11.041
16. Miličević T, Kolčić I, Đogaš T, Živković PM, Radman M, Radić J. Nutritional Status and Indicators of 2-Year Mortality and Re-Hospitalizations: experience from the Internal Clinic Departments in Tertiary Hospital in Croatia. Nutrients. 2020;13(1):68. doi:10.3390/nu13010068
17. Machado Dos Reis A, Marchetti J, Forte Dos Santos A, Franzosi OS, Steemburgo T. NUTRIC Score: isolated and combined use with the NRS‐2002 to predict hospital mortality in critically ill patients. J Parenteral Enteral Nutr. 2020;44(7):1250–1256. doi:10.1002/jpen.1804
18. Raslan M, Gonzalez MC, Torrinhas RSM, Ravacci GR, Pereira JC, Waitzberg DL. Complementarity of Subjective Global Assessment (SGA) and Nutritional Risk Screening 2002 (NRS 2002) for predicting poor clinical outcomes in hospitalized patients. Clin Nutr. 2011;30(1):49–53. doi:10.1016/j.clnu.2010.07.002
19. Zhang X, Zhang X, Zhu Y, Tao J, Zhang Z, Zhang Y. Predictive value of nutritional risk screening 2002 and mini nutritional assessment short form in mortality in Chinese hospitalized geriatric patients. Clin Interv Aging. 2020;15:441. doi:10.2147/CIA.S244910
20. Sanson G, Sadiraj M, Barbin I, Confezione C, De Matteis D, Boscutti G. Prediction of early-and long-term mortality in adult patients acutely admitted to internal medicine: NRS-2002 and beyond. Clin Nutr. 2020;39(4):1092–1100. doi:10.1016/j.clnu.2019.04.011
21. Baldemir R, Alagoz A. The relationship between mortality, nutritional status, and laboratory parameters in geriatric chronic obstructive pulmonary disease patients. Cureus. 2021;13(12):115.
22. Bullock AF, Greenley SL, McKenzie GA, Paton LW, Johnson MJ. Relationship between markers of malnutrition and clinical outcomes in older adults with cancer: systematic review, narrative synthesis and meta-analysis. Eur J Clin Nutr. 2020;74(11):1519–1535. doi:10.1038/s41430-020-0629-0
23. Yentür E. Beslenme durumunun değerlendirilmesi. Klinik Gelisim. 2011;24:1–4.
24. Baitar A, Kenis C, Decoster L, De Grève J, Lobelle J, Flamaing J. The prognostic value of 3 commonly measured blood parameters and geriatric assessment to predict overall survival in addition to clinical information in older patients with cancer. Cancer. 2018;124(18):3764–3775. doi:10.1002/cncr.31580
25. Kanesvaran R, Li H, Koo K-N, Poon D. Analysis of prognostic factors of comprehensive geriatric assessment and development of a clinical scoring system in elderly Asian patients with cancer. J Clin Oncol. 2011;29(27):3620–3627. doi:10.1200/JCO.2010.32.0796
26. Falandry C, Weber B, Savoye A-M, Tinquaut F, Tredan O, Sevin E. Development of a geriatric vulnerability score in elderly patients with advanced ovarian cancer treated with first-line carboplatin: a GINECO prospective trial. Ann Oncol. 2013;24(11):2808–2813. doi:10.1093/annonc/mdt360
27. Yektaş A, Koçak H, Savuşma B. Yoğun Bakım Ünitesinde Yatan Kritik Hastalarda CRP ve Serum Albümin Düzeyi, APACHE II ve NRS-2002 Değerlerinin İlişkisi ve Bu Değerlerin Mortalite Üzerine Etkisinin Retrospektif İncelenmesi [CRP and Serum Albumin Level, Relationship Between APACHE II and NRS-2002 Values in Critical Patients Hospitalized in the Intensive Care Unit, and Retrospective Analysis of the Effects of These Values on Mortality]. Turkiye Klinikleri J Anest Reanim. 2020;18(1):12–22. doi:10.5336/anesthe.2020-74852
28. Corti M-C, Guralnik JM, Salive ME, Sorkin JD. Serum albumin level and physical disability as predictors of mortality in older persons. JAMA. 1994;272(13):1036–1042. doi:10.1001/jama.1994.03520130074036
29. Miura K, Hamanaka K, Koizumi T, Kitaguchi Y, Terada Y, Nakamura D. Clinical significance of preoperative serum albumin level for prognosis in surgically resected patients with non-small cell lung cancer: comparative study of normal lung, emphysema, and pulmonary fibrosis. Lung Cancer. 2017;111:88–95. doi:10.1016/j.lungcan.2017.07.003
30. Yeh DD, Johnson E, Harrison T, Kaafarani HM, Lee J, Fagenholz P. Serum levels of albumin and prealbumin do not correlate with nutrient delivery in surgical intensive care unit patients. Nutr Clin Practice. 2018;33(3):419–425. doi:10.1002/ncp.10087
31. Keller U. Nutritional laboratory markers in malnutrition. J clin med. 2019;8(6):775. doi:10.3390/jcm8060775
32. Correia MIT, Waitzberg DL. The impact of malnutrition on morbidity, mortality, length of hospital stay and costs evaluated through a multivariate model analysis. Clin Nutr. 2003;22(3):235–239. doi:10.1016/S0261-5614(02)00215-7
33. Hoffer LJ, Bistrian BR. Nutrition in critical illness: a current conundrum. F1000Research. 2016;5:2531. doi:10.12688/f1000research.9278.1
 © 2022 The Author(s). This work is published and licensed by Dove Medical Press Limited. The full terms of this license are available at https://www.dovepress.com/terms.php and incorporate the Creative Commons Attribution - Non Commercial (unported, v3.0) License.
By accessing the work you hereby accept the Terms. Non-commercial uses of the work are permitted without any further permission from Dove Medical Press Limited, provided the work is properly attributed. For permission for commercial use of this work, please see paragraphs 4.2 and 5 of our Terms.
© 2022 The Author(s). This work is published and licensed by Dove Medical Press Limited. The full terms of this license are available at https://www.dovepress.com/terms.php and incorporate the Creative Commons Attribution - Non Commercial (unported, v3.0) License.
By accessing the work you hereby accept the Terms. Non-commercial uses of the work are permitted without any further permission from Dove Medical Press Limited, provided the work is properly attributed. For permission for commercial use of this work, please see paragraphs 4.2 and 5 of our Terms.