")
Back to Journals » Journal of Blood Medicine » Volume 15
Prognostic Significance of Dual-Specificity Phosphatase 23 Expression in Acute Myeloid Leukemia
Authors Liu X, Zhuang H, Li F, Lu Y, Pei R
Received 1 November 2023
Accepted for publication 29 January 2024
Published 7 February 2024 Volume 2024:15 Pages 35—50
DOI https://doi.org/10.2147/JBM.S437400
Checked for plagiarism Yes
Review by Single anonymous peer review
Peer reviewer comments 3
Editor who approved publication: Dr Martin H Bluth
Xi Liu,1,2 Haihui Zhuang,1,2 Fenglin Li,1,2 Ying Lu,1,2 Renzhi Pei1,2
1Department of Hematology, The Affiliated People’s Hospital of Ningbo University, Ningbo, People’s Republic of China; 2Institute of Hematology, Ningbo University, Ningbo, People’s Republic of China
Correspondence: Ying Lu; Renzhi Pei, Tel +86-574-87016871 ; Tel +86-574-87016870, Email [email protected]; [email protected]
Background: Recently, an increasing number of studies have suggested dual-specificity phosphatase 23 (DUSP23) is a critical factor in the development of diffuse connective tissue disease and may be a valuable biomarker for primary human cancers. However, there is a lack of comprehensive studies on the prognostic significance of DUSP23 expression in acute myeloid leukemia (AML).
Methods: RNA sequencing data from The Cancer Genome Atlas (TCGA) (AML = 173), Genotype-Tissue Expression (GTEx) (healthy controls = 70) and GEO (AML = 461, healthy controls = 76) databases were used to compare DUSP23 expression between AML patients and healthy controls. The overall survival (OS) of DUSP23 in AML was evaluated using Kaplan-Meier Cox regression. Furthermore, univariate Cox regression and multivariate Cox regression analysis were used to determine whether DUSP23 was an independent prognostic factor for AML. We then verified the expression level and prognostic significance of DUSP23 in our cohort (AML = 128, healthy controls = 31). In addition, functional enrichment analysis of DUSP23-related DEGs was performed through gene set enrichment analysis (GSEA) and protein-protein interaction (PPI) network analysis.
Results: The expression level of DUSP23 is significantly higher in AML patients than in healthy controls in TCGA, GTEx, GEO databases and our cohort. By multivariate analysis, high expression of DUSP23 is a poor prognostic indicator of OS in the TCGA database. Next, we verified the role of DUSP23 as an adverse prognostic biomarker in our cohort. Enrichment analysis of related genes showed that DUSP23 may regulate important signal pathways in hematological tumors including the MAPK pathways. It is suggested by the PPI network that DUSP23, along with IMP3, MRPL4, MRPS12, POLR2L, and ATP5F1D may play a role in the process of AML.
Conclusion: The study demonstrated high expression of DUSP23 could serve as a poor independent prognostic biomarker in AML.
Keywords: DUSP23, expression, prognosis, AML, bioinformatics
Introduction
AML is highly heterogeneous and represents a cohort of clonal malignancies derived from myeloid precursors.1 Existing drugs’ poor therapeutic effects are attributed to leukemia’s complex molecular mechanisms and chemoresistance.2 The molecular basis of AML, aided by biomarkers, can play an essential role in AML diagnosis, prognostic stratification, residual leukemia monitoring, treatment response prediction, and targeted drug development. Therefore, it is necessary to discover novel biomarkers to better understand the molecular basis of AML.3,4
Homoharringtonine (HHT) is widely used in clinical practice. Because of its anti-leukemic efficacy, cost-effectiveness, and minimal toxicity. HHT-resistant strains were constructed by our research team to explore the mechanism of HHT resistance. It was observed that the DUSP23 gene exhibited differential low expression in HHT-resistant cells than sensitive cells.5 This indicated that DUSP23 may serve as a therapeutic target and a potential prognostic factor in AML. DUSP23 is located on chromosome 1q23 and is characterized by a dual-specificity phosphatase catalytic domain.6 It belongs to the low-molecular-weight VHR-like subfamily of the dual-specificity phosphatase family. The expression of DUSP23 is tissue-specific, being expressed only in a few normal tissues but more in fetal and tumor tissues, suggesting that its function may be related to embryonic development and tumor growth.7 So far, the expression of DUSP23 in AML and its prognostic value remain unclear.
The objective of this study was to assess the prognostic significance of DUSP23 in AML. Firstly, RNA sequencing data of AML patients and healthy controls were obtained from the TCGA, GTEx and GEO databases to examine the expression characteristics of DUSP23. Subsequently, the clinical significance of DUSP23 in AML was assessed by using Kaplan-Meier and Cox regression analyses and developing a nomogram prognostic model. Next, we verified the differences in DUSP23 expression between AML patients and healthy controls in our cohort and assessed its prognostic relevance. Additionally, functional enrichment analyses of DUSP23 were conducted using various methods, including GO, KEGG, GSEA, the PPI network, SSGSEA, and immune cell infiltration analysis, to provide a preliminary grasp of the underlying molecular mechanisms of DUSP23 in AML carcinogenesis and progression. Based on the above results, the prognostic value of DUSP23 for AML was confirmed.
Materials and Methods
Data Source
RNA-seq data and clinical information of AML patients for the TCGA and GTEx databases were obtained from the UCSC XENA browser (https://portal.gdc.cancer.gov;https://xenabrowser.net/datapages/),8–12 and the RNA-seq dataset GSE6891 was downloaded from the GEO databases https://www.ncbi.nlm.nih.gov/geo/).13–15 The TCGA databases include 173 AML patient samples, the GTEx databases include 70 healthy controls. The GSE6891 dataset, derived from the GPL570 platform, comprises 461 AML patient samples and 76 healthy controls. TPM values obtained from RNA-Seq were utilized, and a log2 transformation was performed for intrasample comparisons to ensure data consistency across different databases. Samples without survival data were excluded from the analysis.
Patients’ Samples
A total of 128 AML patients and 31 healthy control bone marrow samples were collected at the Affiliated People’s Hospital of Ningbo University. Written informed consent was obtained from all participants before their involvement in the study. This study was approved by the Research Ethics Committee of the Affiliated People’s Hospital of Ningbo University. Patients were divided into two groups based on the cut-off value of DUSP23 mRNA expression. Non-M3 patients received standard anthracycline plus cytarabine therapy, while M3 patients received all-trans retinoic acid (ATRA) plus arsenic trioxide (ATO) therapy. Baseline clinical characteristics are shown in Table 1.
 |
Table 1 Characteristics of AML Patients by High and Low DUSP23 Expression |
Validation of Prognostic Gene by Quantitative Real-Time PCR (qRT-PCR) Analysis
RNA extraction from the tissue samples was conducted using Trizol reagent (Invitrogen, Shanghai, China) following the manufacturer’s protocol. The obtained RNA (1000 ng) was then utilized for cDNA synthesis through a cDNA synthesis kit (Takara, Tokyo, Japan). qRT-PCR was performed using TB Green PCR Master Mix (Takara, Tokyo, Japan) on a 7500 Fast Real-Time PCR System (Applied Biosystems, Singapore), and the relative expression of DUSP23 was determined using the comparative cycle threshold (Ct) method.16,17 The 2–ΔΔCt method was employed to assess gene expression relative to glyceraldehyde—3—phosphate dehydrogenase (GAPDH) for AML cells. The primers were as follows: DUSP23 forward: 5′-GCCATTGCTGAAATCCGACG-3′; reverse:5′-CTGCTCATAGGTCTCGATGGA-3′; GAPDH forward: 5′-ATGGGGAAGGTGAAGGTCG-3′; reverse: 5′-GGGTCATTGATGGCAACAATATCCATA-3′.
Prognostic Model Generation and Prediction
A nomogram was created using the RMS R package (version 6.3–0) to personalize the prediction of OS in AML patients, incorporating significant clinical characteristics and calibration plots. Calibration curves were used to assess the accuracy of the nomogram, which compared the observed rates with the nomogram-predicted probabilities. The optimal predictive values were represented by the 45° line. The discrimination ability of the nomogram was determined by the concordance index (C-index), which was computed using 8000 bootstraps resamples.18
DEG Analysis
The expression profile of high- and low-expression levels of DUSP23 (cut-off value of 50%) in AML samples (HTseq-Count) were compared using the DESeq2 R package to identify DEGs.19,20 A heatmap was used to visualize the top 20 DEGs (Figure 1B).
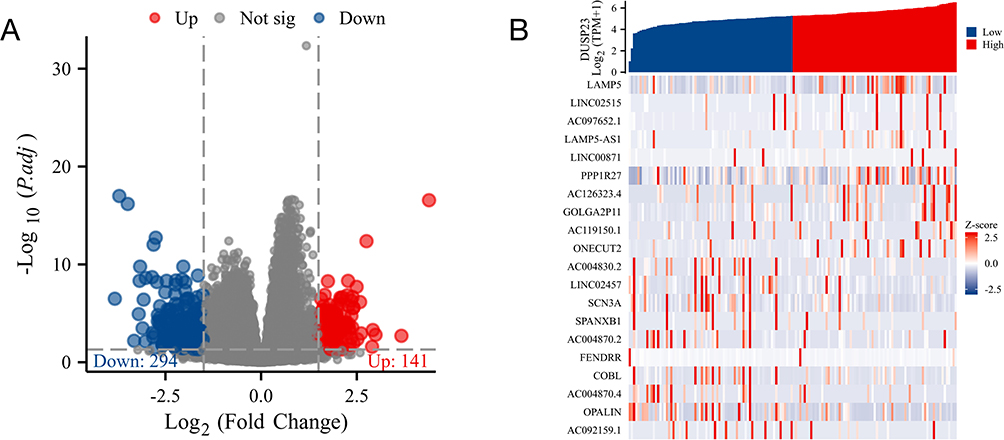 |
Figure 1 DEGs of the high- and low-DUSP23 expression groups in AML. (A) Volcano plot of DUSP23-related DEGs. (B) Heatmap of DUSP23-related DEGs. |
Gene Ontology (GO) and Kyoto Encyclopedia of Genes and Genomes (KEGG) Enrichments Analysis of DEGs
A threshold of |logFC| >1.5 and padj<0.05 was applied to select DEGs for functional enrichment analysis, and R (4.2.1) was used for this analysis. The clustered DEGs were visualized as a heatmap using ggplot2[3.3.6] in R.
GSEA
GSEA was performed using the R (4.2.1) to identify functional and pathway differences between the high- and low-expression groups of DUSP23. Significance was determined based on an adjusted P-value < 0.05 and FDR q-value < 0.25.
PPI Network
The PPI network was derived from the STRING database (https://string-db.org/) to estimate the interactional correlations of the DEGs.21 A confidence score >0.45 was considered significant. Hub proteins and key nodes in the constructed PPI network were identified using the Cytoscape plugin CytoHubba.5,22
Immune Infiltration Analysis
SSGSEA analysis was performed using the GSVA package in R (version 3.6.3) to analyze immune infiltration in DUSP23. Data on 24 types of infiltrating immune cells, as previously described, were obtained. The correlation between DUSP23 expression and the enrichment scores of the 24 types of immune cells was assessed using Spearman correlation.23,24 Moreover, the enrichment scores between high- and low-DUSP23 expression groups were compared using the Wilcoxon rank-sum test.
Statistical Analysis
The statistical data obtained from TCGA and GTEX were analyzed using R-4.2.1. Prognostic factors were evaluated using Cox regression analysis and the Kaplan-Meier method. The median expression of DUSP23 was taken as the cut-off value. A statistically significant result was considered as a P-value less than 0.05 in all tests. Furthermore, the effectiveness of the transcriptional expression of DUSP23 in differentiating AML from healthy samples was assessed using ROC analysis on the pROC package. The area under the curve (AUC) value, computed in the range of 0.5 to 1.0, indicated a discrimination ability of 50–100%. OS is defined as the length of time from a specific point in time, such as diagnosis or treatment, that patients with a disease are still alive.
Results
DUSP23 Expression in Pan-Cancer and AML
In pan-cancer analysis, the expression profiles of DUSP23 in normal and malignant samples were determined. Remarkably, DUSP23 was upregulated in multiple malignancies like Bladder cancer, ovarian cancer, etc. (Supplementary Figure 1). In addition, DUSP23 was also abnormally highly expressed in AML compared with healthy controls (Figure 2A). Subsequently, the result from GSE6891 also confirmed that DUSP23 expression is higher in AML patient samples (Figure 2B). To further investigate the significance of DUSP23 expression, the Wilcoxon Rank Sum test was used to compare its expression levels in patients with various clinicopathological features. The results indicated that DUSP23 was significantly upregulated in patients with > 70% peripheral blood (PB) blasts (P < 0.05) than those with ≤ 70% PB blasts, in patients with poor cytogenetic risk (P < 0.01) than intermediate/normal risk, and in FLT3 mutation-positive cases (P < 0.05) than FLT3 mutation-negative cases (Figure 2C–E). This may indicate that high DUSP23 expression is associated with an unfavorable prognosis.
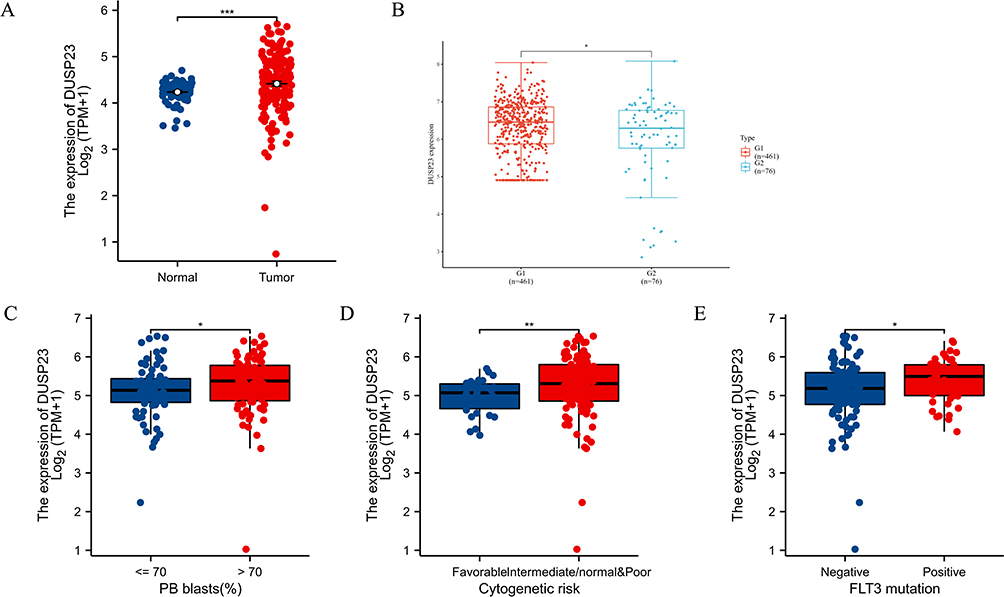 |
Figure 2 The association of DUSP23 expression with clinical characteristics. (A) Expression level of DUSP23 in paired normal and AML samples. Analysis between two groups: Wilcoxon Rank sum test; NS: P 0.05 or higher; (*P < 0.05; **P < 0.01; ***P < 0.001). (B) DUSP23 expression in AML from GEO databases (GSE6891). (C) PB blasts abundance, (D) Cytogenetic risk, (E) FLT3 mutation. |
The Relationship Between the Expression of DUSP23 and the Prognosis of AML Patients
The above results suggest that elevated expression of DUSP23 is associated with an unfavorable prognosis. Subsequently, the verification of whether DUSP23 is an independent predictive factor for unfavorable AML prognosis will be conducted. The clinical characteristics of TCGA patients were downloaded and divided into high and low expression groups according to the median of the expression of DUSP23 (Table 2). Notably, patients with higher DUSP23 expression had significantly higher WBC counts and PB blasts than those with lower DUSP23 expression (P = 0.017 and = 0.014, respectively; Table 2). There were also significant differences between the two groups in the incidence of each FAB classification and cytogenetic risk (P = 0.006 and = 0.016, respectively; Table 2). Higher DUSP23 expression was significantly correlated with FLT3 (P = 0.01; Table 2).
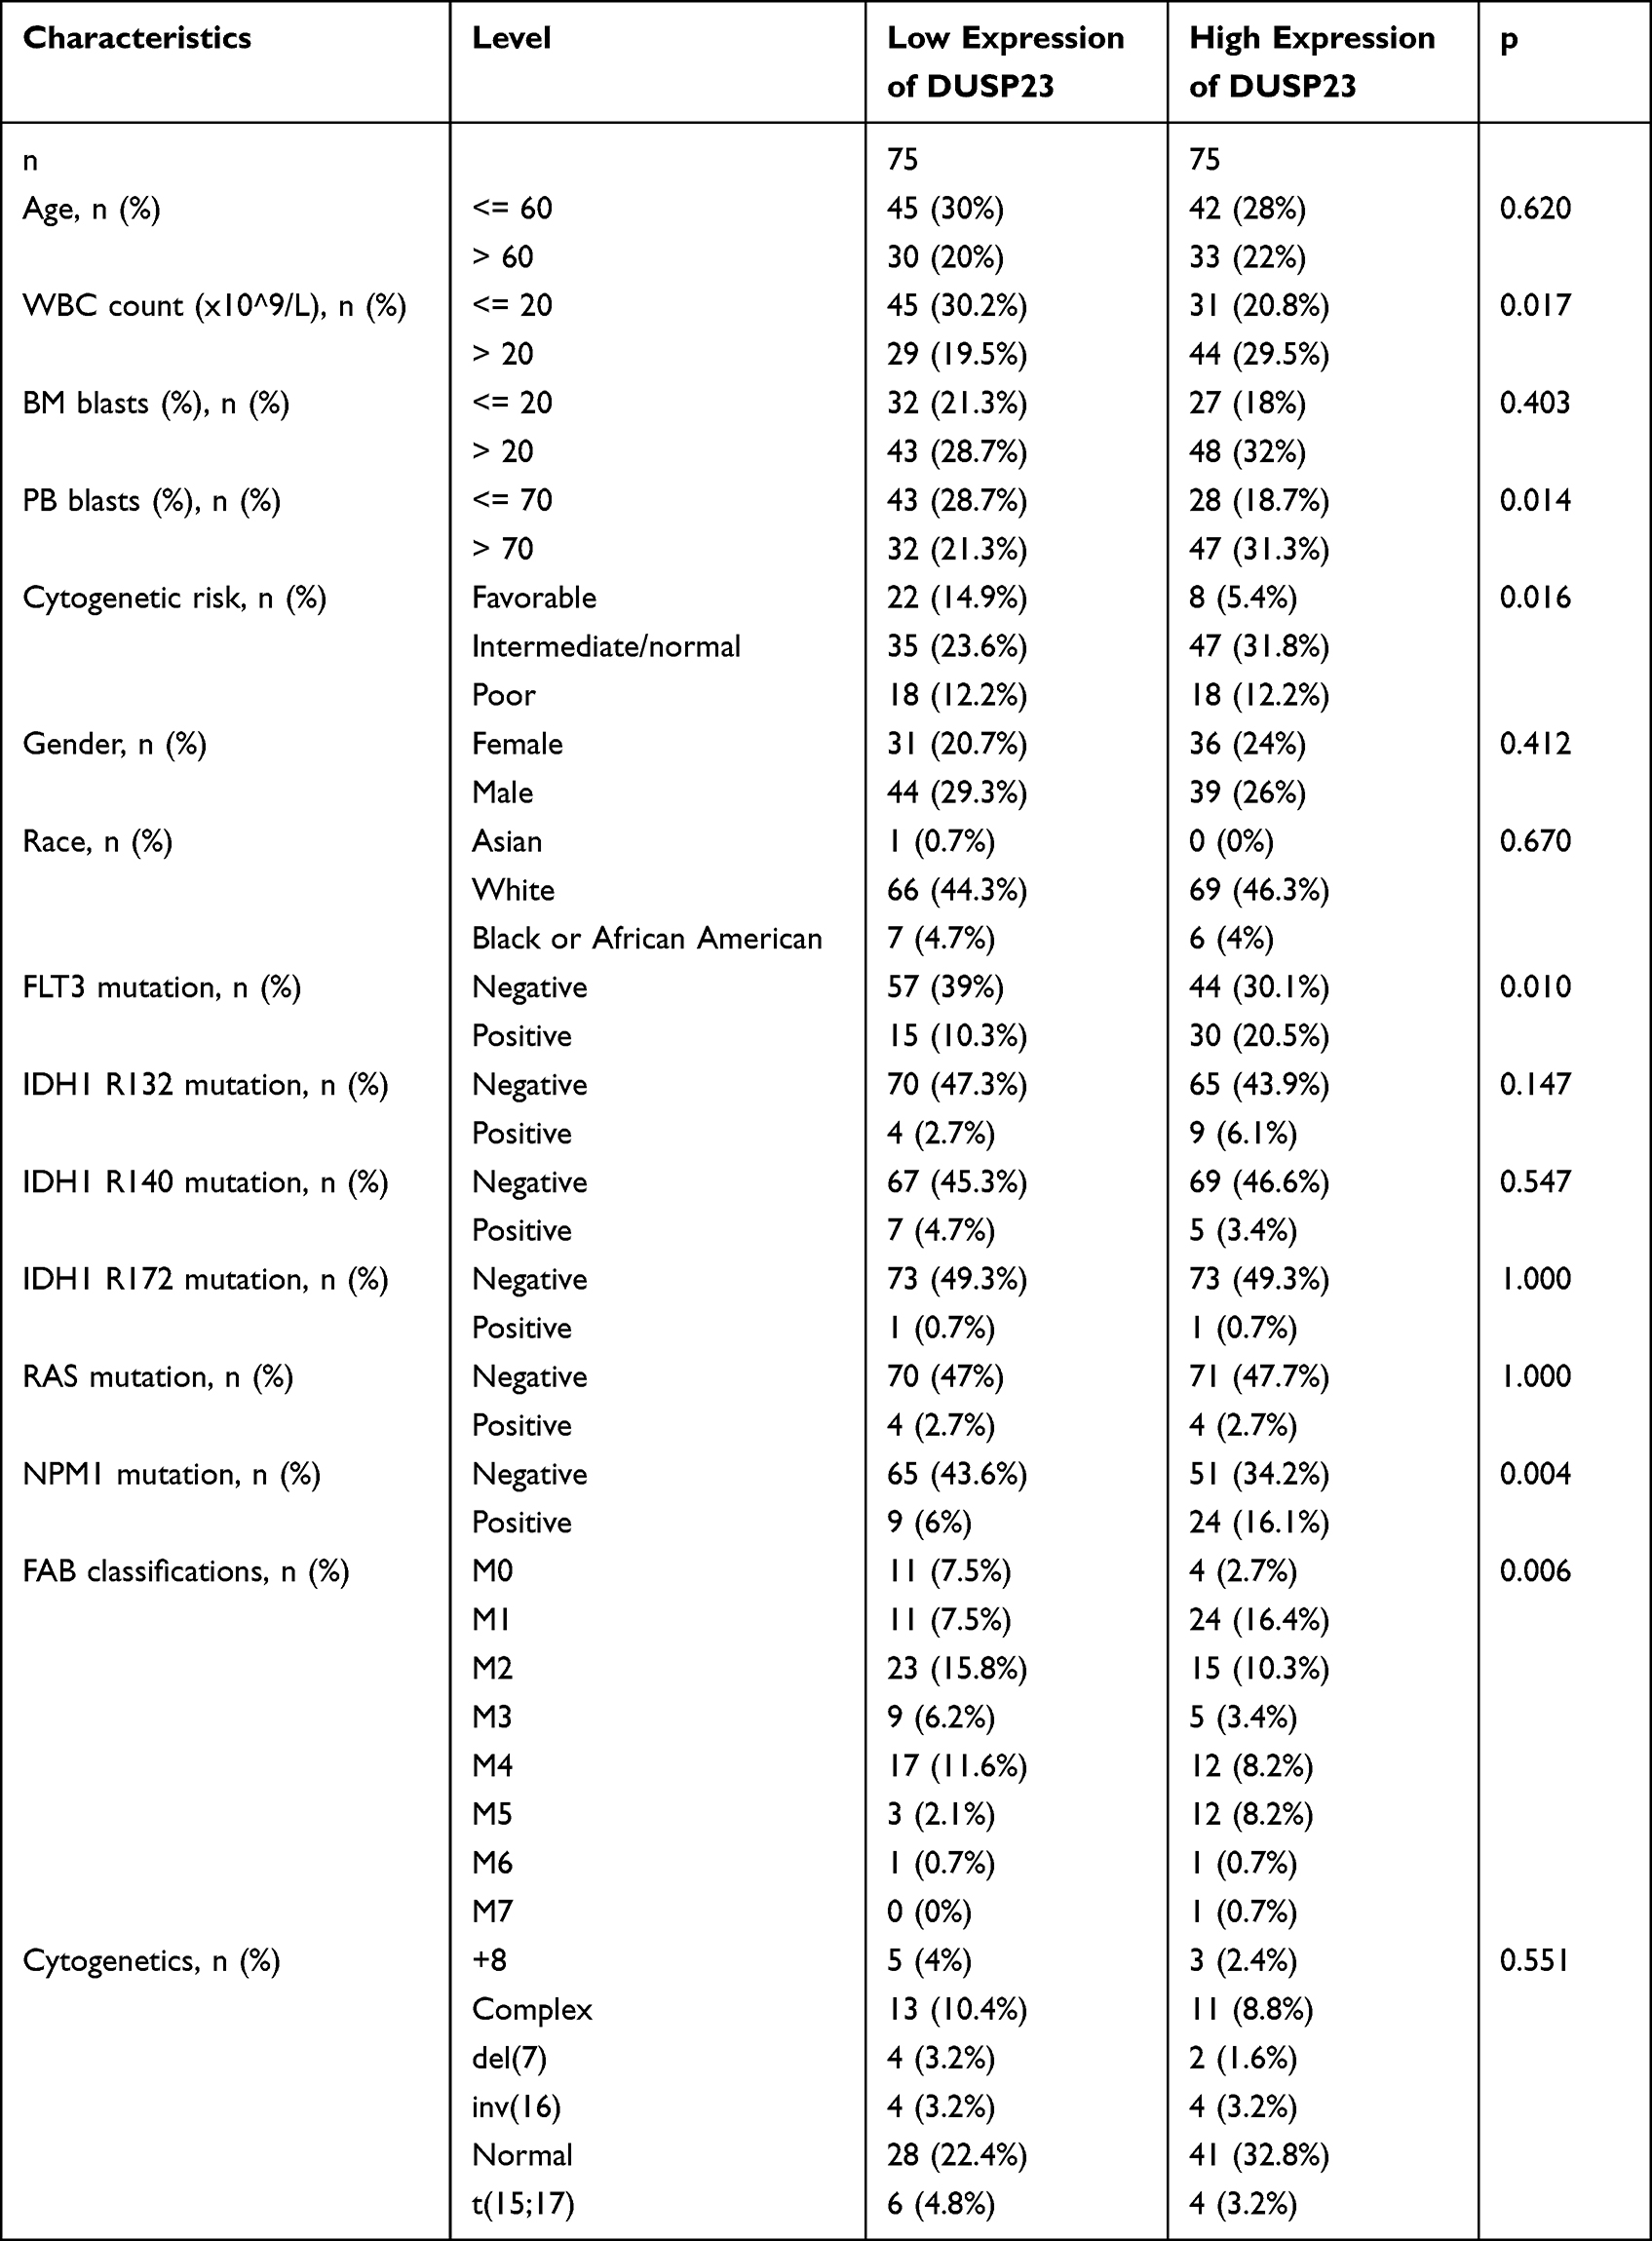 |
Table 2 Association Between DUSP23 Expression and Clinicopathologic Features in AML Samples from the TCGA |
The study identified an association between poor OS and increased expression of DUSP23 in AML patients (Figure 3A). The robust prognostic value of DUSP23 for OS in AML patients was confirmed by ROC analysis, with a C-index of 0.647 (95% confidence interval: 0.580–0.714) (Figure 3B). In addition, cytogenetic risk (intermediate/normal and poor) and DUSP23 were also poor prognostic factors for AML patients (Figure 3C).
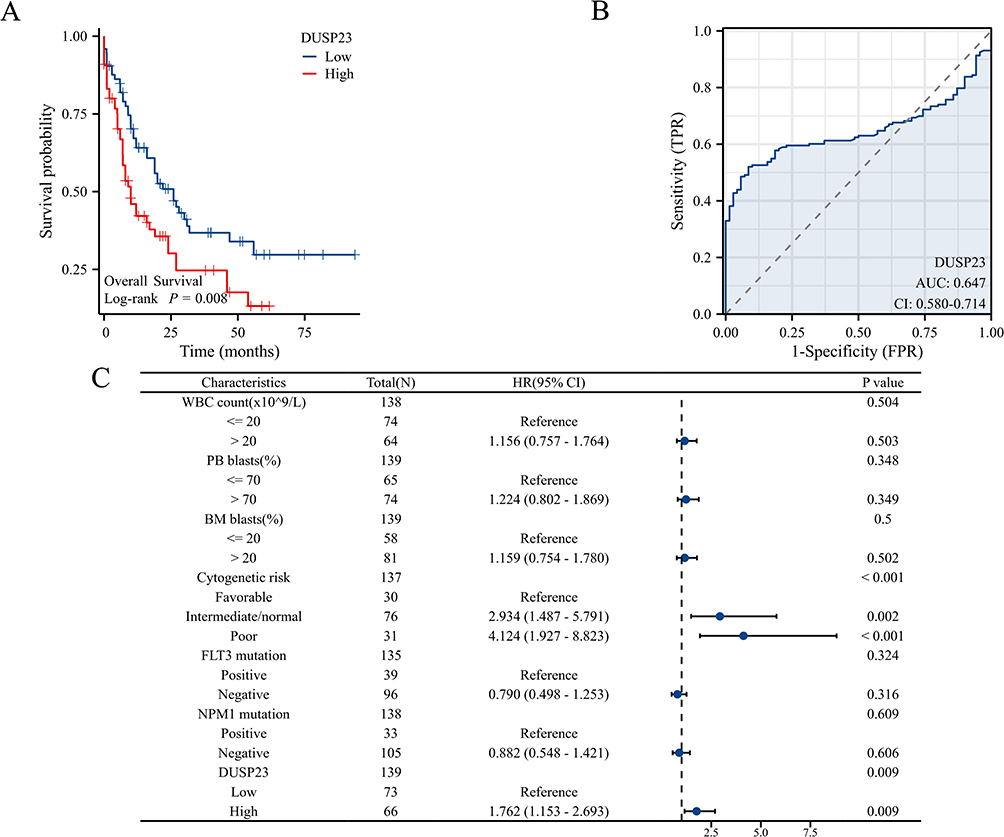 |
Figure 3 High expression of DUSP23 was associated with poor OS in AML patients. (A) Kaplan-Meier curves in all AML patients. (B) ROC analysis of DUSP23 in the prognosis of AML. (C) Forest plot showed that DUSP23 predicted poor prognosis in the subgroup of cytogenetic risk (Intermediate/normal andPoor) (HR=2.934, P= 0.002 and HR=4.124, P < 0.001), and DUSP23 high expression. (HR=1.762, P = 0.009). |
In addition, univariate Cox proportional hazards regression was used to assess factors influencing OS. The results revealed that high expression of DUSP23 (P = 0.009), poor & intermediate cytogenetic risk (P < 0.001), and age > 60 (P < 0.001) were predictive factors for worse OS (Table 3). Subsequently, multivariate Cox regression analysis including age, cytogenetic risk, and DUSP23 expression showed that age > 60 (P< 0.001), poor & intermediate cytogenetic risk (P = 0.032), and high expression of DUSP23 (P = 0.008) were independent prognostic factors for worse OS (P < 0.05).
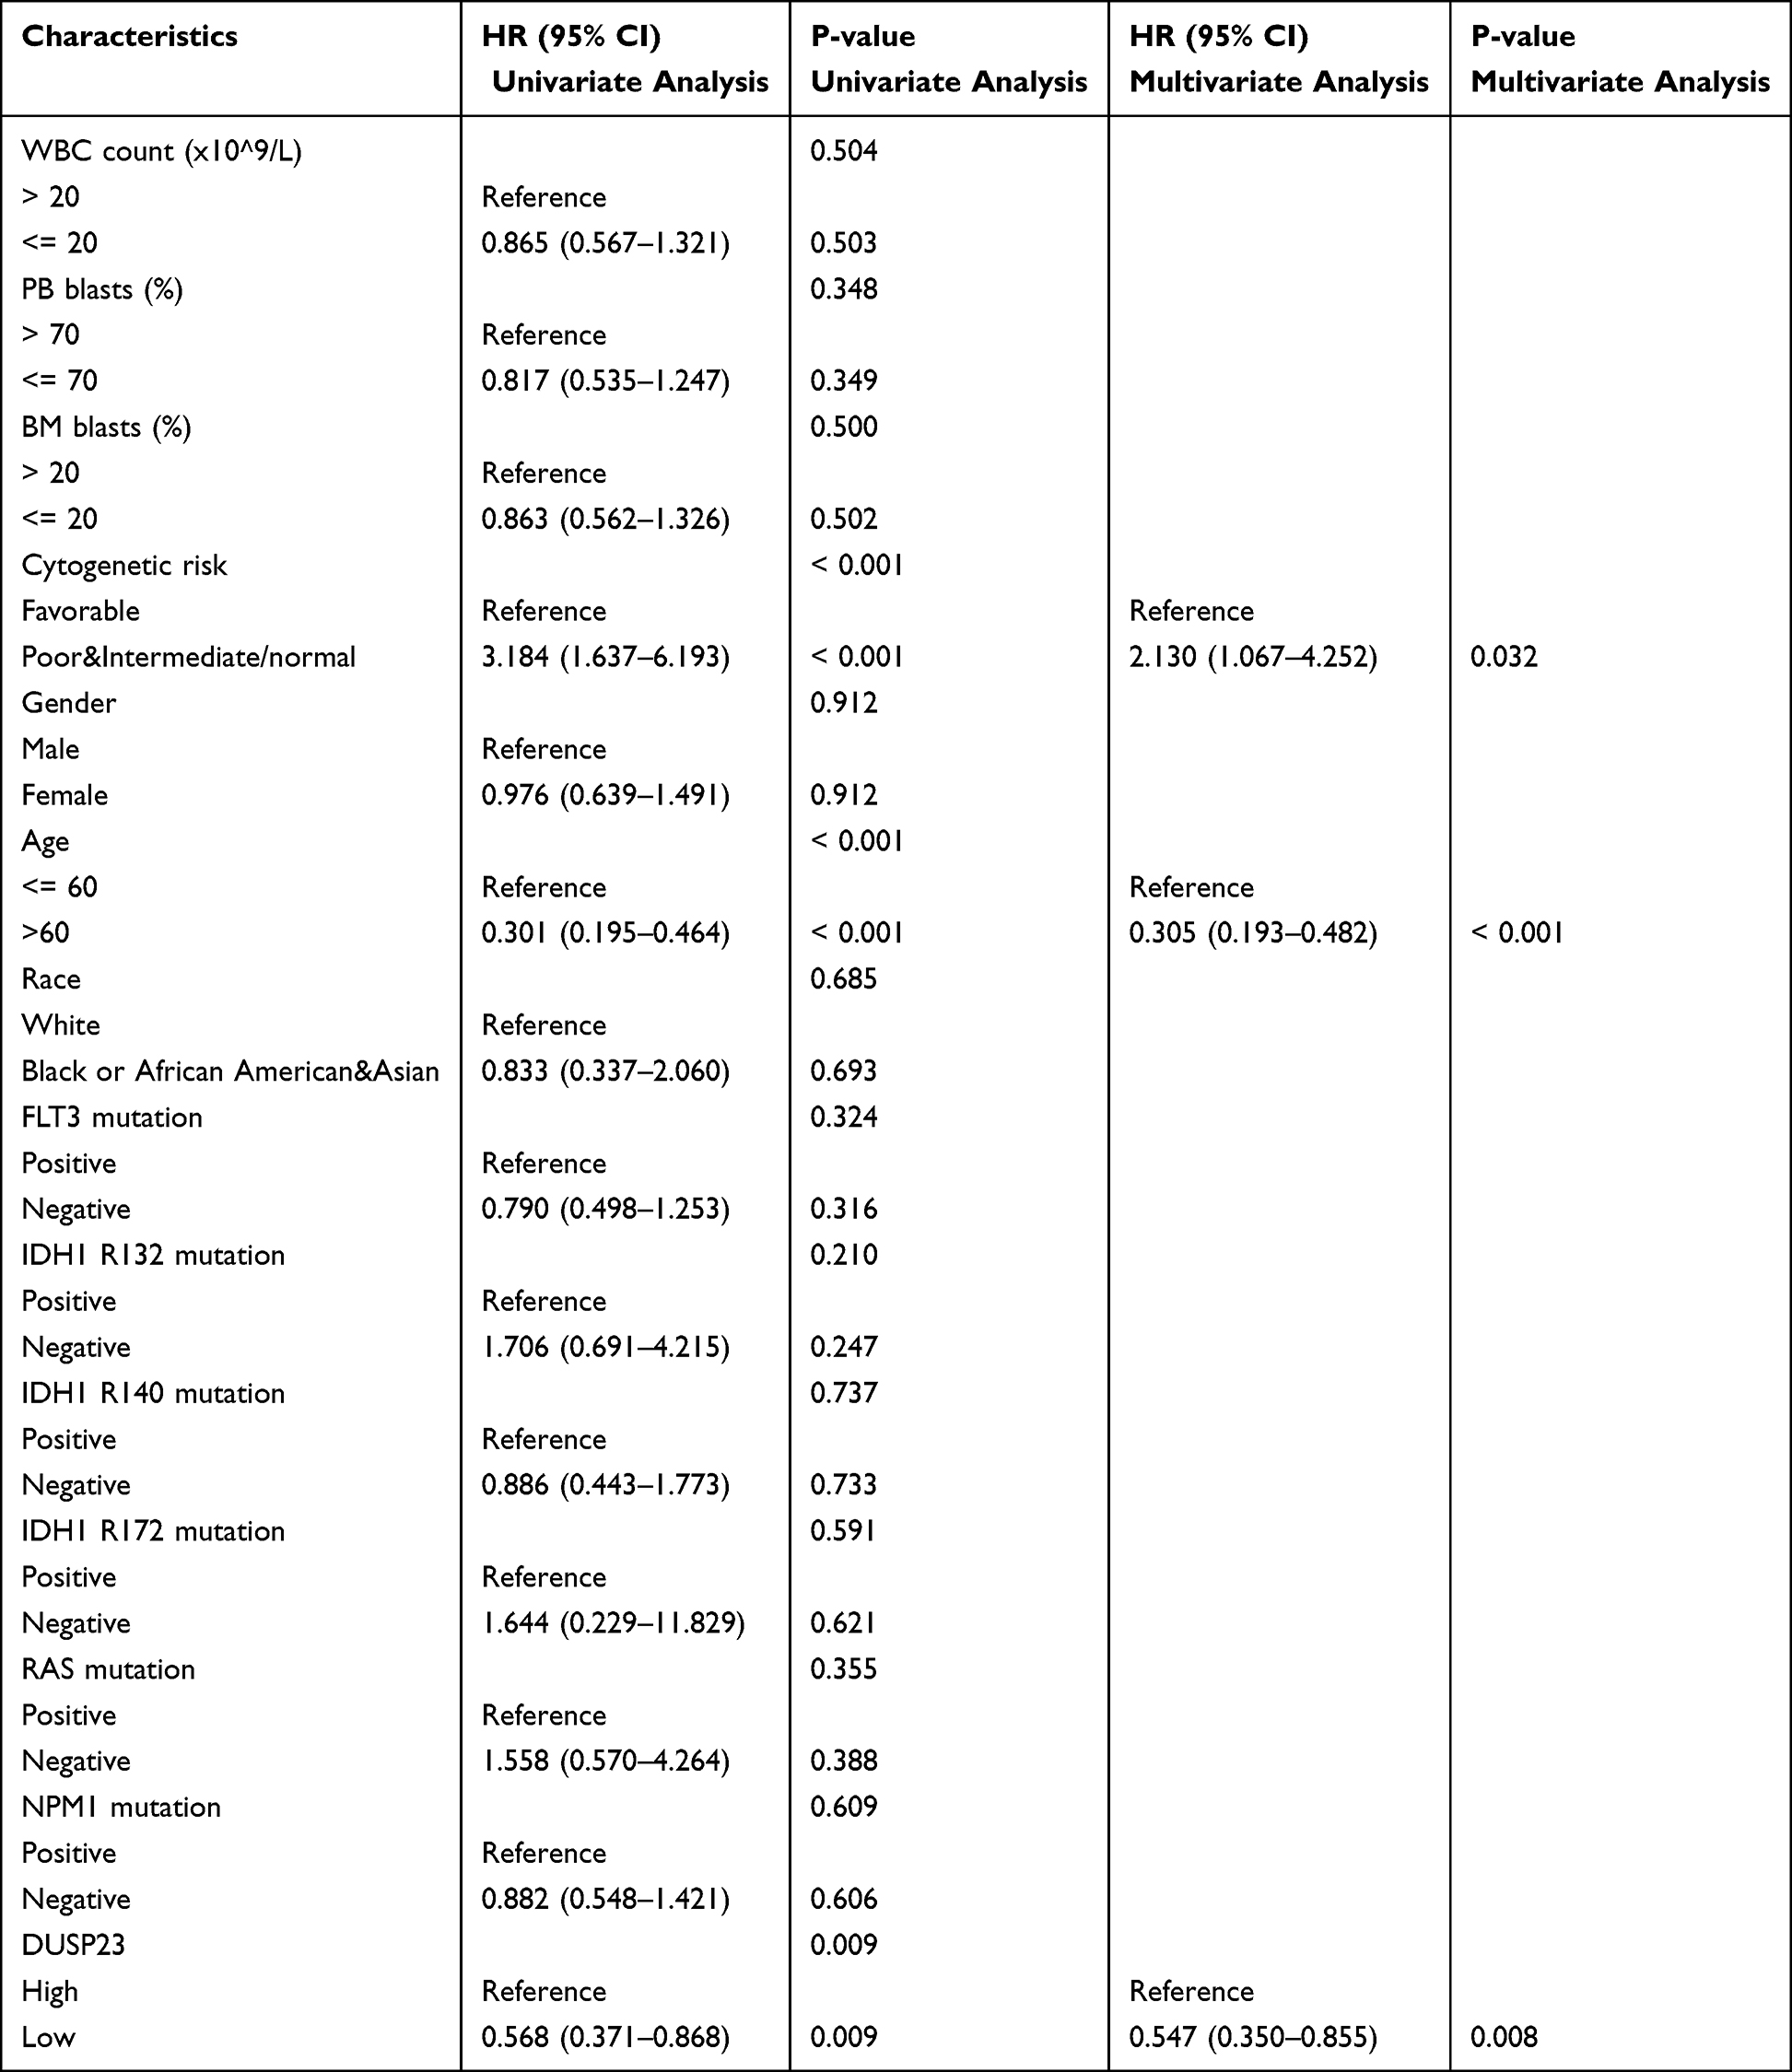 |
Table 3 Univariate and Multivariate Cox’s Regression Analysis of Factors Associated with OS in AML |
Then a Kaplan-Meier analysis was performed to examine the correlation between DUSP23 expression and AML patient prognosis. It was observed that poor prognosis was associated with high expression of DUSP23 in various subgroups, such as patients with age > 60 (P < 0.001; Figure 4A), BM blasts of > 20% (P = 0.009; Figure 4B), PB blasts <= 70% (P = 0.02; Figure 4C), FLT3 mutation positivity (P = 0.05), RAS mutation negativity (P = 0.023), IDH1 R132 mutation negativity (P = 0.007), R140 mutation negativity (P = 0.016), R172 mutation negativity (P = 0.011) (Figure 4D–H), and those with intermediate/normal and poor cytogenetic risk (P = 0.034; Figure 4I).
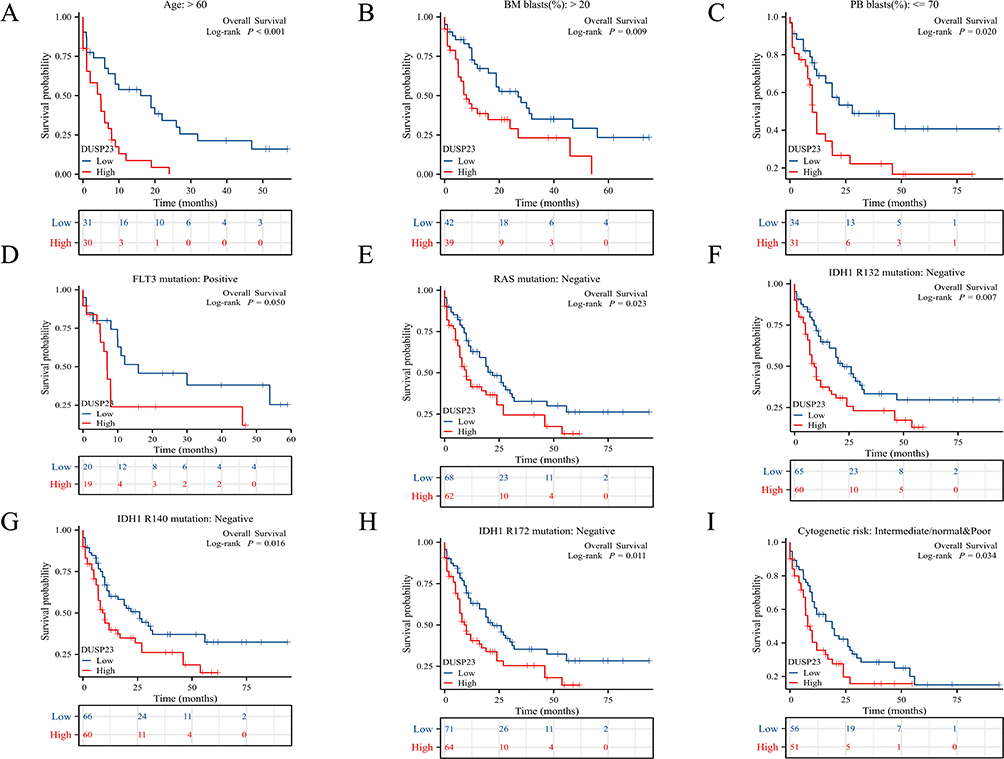 |
Figure 4 The impact of DUSP23 expression on survival of AML patients with specific subtypes. (A) Kaplan-Meier curves in AML patients with age ≥ 60. (B) Kaplan-Meier curves in AML patients with BM blasts > 20%. (C) Kaplan-Meier curves in AML patients with PB blasts ≤ 70%. (D–H) Kaplan-Meier curves in subgroups with FLT3 mutation-positive, RAS mutation-negative, IDH1 R132 mutation-negative, IDH1 R140 mutation-negative, R172 mutation-negative. (I) Kaplan-Meier curves in AML patients with cytogenetic risk intermediate/normal and poor. |
Prognostic Model of DUSP23 in AML
Moreover, based on multivariable logistic regression analysis, we established a nomogram that included the prediction model. The established nomogram was well-calibrated and demonstrated good discriminative power, with a C-index of 0.727 (0.700–0.754) for OS prediction (Figure 5A). Additionally, calibration curves were used to assess the clinical net benefit of our model, and the results showed high consistency between the predicted survival probability and actual OS proportions at 1, 3, or 5 years (Figure 5B).
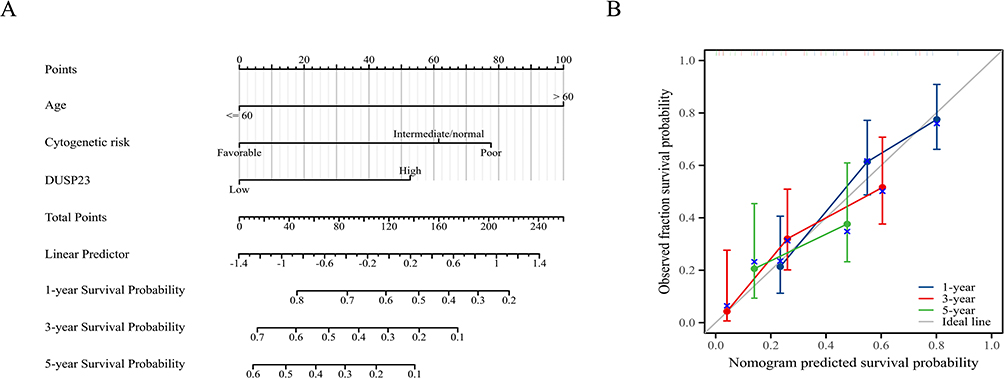 |
Figure 5 A prognostic predictive model of DUSP23 in AML. (A) Nomogram for predicting the probability of 1-, 3-, 5-year OS for AML. (B) Calibration plot of the nomogram for predicting the probability of OS at 1, 3, and 5 years. |
Validation of Prognostic Gene Expression by Clinical Samples
To verify the expression level of DUSP23 between AML patients and healthy controls, qPT-PCR was detected in our cohort. The results showed that DUSP23 was significantly higher in AML patients than in healthy controls, which was consistent with the TCGA and GEO databases. (P= 0.0024; Figure 6A). Patients were then divided into high and low expression groups based on the cut-off value of DUSP23 mRNA expression. As expected, individuals with high DUSP23 expression showed poor survival compared to those with low expression (P = 0.0337; Figure 6B), as shown by the K-M statistic.
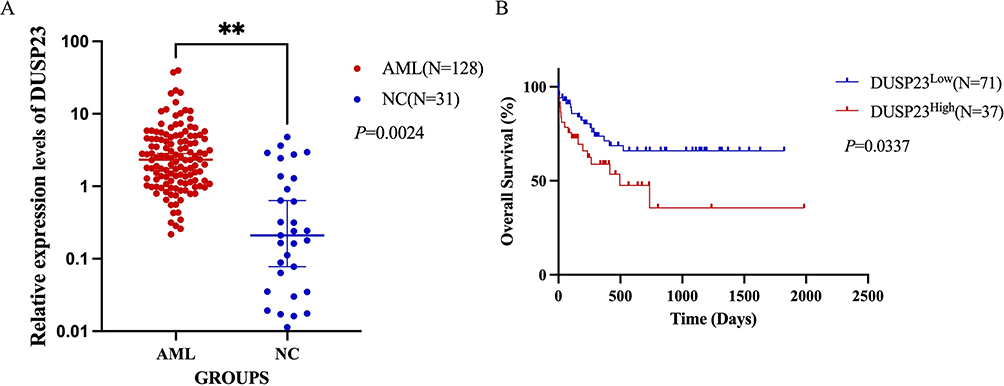 |
Figure 6 Quantitative real-time PCR results of DUSP23 expression. (A) qPT-PCR of DUSP23 (B) The overall survival analysis of DUSP23 related to AML patients (**P < 0.01). |
Notably, patients with higher DUSP23 expression had markedly higher WBC counts than those with lower DUSP23 expression (P = 0.026; Table 1). Univariate Cox proportional hazards regression was used to assess factors influencing OS. The results showed that high DUSP23 expression (P = 0.038), consolidation (P < 0.001) and age > 60 years (P = 0.013) were predictive factors for worse OS (Table 4). Subsequent multivariate Cox regression analysis including age, consolidation and DUSP23 expression showed that consolidation (P = 0.015) and high DUSP23 expression (P = 0.042) were independent prognostic factors for worse OS (P < 0.05). These findings highlight the potential of DUSP23 as a valuable prognostic indicator for survival in AML.
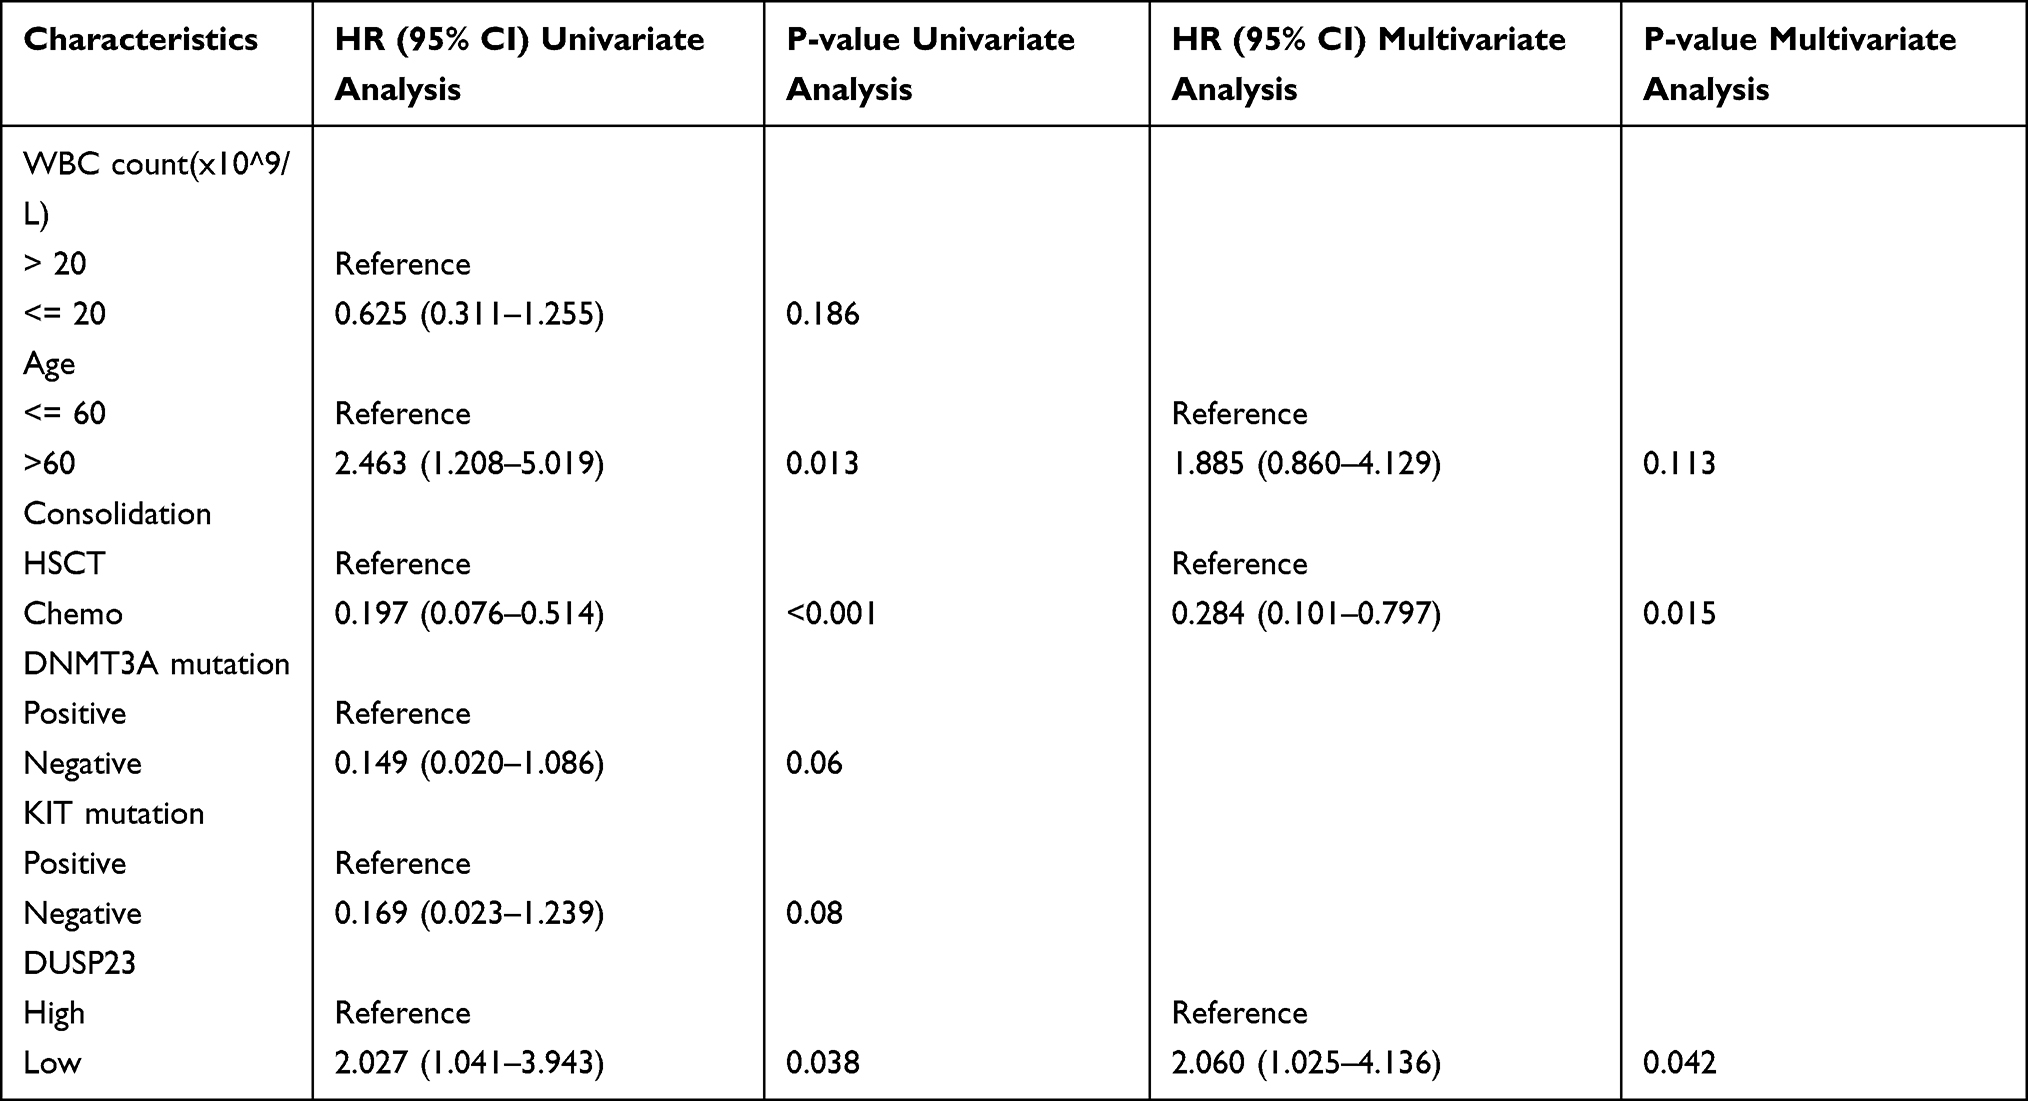 |
Table 4 Univariate and Multivariate Analysis of the Prognostic Significance of DUSP23 in AML |
Biological Function Enrichment of the DUSP23 Gene in AML
Next, the gene expression profiles of high- and low-DUSP23 expression groups were utilized to further explore the biological function of DUSP23 in AML. There were 435 DEGs between high- and low-DUSP23 expression groups, including 141 up-regulated and 294 down-regulated genes (|log fold change (logFC)| > 1.5, P < 0.05) (Figure 1A). The top ten up- and down-regulated DEGs between the groups were presented in the heat map (Figure 1B).
To gain insights into the functional implications of the 435 DEGs concerning DUSP23 expression levels in AML, GO and KEGG functional enrichment analyses were performed. The target genes showed statistical significance in the GO terms related to biological processes such as embryonic organ development, regionalization, and morphogenesis, molecular functions including DNA-binding transcription activator activity, DNA-binding transcription activator activity/RNA polymerase II-specific, and carbohydrate binding, and cellular components such as collagen-containing extracellular matrix, endoplasmic reticulum lumen, and collagen trimer. The DEGs were found to be enriched in the KEGG pathways such as Staphylococcus aureus infection, complement, and coagulation cascades (Supplementary Figure 2).
Finally, GSEA enrichment analysis results show that DUSP23 may be related to multiple signaling pathways in hematological tumors, including BCR signaling, MAPK pathway, RAS regulation, PTEN regulation, HEDGEHOG signaling, WNT signaling, MYC pathway, and TP53 regulation (Figure 7A–H and Supplementary Table 1).
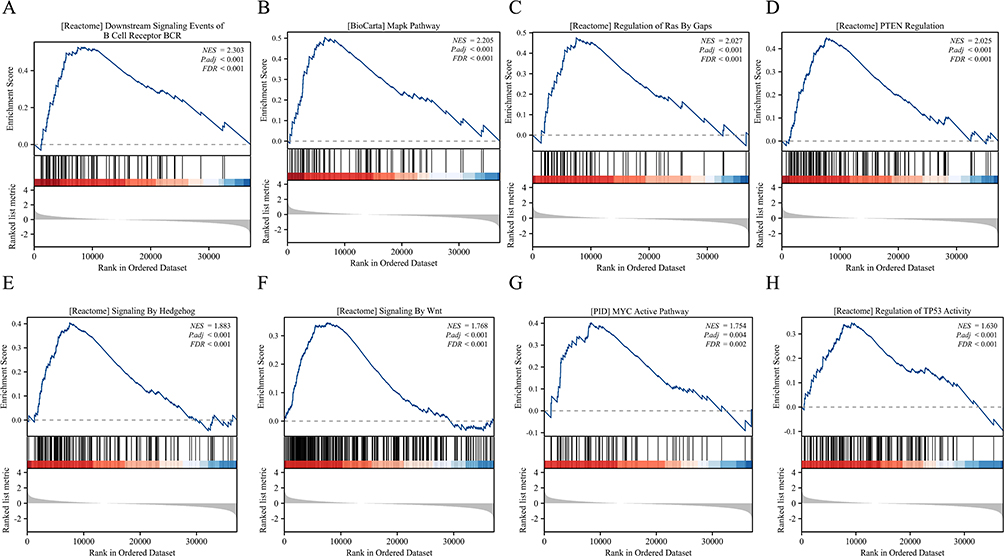 |
Figure 7 Enrichment plots from the gene set enrichment analysis (GSEA). (A–H) ES, enrichment score; NES, normalized ES; ADJ P- val, adjusted P-value. |
Identification of Hub Genes Associated with DUSP23 Expression
To perform a more in-depth analysis of the data, a PPI network related to DEGs was constructed and analyzed. The top 10 hub genes were identified using the maximal neighborhood component (MNC) and degree methods with the cytoHubba plug-in in Cytoscape (Figure 8A and B). It was discovered that nine hub genes were shared between the two gene lists, namely ATP5F1D, NDUFB7, POLR2L, MRPS12, MRPL2, UBA52, IMP3, UQCRQ, and MRPL4. Significant associations were found between DUSP23 and ATP5F1D (P < 0.001, correlation coefficient: 0.702), NDUFB7 (P < 0.001, correlation coefficient: 0.731), POLR2L (P < 0.001, correlation coefficient: 0.702), MRPS12 (P< 0.001, correlation coefficient: 0.780), MRPL2 (P < 0.001, correlation coefficient: 0.498), UBA52 (P < 0.001, correlation coefficient: 0.637), IMP3 (P < 0.001, correlation coefficient: 0.512), UQCRQ (P < 0.001, correlation coefficient: 0.591), and MRPL4 (P < 0.001, correlation coefficient: 0.708) (Figure 8C). Finally, the impact of hub gene levels on patient prognosis was examined, and it was discovered that IMP3, MRPL4, MRPS12, POLR2L, and ATP5F1D are closely linked to unfavorable clinical outcomes in individuals with AML (Figure 8D–H).
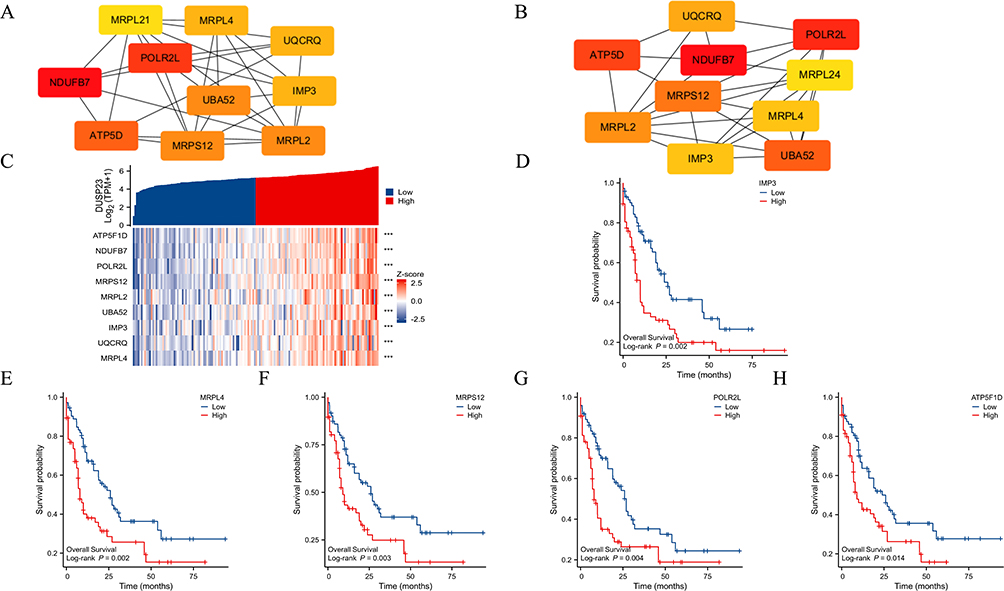 |
Figure 8 PPI network construction and clinical significance of hub genes. (A and B) The top 10 hub genes were selected based on (A) MNC and (B) degree. (C) The association of DUSP23 with nine hub genes (ATP5F1D, NDUFB7, POLR2L, MRPS12, MRPL2, UBA52, IMP3, UQCRQ, and MRPL4) (***P < 0.001). (D–H) The difference in OS between patients with high and low IMP3, MRPL4, MRPS12, POLR2L, and ATP5F1D expression levels is shown by Kaplan-Meier curves. |
Immune Infiltration Analysis in AML
In the AML microenvironment, a positive correlation was found between the expression level of DUSP23 and the number of various immune cells, including NK CD56 bright cells, NK cells, TFH, TReg, Eosinophils, NK CD56dim cells, aDC, CD8 T cells, Mast cells, Cytotoxic cells, Neutrophils, iDC, Macrophages, Th17 cells, Th1 cells, and DC, as revealed by the correlation analysis of immune cell infiltration quantified by SSGSEA. Particularly, a significant association with DUSP23 was exhibited by NK CD56 (bright) cells, indicating that DUSP23 may serve as a significant immune marker in AML (Figure 9).
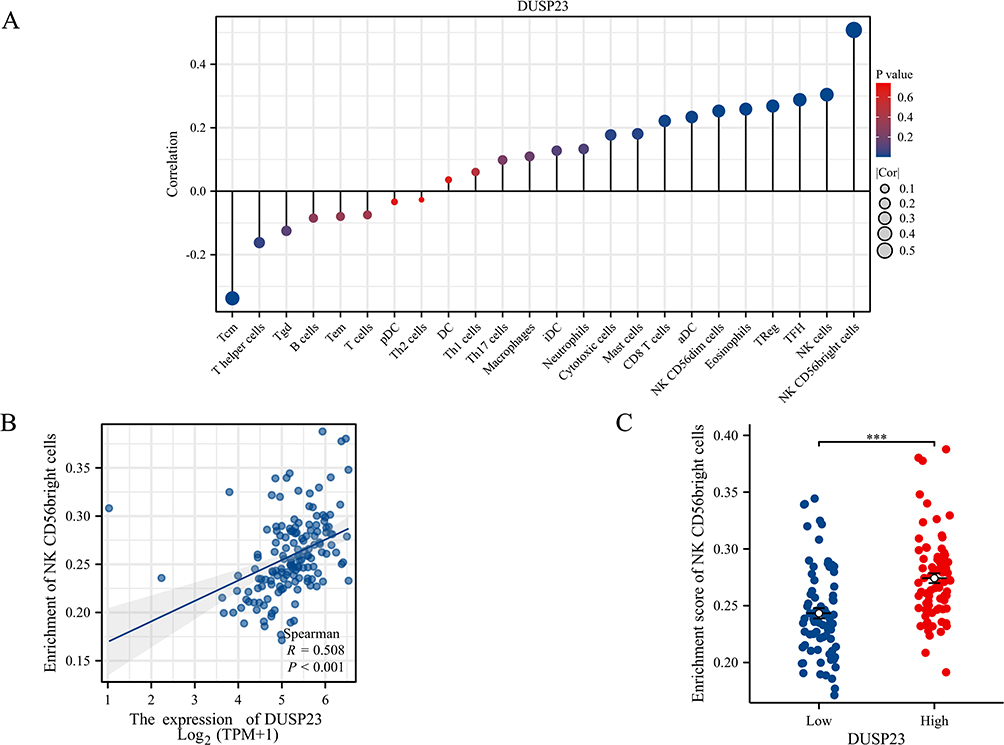 |
Figure 9 Correlation analysis between the level of DUSP23 expression and immune cell infiltration. (A) The relative contents of 24 kinds of immune cells in AML. (B) Correlation between the relative enrichment score of NK CD56(bright) cells and the expression level (TPM) of DUSP23. (C) Infiltration of NK CD56(bright) cells between low- and high-DUSP23 expressed (***P < 0.001). |
Discussion
The present study showed that the mRNA expression level of DUSP23 was significantly higher in AML patients than healthy controls, and DUSP23 high expression was an independent adverse prognostic factor for OS. In addition, The MAPK signaling pathways may be stimulated by increased DUSP23 expression levels, which may be important for the development of AML.
By exploring the association between DUSP23 gene expression levels and the main clinical features in TCGA-LAML cohorts, it was revealed that DUSP23 was significantly upregulated in AML patients. Notably, high levels of DUSP23 were associated with higher PB blast levels, intermediate/normal & poor cytogenetic risk, FLT3 mutation, and poor prognosis. FLT3 mutations are detected in approximately 30% of AML patients and are associated with unfavorable outcomes.25 Therefore, we speculate that abnormally high expression of DUSP23 may have a negative impact on the survival of AML patients.
qPT-PCR was further performed to validate the differential expression of DUSP23 in AML and healthy controls. The results revealed a significant upregulation of DUSP23 in AML patients, and poor survival was observed in those with high DUSP23 expression. Using multivariate Cox regression analysis, we identified high DUSP23 expression as an independent prognostic factor along with consolidation. Therefore, DUSP23 can be considered as a novel adverse prognostic factor in AML patients.
Furthermore, GSEA showed enrichment of MAPK, RAS, PTEN, WNT, MYC, and TP53 pathways. The MAPKs are a family of serine-threonine kinases that play a crucial role in regulating the proliferation and differentiation of both normal and malignant hematopoietic cells.26,27 MAPK contributes to the development of various cancers, such as colorectal, ovarian, and breast cancers, as well as AML.28–30 The molecular mechanisms responsible for maintaining a balance between activated RAS-GTP and inactive RAS-GDP are complex and involve multiple factors, including protein kinases, scaffolding proteins, phosphatases, GAPs, and GEFs.31 Mutations in genes encoding these components of the intricate network have been identified in inherited genetic syndromes called RASopathies, as well as in sporadic cancers, including AML. Notably, these mutations occur with a high frequency in juvenile myelomonocytic leukemia (JMML).32 PTEN is an important tumor suppressor gene frequently inactivated in human cancer. Its inactivation has been shown to have crucial roles in the generation of leukemia stem cells.33 In AML, mutations in hematopoietic stem/progenitor cells result in upregulated Wnt signaling through various mechanisms. Wnt signaling is crucial for maintaining leukemic stem cells.34 Although the impact of MYC protein expression in AML is not well understood, dysregulation of MYC has been implicated in AML. Most AML cases exhibit high levels of MYC protein, which is correlated with a worse prognosis.35 TP53, a frequently mutated tumor suppressor gene in human cancer, remains intact in most AML cases, suggesting potential for harnessing its physiological tumor-suppressive roles. Therefore, pharmacological activators of the TP53 pathway may offer clinical benefits in AML. Conversely, despite the lower frequency of TP53 mutations in AML compared to other cancers, TP53 mutations are associated with chemoresistance and a high risk of relapse.36 Thus, we speculated that the pathological mechanism of DUSP23 may be related to these signaling pathways.
In addition, through a series of rigorous screens, five hub genes that could accurately predict the prognosis of AML were found. IMP-3 binds to and promotes the translation of insulin-like growth factor II (IGF-II) mRNA among its many mRNA targets.37 Reports suggest that reducing IMP-3 levels through siRNA-mediated knockdown decreases the proliferation of human K562 chronic myeloid leukemia cells by reducing IGF-II biosynthesis.38 Similarly, inhibiting IMP-3 in AML may potentially reduce cell proliferation. MRPL4 has been identified as a high-risk factor for prostate cancer (PC) and a potential diagnostic biomarker.39 Additionally, MRPS12 has been implicated in ovarian cancer.40 Several reports indicate that POLR2L plays a significant role in PC, glioblastoma (GBM), and HBV-related hepatocellular carcinoma (HCC).41–43 Targeted specific demethylation of ATP5D m1A using the dm1ACRISPR system significantly enhances the expression of ATP5D and glycolysis in cancer cells. In vivo, data confirm the involvement of m1A/ATP5D in tumor growth and cancer progression.44 However, further experiments are required to verify the mechanism of action among these genes.
In the analysis of immune cell infiltration, higher levels of CD56 (bright) NK cells were found to be associated with high expression of DUSP23. CD56 (bright) NK cells, which are considered to be efficient cytokine producers with immunoregulatory properties, can also become cytotoxic upon appropriate activation and have been shown to play a role in various disease states, including cancer, autoimmunity, neuroinflammation, and infection.45,46 In this study, a positive correlation was observed between the infiltration of CD56 (bright) NK cells and the expression of DUSP23. Kaplan-Meier survival analysis indicated that poor prognosis in AML patients was associated with high expression of DUSP23. However, the relationship between CD56 (bright) NK cells and AML has not been fully clarified. Therefore, further exploration is required to elucidate the relationship between DUSP23 and CD56 (bright) cells and the potential involvement of DUSP23 and CD56 (bright) NK cells in immune escape in AML.
Our study revealed DUSP23 expression is higher in AML patients than healthy controls and high DUSP23 expression indicate a poor prognosis. Furthermore, we found that the potential biological function of DUSP23 in AML may be mediated by activation of MAPK signalling pathways. However, this was a retrospective follow-up study. To define the role of DUSP23 in AML more precisely, further research with a larger sample size of AML is needed. In addition, the mechanism of DUSP23 in AML needs to be confirmed in the future.
Conclusion
Our findings have revealed that an unfavorable impact on the OS of AML patients was observed in cases where the gene DUSP23 was highly expressed. In addition, high levels of DUSP23 were identified as an independent predictor of poor prognosis in AML patients.
Abbreviations
DUSP23, Dual-specificity Phosphatase 23; AML, acute myeloid leukemia; TCGA, the Cancer Genome Atlas; GTEx, Genotype-Tissue Expression; DEGs, differentially expressed genes; OS, overall survival; GO, gene ontology; KEGG, Kyoto encyclopedia of genes and genomes; GSEA, gene set enrichment analysis; PPI, protein-protein interaction; STRING, Search Tool for the Retrieval of Interacting Genes; ATRA, all-trans retinoic acid; ATO, arsenic trioxide; C-index, concordance index; AUC, area under the curve; WBC, white blood cell; MNC, the maximal neighborhood component; qRT-PCR, Quantitative real-time PCR; IGF-II, insulin-like growth factor II; JMML, juvenile myelomonocytic leukemia; PC, prostate cancer; GBM, Glioblastoma; HCC, HBV-related hepatocellular carcinoma.
Data Sharing Statement
The databases generated and/or analysed during the current study are available in the GEO, TCGA, and GETx repository, https://portal.gdc.cancer.gov; https://xenabrowser.net/datapages/; https://www.ncbi.nlm.nih.gov/geo/.
Ethics Approval and Informed Consent
This study was conducted in accordance with the Declaration of Helsinki. This study was conducted under the approval of the Ethics Committee of the Affiliated People’s Hospital of Ningbo University. All methods were carried out in accordance with relevant guidelines and regulations. (Approval NO.: the Affiliated People’s Hospital of Ningbo University Ethics review 2023-research-107).
Author Contributions
Each author has carefully reviewed and endorsed the final manuscript. They have collectively contributed significantly to various aspects of the research, including conception, study design, execution, data acquisition, analysis, and interpretation. All authors actively participated in drafting, revising, and critically reviewing the article. They have provided final approval for the version submitted for publication, unanimously agreed on the selected journal, and committed to being accountable for all facets of the work.
Funding
This work was supported by Ningbo Science and Technology Project (2022J028), and Ningbo Medical & Health Leading Academic Discipline Project, Project Number: 2022-S05.
Disclosure
The authors declare that they have no competing interests in this work.
References
1. Gu Y, Chu M-Q, Xu Z-J, et al. Comprehensive analysis of SPAG1 expression as a prognostic and predictive biomarker in acute myeloid leukemia by integrative bioinformatics and clinical validation. BMC Med Genomics. 2022;15(1):38. doi:10.1186/s12920-022-01193-0
2. Li G, Gao Y, Li K, Lin A, Jiang Z. Genomic analysis of biomarkers related to the prognosis of acute myeloid leukemia. Oncol Lett. 2020;20(2):1824–1834. doi:10.3892/ol.2020.11700
3. Chen S, Wang C, Zhu R, Zhu S, Zhang G. Predicting prognosis in acute myeloid leukemia patients by surface-enhanced Raman spectroscopy. Nanomedicine. 2021;16(21):1873–1885. doi:10.2217/nnm-2021-0199
4. Li F, Ling Q, Lian J, et al. Dihydropyrimidinase-like 2 can serve as a novel therapeutic target and prognostic biomarker in acute myeloid leukemia. Cancer Med. 2023;12(7):8319–8330. doi:10.1002/cam4.5531
5. Li F, Ling Q, Hu C, et al. Characterization of the Newly Established Homoharringtonine- (HHT-) resistant cell lines and mechanisms of resistance. J Oncol. 2022;2022:2813938. doi:10.1155/2022/2813938
6. Moser KL, Neas BR, Salmon JE, et al. Genome scan of human systemic lupus erythematosus: evidence for linkage on chromosome 1q in African-American pedigrees. Proc Natl Acad Sci U S A. 1998;95(25):14869–14874. doi:10.1073/pnas.95.25.14869
7. Wu Q, Li Y, Gu S, et al. Molecular cloning and characterization of a novel dual-specificity phosphatase 23 gene from human fetal brain. Int J Biochem Cell Biol. 2004;36(8):1542–1553. doi:10.1016/j.biocel.2003.12.014
8. Vivian J, Rao AA, Nothaft FA, et al. Toil enables reproducible, open source, big biomedical data analyses. Nat Biotechnol. 2017;35(4):314–316. doi:10.1038/nbt.3772
9. Li K, Luo H, Luo H, Zhu X. Clinical and prognostic pan-cancer analysis of m6A RNA methylation regulators in four types of endocrine system tumors. Aging. 2020;12(23):23931–23944. doi:10.18632/aging.104064
10. Goldman MJ, Craft B, Hastie M, et al. Visualizing and interpreting cancer genomics data via the Xena platform. Nat Biotechnol. 2020;38(6):675–678. doi:10.1038/s41587-020-0546-8
11. Wang J-D, Zhou H-S, Tu X-X, et al. Prediction of competing endogenous RNA coexpression network as prognostic markers in AML. Aging. 2019;11(10):3333–3347. doi:10.18632/aging.101985
12. Zhuang H, Li F, Si T, et al. High expression of CD300A predicts poor survival in acute myeloid leukemia. Acta Haematol. 2023;146(3):196–205. doi:10.1159/000529078
13. Verhaak RG, Wouters BJ, Erpelinck CA, et al. Prediction of molecular subtypes in acute myeloid leukemia based on gene expression profiling. Haematologica. 2009;94(1):131–134. doi:10.3324/haematol.13299
14. de Jonge HJ, Valk PJ, Veeger NJ, et al. High VEGFC expression is associated with unique gene expression profiles and predicts adverse prognosis in pediatric and adult acute myeloid leukemia. Blood. 2010;116(10):1747–1754. doi:10.1182/blood-2010-03-270991
15. Zhou T, Cai Z, Ma N, et al. A novel ten-gene signature predicting prognosis in hepatocellular carcinoma. Front Cell Dev Biol. 2020;8:629. doi:10.3389/fcell.2020.00629
16. Infante MS, Piris M, Hernández-Rivas J. Alteraciones moleculares en leucemia mieloide aguda y sus implicaciones clínicas y terapéuticas [Molecular alterations in acute myeloid leukemia and their clinical and therapeutical implications]. Med Clin. 2018;151(9):362–367.Spanish. doi:10.1016/j.medcli.2018.05.002
17. Grimwade D, Jovanovic JV, Hills RK, et al. Prospective minimal residual disease monitoring to predict relapse of acute promyelocytic leukemia and to direct pre-emptive arsenic trioxide therapy. J Clin Oncol. 2009;27(22):3650–3658. doi:10.1200/jco.2008.20.1533
18. Liu J, Lichtenberg T, Hoadley KA, et al. An integrated TCGA pan-cancer clinical data resource to drive high-quality survival outcome analytics. Cell. 2018;173(2):400–416.e11. doi:10.1016/j.cell.2018.02.052
19. Love MI, Huber W, Anders S. Moderated estimation of fold change and dispersion for RNA-seq data with DESeq2. Genome Biol. 2014;15(12):550. doi:10.1186/s13059-014-0550-8
20. Robinson MD, McCarthy DJ, Smyth GK. edgeR: a Bioconductor package for differential expression analysis of digital gene expression data. Bioinformatics. 2010;26(1):139–140. doi:10.1093/bioinformatics/btp616
21. Rosenthal R, Cadieux EL, Salgado R, et al. Neoantigen-directed immune escape in lung cancer evolution. Nature. 2019;567:
22. Shannon P, Markiel A, Ozier O, et al. Cytoscape: a software environment for integrated models of biomolecular interaction networks. Genome Res. 2003;13(11):2498–2504. doi:10.1101/gr.1239303
23. Hänzelmann S, Castelo R, Guinney J. GSVA: gene set variation analysis for microarray and RNA-seq data. BMC Bioinf. 2013;14:7. doi:10.1186/1471-2105-14-7
24. Bindea G, Mlecnik B, Tosolini M, et al. Spatiotemporal dynamics of intratumoral immune cells reveal the immune landscape in human cancer. Immunity. 2013;39(4):782–795. doi:10.1016/j.immuni.2013.10.003
25. Gilliland DG, Griffin JD. The roles of FLT3 in hematopoiesis and leukemia. Blood. 2002;100(5):1532–1542. doi:10.1182/blood-2002-02-0492
26. Raman M, Chen W, Cobb MH. Differential regulation and properties of MAPKs. Oncogene. 2007;26(22):3100–3112. doi:10.1038/sj.onc.1210392
27. Geest CR, Coffer PJ. MAPK signaling pathways in the regulation of hematopoiesis. J Leukoc Biol. 2009;86(2):237–250. doi:10.1189/jlb.0209097
28. Soleimani A, Rahmani F, Saeedi N, et al. The potential role of regulatory microRNAs of RAS/MAPK signaling pathway in the pathogenesis of colorectal cancer. J Cell Biochem. 2019;120(12):19245–19253. doi:10.1002/jcb.29268
29. Long X, Song K, Hu H, et al. Long non-coding RNA GAS5 inhibits DDP-resistance and tumor progression of epithelial ovarian cancer via GAS5-E2F4-PARP1-MAPK axis. J Exp Clin Cancer Res. 2019;38(1):345. doi:10.1186/s13046-019-1329-2
30. Zhang Y, Yang WK, Wen GM, et al. High expression of PRKDC promotes breast cancer cell growth via p38 MAPK signaling and is associated with poor survival. Mol Genet Genomic Med. 2019;7(11):e908. doi:10.1002/mgg3.908
31. Simanshu DK, Nissley DV, McCormick F. RAS proteins and their regulators in human disease. Cell. 2017;170(1):17–33. doi:10.1016/j.cell.2017.06.009
32. Ratner N, Miller SJ. A RASopathy gene commonly mutated in cancer: the neurofibromatosis type 1 tumour suppressor. Nat Rev Cancer. 2015;15(5):290–301. doi:10.1038/nrc3911
33. Martelli AM, Evangelisti C, Chappell W, et al. Targeting the translational apparatus to improve leukemia therapy: roles of the PI3K/PTEN/Akt/mTOR pathway. Leukemia. 2011;25(7):1064–1079. doi:10.1038/leu.2011.46
34. Gruszka AM, Valli D, Alcalay M. Wnt signalling in acute myeloid leukaemia. Cells. 2019;8(11):1403.
35. Chen P, Redd L, Schmidt Y, et al. MYC protein expression does not correlate with MYC abnormalities detected by FISH but predicts an unfavorable prognosis in de novo acute myeloid leukemia. Leuk Res. 2021;106:106584. doi:10.1016/j.leukres.2021.106584
36. Barbosa K, Li S, Adams PD, Deshpande AJ. The role of TP53 in acute myeloid leukemia: challenges and opportunities. Genes Chromosomes Cancer. 2019;58(12):875–888. doi:10.1002/gcc.22796
37. Liao B, Hu Y, Brewer G. RNA-binding protein insulin-like growth factor mRNA-binding protein 3 (IMP-3) promotes cell survival via insulin-like growth factor II signaling after ionizing radiation. J Biol Chem. 2011;286(36):31145–31152. doi:10.1074/jbc.M111.263913
38. Liao B, Hu Y, Herrick DJ, Brewer G. The RNA-binding protein IMP-3 is a translational activator of insulin-like growth factor II leader-3 mRNA during proliferation of human K562 leukemia cells. J Biol Chem. 2005;280(18):18517–18524. doi:10.1074/jbc.M500270200
39. Fu Q, Hong R, Zhou H, et al. Proteomics reveals MRPL4 as a high-risk factor and a potential diagnostic biomarker for prostate cancer. Proteomics. 2022;22(21):e2200081. doi:10.1002/pmic.202200081
40. Qiu X, Guo D, Du J, Bai Y, Wang F. A novel biomarker, MRPS12 functions as a potential oncogene in ovarian cancer and is a promising prognostic candidate. Medicine. 2021;100(8):e24898. doi:10.1097/md.0000000000024898
41. Cui X, Li C, Ding J, et al. Establishing a proteomics-based signature of AKR1C3-related genes for predicting the prognosis of prostate cancer. Int J Mol Sci. 2023;24(5):4513.
42. Jin S, Qian Z, Liang T, et al. Identification of a DNA repair-related multigene signature as a novel prognostic predictor of glioblastoma. World Neurosurg. 2018;117:e34–e41. doi:10.1016/j.wneu.2018.05.122
43. Li M, Liu Z, Wang J, et al. Systematic analysis identifies a specific RNA-binding protein-related gene model for prognostication and risk-adjustment in HBV-related hepatocellular carcinoma. Front Genet. 2021;12:707305. doi:10.3389/fgene.2021.707305
44. Wu Y, Chen Z, Xie G, et al. RNA m(1)A methylation regulates glycolysis of cancer cells through modulating ATP5D. Proc Natl Acad Sci U S A. 2022;119(28):e2119038119. doi:10.1073/pnas.2119038119
45. Michel T, Poli A, Cuapio A, et al. Human CD56bright NK cells: an update. J Immunol. 2016;196(7):2923–2931. doi:10.4049/jimmunol.1502570
46. Lima M. Extranodal NK/T cell lymphoma and aggressive NK cell leukaemia: evidence for their origin on CD56+bright CD16-/+dim NK cells. Pathology. 2015;47(6):503–514. doi:10.1097/pat.0000000000000275
 © 2024 The Author(s). This work is published and licensed by Dove Medical Press Limited. The full terms of this license are available at https://www.dovepress.com/terms.php and incorporate the Creative Commons Attribution - Non Commercial (unported, v3.0) License.
By accessing the work you hereby accept the Terms. Non-commercial uses of the work are permitted without any further permission from Dove Medical Press Limited, provided the work is properly attributed. For permission for commercial use of this work, please see paragraphs 4.2 and 5 of our Terms.
© 2024 The Author(s). This work is published and licensed by Dove Medical Press Limited. The full terms of this license are available at https://www.dovepress.com/terms.php and incorporate the Creative Commons Attribution - Non Commercial (unported, v3.0) License.
By accessing the work you hereby accept the Terms. Non-commercial uses of the work are permitted without any further permission from Dove Medical Press Limited, provided the work is properly attributed. For permission for commercial use of this work, please see paragraphs 4.2 and 5 of our Terms.