")
Back to Journals » Vascular Health and Risk Management » Volume 19
RGS5 as a Biomarker of Pericytes, Involvement in Vascular Remodeling and Pulmonary Arterial Hypertension
Authors Lu G, Du R , Liu Y, Zhang S, Li J, Pei J
Received 31 July 2023
Accepted for publication 12 October 2023
Published 20 October 2023 Volume 2023:19 Pages 673—688
DOI https://doi.org/10.2147/VHRM.S429535
Checked for plagiarism Yes
Review by Single anonymous peer review
Peer reviewer comments 2
Editor who approved publication: Dr Harry Struijker-Boudier
Guofang Lu,1,2,* Rui Du,3,* Yali Liu,1 Shumiao Zhang,1 Juan Li,1 Jianming Pei1
1Department of Physiology and Pathophysiology, National Key Discipline of Cell Biology, Fourth Military Medical University, Xi’an, 710032, People’s Republic of China; 2State Key Laboratory of Holistic Integrative Management of Gastrointestinal Cancers and National Clinical Research Center for Digestive Diseases, Xijing Hospital of Digestive Diseases, Fourth Military Medical University, Xi’an, 710032, People’s Republic of China; 3Institute for Biomedical Sciences of Pain, Tangdu Hospital, Fourth Military Medical University, Xi’an, 710038, People’s Republic of China
*These authors contributed equally to this work
Correspondence: Juan Li; Jianming Pei, Email [email protected]; [email protected]
Introduction: Pulmonary arterial hypertension (PAH) is a life-threatening disease characterized by a sustained rise in mean pulmonary artery pressure. Pulmonary vascular remodeling serves an important role in PAH. Identifying a key driver gene to regulate vascular remodeling of the pulmonary microvasculature is critical for PAH management.
Methods: Differentially expressed genes were identified using the Gene Expression Omnibus (GEO) GSE117261, GSE48149, GSE113439, GSE53408 and GSE16947 datasets. A co-expression network was constructed using weighted gene co-expression network analysis. Novel and key signatures of PAH were screened using four algorithms, including weighted gene co-expression network analysis, GEO2R analysis, support vector machines recursive feature elimination and robust rank aggregation rank analysis. Regulator of G-protein signaling 5 (RGS5), a pro-apoptotic/anti-proliferative protein, which regulate arterial tone and blood pressure in vascular smooth muscle cells. The expression of RGS5 was determined using reverse transcription-quantitative PCR (RT-qPCR) in PAH and normal mice. The location of RGS5 and pericytes was detected using immunofluorescence.
Results: Compared with that in the normal group, RGS5 expression was upregulated in the PAH group based on GEO and RT-qPCR analyses. RGS5 expression in single cells was enriched in pericytes in single-cell RNA sequencing analysis. RGS5 co-localization with pericytes was detected in the pulmonary microvasculature of PAH.
Conclusion: RGS5 regulates vascular remodeling of the pulmonary microvasculature and the occurrence of PAH through pericytes, which has provided novel ideas and strategies regarding the occurrence and innovative treatment of PAH.
Keywords: pulmonary arterial hypertension, pericytes, RGS5, pulmonary microvasculature, vascular remodeling
Introduction
Pulmonary arterial hypertension (PAH) is a life-threatening disease characterized by a sustained rise in mean pulmonary artery pressure1,2 due to increased pulmonary vascular resistance. PAH symptoms are nonspecific but usually include dyspnea and fatigue during exertion. If untreated, PAH typically progresses to progressive small vessel loss, lack of compensatory pulmonary angiogenesis,3 right ventricular hypertrophy and remodeling4 with outcomes of right ventricular failure5 and death (5-year survival, 59%).6 The pathophysiological mechanism of PAH remains unclear, and pulmonary endothelial cell dysfunction serves an important role in disease progression.7 Uncontrolled growing endothelium mainly affects precapillary vessels with a diameter of 50–500 μm4 and is involved in the formation of in situ thrombi.8 Known vascular pathologies include arterial intimal remodeling (vascular remodeling, a dynamic process in response to alveolar hypoxia), a pathological change that results in increased pulmonary vascular resistance due to hypertrophy or proliferation, followed by increased mean pulmonary artery pressure, and is recognized as a complication of several pulmonary and cardiovascular diseases,9 plexiform lesions, and fragmentation of the elastic lamina.10
Pulmonary vascular remodeling is a complex pathological process (exhibiting positive feedback regulation with pulmonary vascular pressure, prevalent in human PAH and animal disease models11) characterized by the involvement of the full-thickness arterial wall (adventitia, media and intima), and is specifically manifested by the proliferation and migration of fibrotic cells in the pulmonary artery smooth muscle and adventitia, and intimal and medial thickening of the pulmonary arteries,12 involving the accumulation of pericytes and resulting in lumen occlusion.13 In addition, loss of precapillary arteries, vascular infiltration by inflammatory cells14 and physiochemical stimuli (mechanical pulling forces, stress vs shear forces, chronic hypoxia due to multiple factors, etc.) are complementary features.11 Current PAH therapies primarily target the endothelin, nitric oxide and prostacyclin pathways to address pulmonary vasoconstriction15 but do not specifically target pulmonary vascular remodeling, and there is an urgent need to identify related pathological mechanisms to support innovative therapies aimed at reversing microvascular pathological alterations and regenerating normal microvessels.
Pericytes are key central factors regulating vascular homeostasis and circulation16 and act in concert with endothelial and smooth muscle cells in PAH. Yuan et al17 have reported that vascular remodeling mediated by pericyte pro-inflammatory and pro-fibrotic phenotypes is an important manifestation of PAH. However, it remains unreported for pericytes to promote high arteriogenesis by regulating vascular remodeling. Regulator of G-protein signaling 5 (RGS5), as one of the RGS family proteins, not only accelerates G protein deactivation18 but also inhibits signaling downstream of G protein-coupled receptors,19 thereby fine-tuning pericyte motility in vessel growth and stabilization. However, to the best of our knowledge, the role and mechanism of RGS5 in PAH have not yet been elucidated.
In the present study, the co-expression network was identified and constructed using GSE117261 and weighted gene co-expression network analysis (WGCNA). The differentially expressed genes (DEGs) were then identified and screened via WGCNA using the Gene Expression Omnibus (GEO) database, including the GSE117261, GSE48149, GSE53408 and GSE113439 datasets. Furthermore, the relationship between the module genes and immune cell infiltration was analyzed. The present study also examined the expression of RGS5 in single cells using single-cell RNA sequencing (scRNA-seq) analysis and verified the levels of RGS5 using reverse transcription-quantitative PCR (RT-qPCR) in PAH and normal mice. In addition, the expression and co-location of RGS5 and pericytes in PAH were determined using immunofluorescence staining. The results highlighted RGS5 as a marker gene for peripheral cells, which is a directional target gene for vascular remodeling in pulmonary capillary endothelial cells during PAH pathological progression.
Materials and Methods
Dataset Collection
The data analysis procedures of the present study are shown in Figure 1. The original microarray datasets (GEO series GSE117261, GSE48149, GSE113439 and GSE53408, Supplementary Table 1) were downloaded from National Center of Biotechnology Information-GEO, which is an international public repository for microarray data. Based on the GPL6244 platform, GSE11726120 includes 32 cases of PAH and 12 control case lung tissues. According to Renaud et al,21 GSE48149 contains 8 PAH and 9 control lung tissues. GSE11343922 contains 6 PAH and 11 control lung tissues, based on the GPL6244 platform. According to Zhao et al,23 GSE53408 contains 12 PAH and 11 control lung tissues. GEO provided the annotation files for GPL6244 and GPL16221. The average expression value of all the probes for a gene with multiple probe IDs measured was calculated. Furthermore, the GEO series was used for validation of signature expression levels. Additionally, scRNA-seq data (GSE169471, Supplementary Table 1) were analyzed to determine the cell populations that express key biomarkers in PAH compared with controls. Saygin et al24 analyzed 3 PAH lung tissues from patients and 9 control lung tissues for GSE169471. The clinical information of these datasets is summarized in Supplementary Table 1. Prior to formal analysis, quality control analyses and pre-processing of microarray data were performed in R using the Bioconductor package.25 We followed the methods of Jinling Xu et al 2022.26
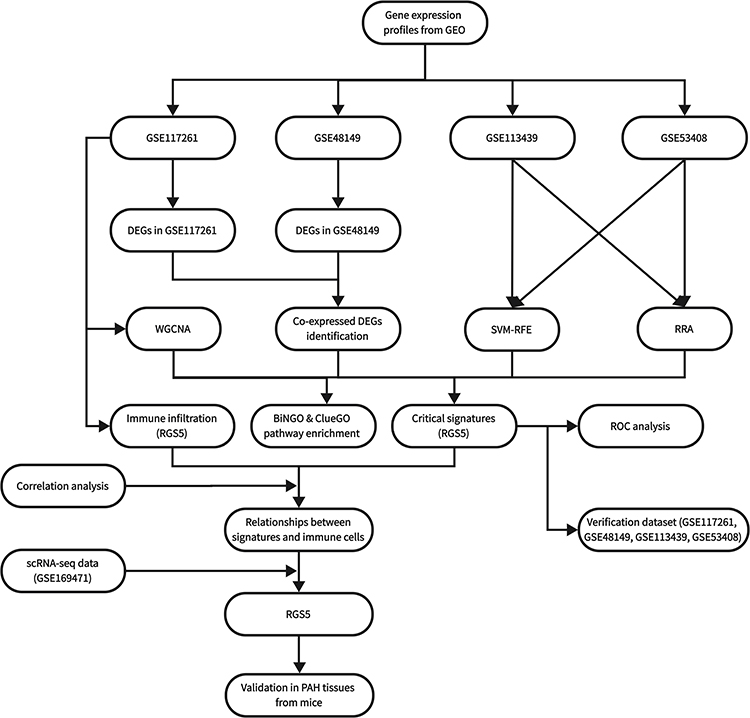 |
Figure 1 Flowchart of the study. |
Co-Expression Network Construction
WGCNA was performed after visualizing and plotting the principal component analysis (PCA) of genes expressed across all samples in GSE117261 using the R software factoextra V1.0.7 package. A co-expression network of the gene expression dataset GSE117261 was constructed using the “WGCNA” V1.71 package in R software. After screening using the WGCNA algorithm and sorting by median absolute deviation, 5000 genes were retained for pick Soft Threshold function. A scale-free topology fit index of 0.9 was used to determine an appropriate soft threshold power. Filtered gene expression data were processed using the power adjacent function of Pearson’s correlation matrix to convert data into a topological overlap matrix (TOM), and the corresponding dissimilarity (1-TOM) was calculated. Genes with similar expression profiles were merged into the same modules using the DynamicTreeCut algorithm (cutHeight, 0.25; deepSpilt, 0.2; minModularSize, 100).
Functional Enrichment Analysis of DEGs
To explore the functions and pathways of the overlapping DEGs in WGCNA within GSE117261, functional enrichment analysis was conducted using Cytoscape V3.7.2, the ClueGO V2.5.9 package (significance cut-off, P < 0.05; Min GO Level, 3; Kappa Score Threshold, 0.4; Correction Method Used, Bonferroni step down)30 and the BiNGO package V3.0.5 (significance cut-off, P < 0.05; Hypergeometric test with Benjamini&Hochberg False Discovery Rate correction).31 For all overlapping DEGs, Gene Ontology (GO) term [biological process (BP); cellular component (CC); and molecular function (MF)] analysis was conducted and visualized.
Identification of DEGs
Using the R Bioconductor package limma (V3.46.0),32 DEGs were identified using difference expression analysis. Benjamini-Hochberg false discovery rate correction was applied to adjust P-values, and DEGs with a log2 fold change of 1 were identified. Volcano plots were generated using the R software ggplot2 V3.3.5 package,33 heatmaps for co-selected DEGs from each dataset were plotted using the R software Pheatmap V1.0.12 package34 and the Venn diagram was drawn using the R software VennDiagram V1.6.20 package.35
Screening and Validation of Critical Gene Signatures
Novel and key signatures of PAH were screened using four algorithms, including WGCNA,36 GEO2R analysis,37 Support vector machines Recursive Feature Elimination (SVM-RFE)38 and Robust Rank Aggreg (RRA) rank analysis.39 To further analyze the overlapping genes, two classification models were identified. Receiver operating characteristic (ROC) curves and the area under the curve (AUC) were calculated using the R software pROC V1.18.0 package40 to evaluate the diagnostic value of signatures for PAH. P < 0.05 (two-sided) was considered to indicate a statistically significant difference. As part of an in-depth validation of the accuracy of key biomarkers, GSE117261, GSE48149, GSE113439 and GSE53408 were used to compare gene signature expression between the PAH and control groups.
Determination, Evaluation and Correlation Analysis of Infiltrated Immune Cells
An analysis of 22 immune cell types was performed using CIBERSORT and the GSE117261 dataset. A P-value of 0.05 was applied to calculate the relative abundance of immune cells infiltrated into the tissue, and then the correlation heatmap of infiltrated immune cells was visualized using R software corrplot V0.92. Infiltration of immune cells was next compared between the PAH and control groups using a Wilcoxon rank sum test. Subsequently, biomarkers and infiltrating immune cells were examined using Spearman correlation analysis. Visualization was performed using the ggstatsplot V0.9.1 package provided with R software.
scRNA-Seq Data Analysis
Cellranger (10X Genomics) processed.h5 data of GSE169471 from the GEO database. These data were imported in R and analyzed using the Seurat V4.2.0 package.41 To begin with, quality control was carried out by eliminating cells with gene counts within 200 and 6000 and mitochondrial gene percentages <30%. The data were then normalized using the NormalizeData function. Using the “vst” method in FindVariableFeatures, the top 2000 genes with variable expression were selected for downstream analysis. Using ScaleData, the data were scaled before PCA. After PCA, cluster analysis and Uniform Manifold Approximation and Projection (UMAP) dimensional reduction, RunPCA, FindClusters and RunUMAP functions were applied. As a result, the cell clusters were visualized using the UMAP plots displayed by DimPlot. The Model-based Analysis of Single Cell Transcriptomics V1.20.0 package was used to determine different expression of signatures. Violin plots were drawn using the VlnPlot function. As an additional step, the R software Single-Cell RNA-Seq Annotation V1.8.1 package42 was utilized to annotate cell types, and the celldex V1.4.0 package was used to download the BlueprintEncodeData reference.
PAH Animal Model Construction
The PAH animal model was constructed by hypoxic exposure. Briefly, mice (6 to 8 weeks old, 21–25 g) were randomly divided into control group (mice were maintained under normal conditions) and hypoxic group. The mice in hypoxic group were kept in the self-made automatic low-pressure and low-oxygen chamber and exposed to a hypoxic environment (50 kPa; 10% oxygen) for 8 h every day. Mice in the hypoxic group were exposed to hypoxia for 3 weeks, and mice were anesthetized by inhalation of 2–5% isoflurane for 5 min. Finally, lung tissues were fixed in the formalin, embedded in paraffin, sectioned, and stained with Immunofluorescence.43
Immunofluorescence
Mouse arterial tissue slices were obtained from samples embedded in paraffin. For immunofluorescence staining according to the manufacturer’s instructions, the samples were incubated overnight at 4°C, and stained with RGS5 polyclonal antibody (1:100; sc-514184; Santa Cruz Biotechnology, Inc., Dallas, TX, USA) and a CD31 polyclonal secondary antibody (1:400; GB11063-1; Wuhan Servicebio Technology Co., Ltd., Wuhan, China). Slides were counterstained with DAPI. Finally, images were acquired using a fluorescence microscope (Rueil-Malmaison).
RT-qPCR
Total RNA was extracted using TRIzol (Invitrogen; Thermo Fisher Scientific, Inc., Waltham, MA, USA), and reverse transcription was performed using an Advantage RT-for-PCR kit (Takara Bio, Inc., Otsu, Japan) according to the manufacturer’s instructions. qPCR was conducted using a SYBR Premix Pro Taq HS qPCR kit (Accurate Biotechnology, Hunan, China) and a CFX96™ real-time PCR detection system (Bio-Rad Laboratories, Inc., Hercules, CA, USA). The 2−ΔΔCq method was used to analyze the relative expression levels. The primer sequences were as follows: RGS5 forward, AAGTTGGGAATTCTCCTCCAG and reverse, TTCCTCACTGAATTCAGACTTC; and β-actin forward, CAACCGTGAAAAGATGACCC and reverse, ATGAGGTAGTCTGTCAGGTC.
Statistical Analysis
RT-PCR data for mice were presented as the mean ± SEM. Unpaired t-tests were used to compare two groups. P < 0.05 was considered to indicate a statistically significant difference. Statistical analyses and graphing were performed using GraphPad Prism V9.0.0 software (Prism 9 for Windows; Dotmatics, Boston, MA, USA).
Results
Co-Expression Network Construction and Identification of Significant Modules
PCA of the samples in GSE117261 was first performed. The results indicated that samples of different groups were well separated (Figure 2A). The co-expression network was constructed by WGCNA. The gene expression profiles of whole lung tissue cells from 42 participants with PAH (n = 30) or control (n = 12) in the GSE117261 dataset were obtained. A total of 5000 genes and 42 samples were clustered using the average linkage method and the Pearson’s correlation method. The final power of 6 was chosen as the soft-thresholding parameter to ensure that the network was scale-free (Figure 2B). A total of 10 modules were identified (Figure 2C) and the gray module containing genes that could not be clustered into other modules was discarded (Figure 2D). Furthermore, through correlation analysis of the modules and clinical traits, it was revealed that the brown module was highly positively correlated with PAH (Cor, 0.38; P = 0.01) and the blue module was also highly positively correlated with PAH (Cor, 0.61; P < 0.001) (Figure 2D). Therefore, the brown and blue modules were selected as important modules relevant to PAH for further analysis. In Figures 2Ea and Eb, the significant correlations between gene significance (GS) and module membership (MM) in the brown and blue modules were presented. A total of 465 and 664 key genes (GS > 0.20 and MM > 0.80; Supplementary Table 2), respectively, were found in the two modules.
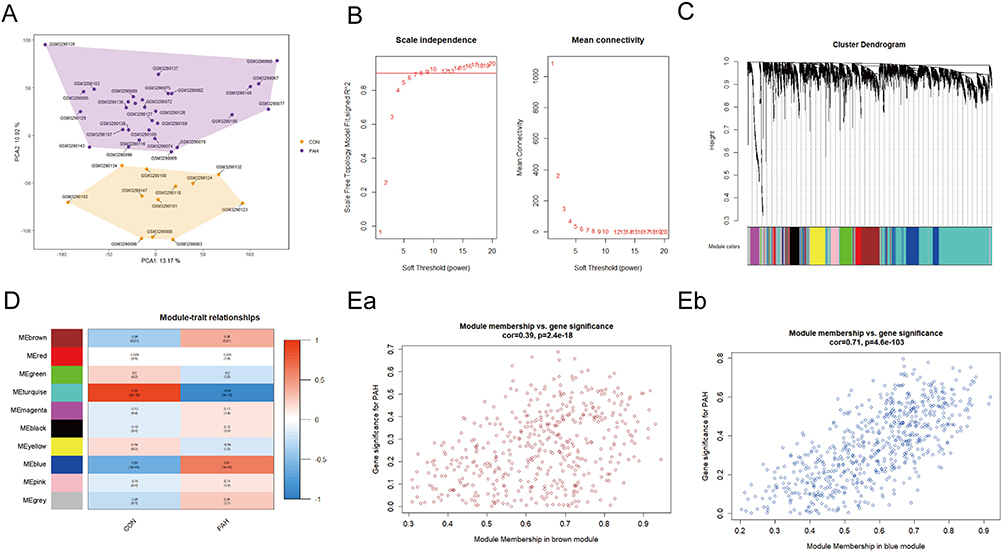 |
Figure 2 WGCNA co-expression network of immune-related genes. (A) PCA cluster plot of gene expression profile in PAH and control samples in GSE117261. (B) Optimal soft-threshold power. (C) Dendrogram based on a dissimilarity metric for DEGs. (D) Module-trait relationships between WGCNA modules and clinical traits. (Ea and Eb) Scatter plots of key modules. Abbreviations: CON, control; DEGs, differentially expressed genes; PAH, pulmonary arterial hypertension; PCA, principal component analysis; WGCNA, weighted gene co-expression network analysis. |
GO Analysis of Module Genes
GO functional enrichment analysis of the module genes was conducted. The results demonstrated that the significantly enriched BP terms included “vasculature development”, “blood vessel development”, ‘blood vessel morphogenesis’, ‘angiogenesis’ and “trans-membrane receptor protein tyrosine kinase signaling pathway” (Figure 3Aa and Ba). In the CC category, “extracellular matrix”, “basement membrane” and “sarcolemma” were the top enriched terms (Figure 3Ab and Bb). The most enriched MF terms were “GTPase activator activity”, “collagen binding”, “growth factor binding” and “platelet-derived growth factor binding” (Figure 3Ac and Bc).
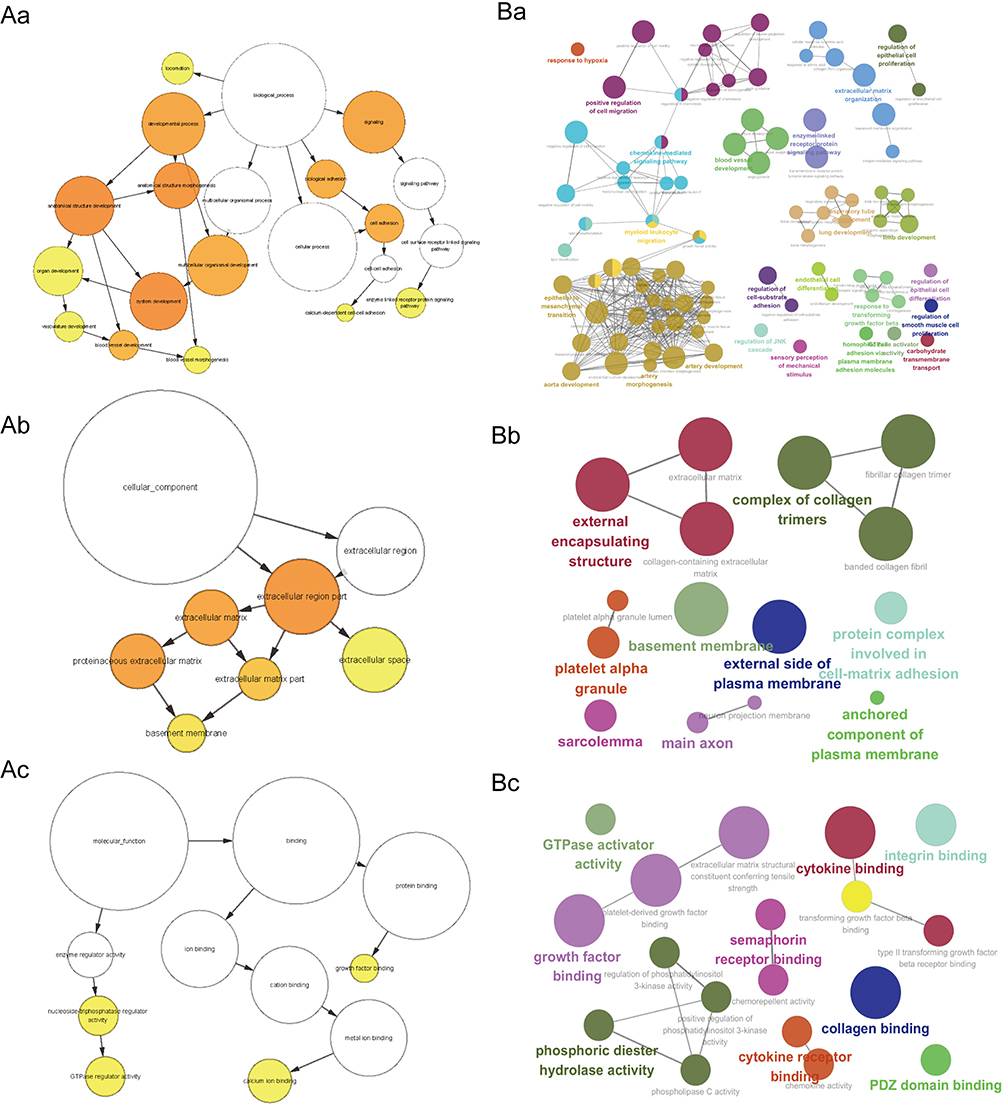 |
Figure 3 GO enrichment analysis of module genes. (A) A sample BiNGO result for a set of PAH-associated module genes as visualized using Cytoscape. Dark Orange categories are most significantly over-represented. White nodes are not significantly over-represented, they are included to show the Orange nodes in the context of the GO hierarchy. The area of a node is proportional to the number of genes in the test set annotated to the corresponding GO category. BP (Aa); CC (Ab); MF (Ac). (B) ClueGO example analysis of upregulated PAH-associated module genes. Functionally grouped network with terms as nodes linked based on their kappa score level (=0.4), where only the label of the most significant term for each group is shown. The node size represents the term enrichment significance. BP (Ba); CC (Bb); MF (Bc). Abbreviations: BP, biological process; CC, cellular component; GO, Gene Ontology; MF, molecular function; PAH, pulmonary arterial hypertension. |
Identification of DEGs
The results of differential GEO2R expression analysis demonstrated that a total of 78 genes, including 35 upregulated genes and 43 downregulated genes, were identified as DEGs in GSE117261 (Figure 4Aa and B). Additionally, a total of 140 genes, including 45 upregulated genes and 95 downregulated genes, were obtained from GSE48149 (Figure 4Ab and B). The distribution of these DEGs was presented in the volcano plots (Figure 4Aa and Ab). To identify the overlapping DEGs of the two datasets, Venn analysis was then conducted. The Venn diagrams indicated 9 overlapping upregulated genes and 11 overlapping downregulated genes associated with PAH (Figure 4C, Supplementary Table 3). The co-distribution of 20 DEGs, including 9 upregulated genes and 11 downregulated genes in GSE117261 and GSE48149, was shown in the heatmaps (Figure 4Da and Db).
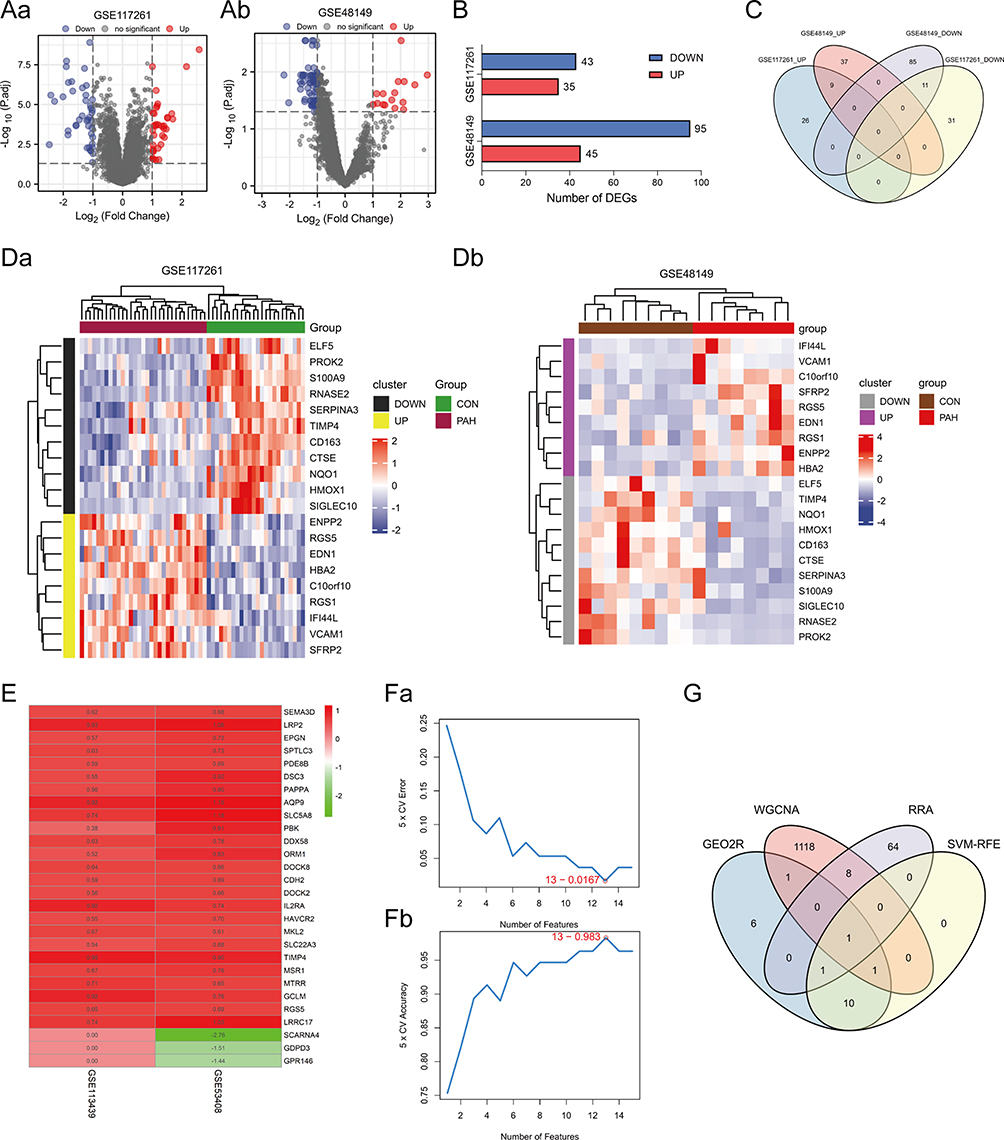 |
Figure 4 Identification of DEGs. (Aa and Ab) Volcano plots of DEG distribution in GSE117261 (Aa) and GSE48149 (Ab). Nodes in red represent upregulated genes, nodes in blue represent downregulated genes, and gray dots represent not significantly altered genes. (B) Number of DEGs in GSE117261 and GSE48149. (C) Venn diagram of DEGs from the two datasets. (Da and Db) Heatmaps of DEGs in GSE117261 (Da) and GSE48149 (Db). The legend on the top right indicates the log fold change of the genes. The horizontal axis represents each sample and the vertical axis represents each gene. Black (Grey) and yellow (purple) colors represent low and high expression values, respectively. (E) Top elements (red, upregulated; green, downregulated) available in input rankings correctly identified by RRA in GSE113439 and GSE53408. (Fa and Fb) SVM-RFE algorithm to screen diagnostic markers of GEO2R analysis genes. (G) Venn diagram showing the intersection of the critical signature obtained using the four strategies. Abbreviations: CON, control; DEGs, differentially expressed genes; PAH, pulmonary arterial hypertension; RRA, robust rank aggreg; SVM-RFE, support vector machines recursive feature elimination. |
Screening of Critical Signatures
A total of 74 genes were identified using RRA (Figure 4E, Supplementary Table 2) both from GSE53408 and GSE113439, and 13 genes were determined by SVM-RFE from GEO2R analysis (Figure 4Fa and Fb, Supplementary Table 2). Subsequently, Venn diagrams, covering WGCNA, RRA and SVM-RFE results, and GEO2R analysis, indicated that RGS5 was an overlapping gene identified using the four algorithms, which was exactly upregulated genes (Figure 4G, Table 1).
 |
Table 1 Information of RGS5 |
Verification of RGS5 in PAH
In order to assess the potential predictive value of key gene markers in PAH, ROC curves were generated. The AUCs for RGS5 (Figure 5Aa–Ad) suggested that the crucial gene had a high accuracy and good predictive value. Next, RGS5 expression in PAH tissues was verified. The results demonstrated that RGS5 expression was upregulated in PAH compared with controls in the GSE48149 and GSE117261 datasets (all P < 0.01; Figure 5Ba and Bd). In the validation dataset GSE113439, RGS5 expression in advanced lesions was significantly higher than that in early lesions (P < 0.05; Figure 5Bc). Similarly, RGS5 expression in PAH lesions was also higher than that in the control lesions (P < 0.001;Figure 5Bb).
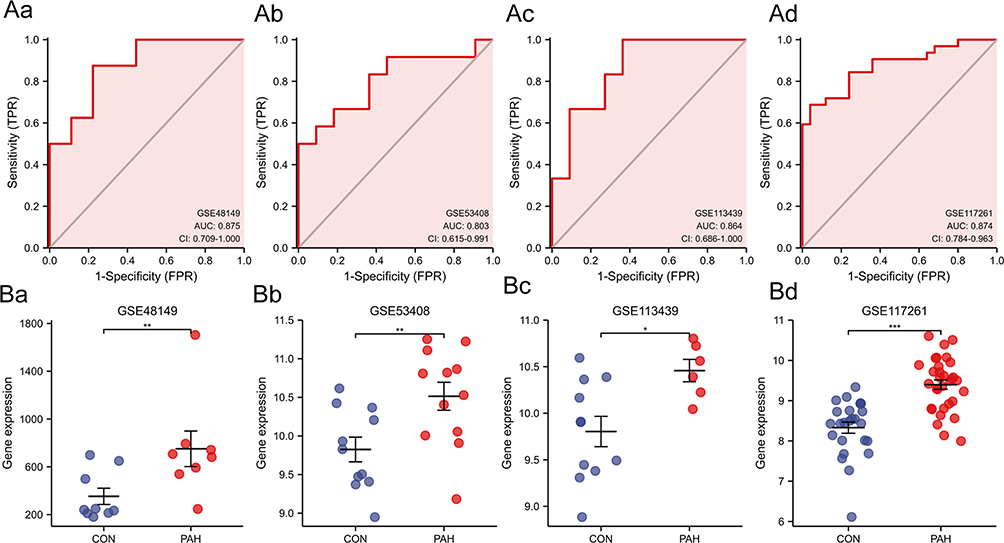 |
Figure 5 (Aa–Ad) Diagnostic power of RGS5 in PAH in ROC curve analysis ((Aa), GSE48149; (Ab), GSE53408; (Ac), GSE113439; (Ad), GSE117261). (Ba–Bd) Expression levels of RGS5 in GSE series ((Ba), GSE48149; (Bb), GSE53408; (Bc), GSE113439; (Bd), GSE117261). *P<0.05, **P<0.01, ***P<0.001. Abbreviations: CON, control; PAH, pulmonary arterial hypertension; RGS5, regulator of G-protein signaling 5; ROC, receiver operating characteristic. |
Analysis of Immune Cell Infiltration
There is now substantial experimental and clinical evidence that immune mechanisms can accelerate PAH.44 This prompted us to explore the relationship between the key signatures and immune infiltration in PAH. The CIBERSORT algorithm was used to analyze the 22 immune cell phenotypes in the GSE117261 dataset. Only one type of immune cells with undetectable abundance was excluded, and 21 types of immune cells were utilized for further analysis (Figure 6A and B). In comparison with control samples, PAH samples had a higher proportion of T cells CD8, T cells CD4 memory resting and T cells gamma delta (all P < 0.05). However, the proportions of T cells CD4 naive, natural killer (NK) cells resting, monocytes, macrophages M0 and neutrophils in PAH were lower than those in the control group (all P < 0.05) (Figure 6A). As indicated from the correlation heatmap of the 21 types of immune cells (Figure 6B), B cells naive and B cells memory, B cells naive and T cells gamma delta, B cells memory and neutrophils, T cells CD8 and NK cells resting, T cells CD8 and neutrophils, T cells CD4 memory resting and NK cells resting, T cells CD4 memory resting and macrophages M0, T cells CD4 memory resting and neutrophils, T cells CD4 memory activated and dendritic cells activated, T cells gamma delta and NK cells activated, T cells gamma delta and monocytes, NK cells resting and NK cells activated, NK cells resting and mast cells resting, dendritic cells resting and dendritic cells activated, mast cells resting and mast cells activated, and mast cells resting and neutrophils exhibited significant negative correlations (P < 0.01), respectively. B cells memory and T cells CD8, B cells memory and dendritic cells resting, plasma cells and T cells CD4 memory resting and mast cells resting, T cells CD8 and T cells CD4 memory resting, T cells CD4 memory resting and mast cells resting, T cells CD4 memory activated and T cells gamma delta, T cells follicular helper and NK cells activated, T cells gamma delta and macrophages M1, NK cells resting and monocytes, NK cells resting and neutrophils, monocytes and neutrophils, and dendritic cells activated and eosinophils exhibited significant positive correlations (P < 0.01), respectively.
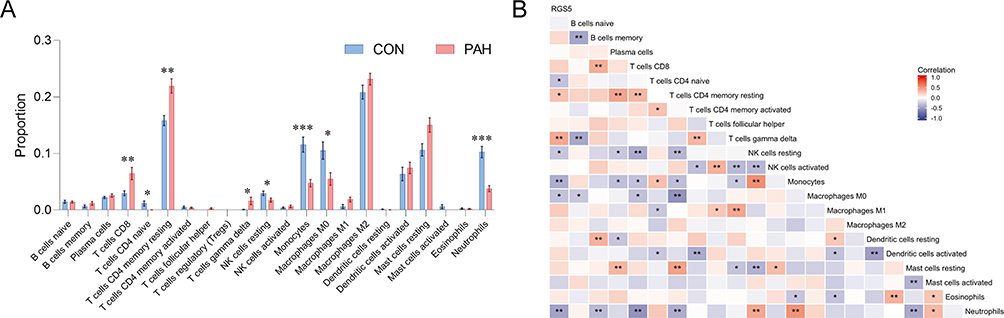 |
Figure 6 Immune cell infiltration analysis, and relationships between the key signature and immune cells in PAH. (A) Box-plot of the proportion of 22 types of immune cells. *P<0.05, **P<0.01, ***P<0.001. (B) Heatmap of correlation between RGS5 levels and 21 types of immune cells. Red represents a positive correlation and blue represents a negative correlation. A darker color implies a stronger association. *P<0.05, **P<0.01. Abbreviations: CON, control; PAH, pulmonary arterial hypertension; RGS5, regulator of G-protein signaling 5. |
Correlation Analysis of Key Signatures and Infiltration-Related Immune Cells
The present study aimed to explore the relationships between the key signature and infiltrated immune cells in PAH. Based on the results of correlation analysis, RGS5 exhibited positive correlations with T cells CD4 memory resting (r = 0.28; P < 0.05) and T cells gamma delta (r = 0.41; P < 0.01), and exhibited negative correlations with T cells CD4 naive (r = −0.30; P < 0.05), NK cells resting (r = −0.29; P < 0.05), monocytes (r = −0.40; P < 0.01), macrophages M0 (r = −0.30; P < 0.05) and neutrophils (r = −0.46; P < 0.01) (Figure 6B).
RGS5 Expression in Single Cells Examined by scRNA-Seq Analysis
To more precisely delineate the expression of key signatures in immune cells, a scRNA-seq database was searched to identify the cell populations expressing RGS5 mRNA in PAH. After implementing quality control and filtering cells (Figure 7A and B), unbiased clustering of the cells based on their gene expression profiles was performed. Clustering identified 13 sub-populations as shown in the t-distributed stochastic neighbor embedding plot (Figure 7C). RGS5 mRNA expression was significantly upregulated in pericytes in PAH tissues (P<0.001) (Figure 7D–F). These data suggest that RGS5 might be specifically upregulated in PAH lesions in which pericytes are enriched.
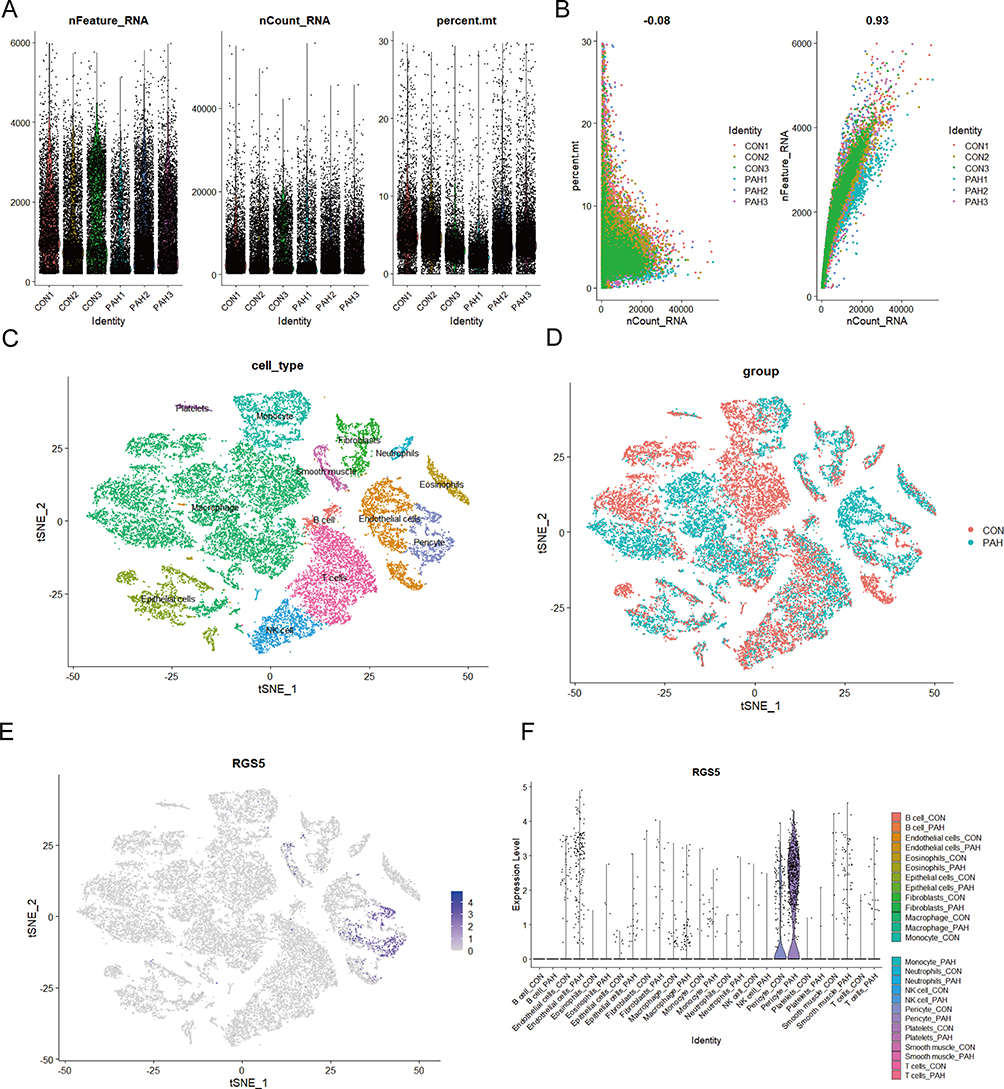 |
Figure 7 Identification of cell type of RGS5 expression in endothelial cells in human PAH tissues. (A and B) Quality control of single-cell RNA sequencing for control and PAH sub-populations. The y-axes represent RNA numbers, RNA counts and percentage of mitochondria of each cell, respectively. Cells with poor quality were filtered out and the detected gene counts and sequencing depth in sub-populations were analyzed. (C) tSNE visualization of cell type in lung tissues of several cell types. (D) tSNE visualization of cell type in lung tissues of controls and patients with PAH. (E) tSNE plot showing the distribution of expression of the marker gene RGS5 in lung tissues of several cell types (blue, high; gray, low). (F) Violin plots showing expression distribution of RGS5 mRNA in different cell clusters in control and PAH tissues. Abbreviations: CON, control; PAH, pulmonary arterial hypertension; RGS5, regulator of G-protein signaling 5; tSNE, t-distributed stochastic neighbor embedding. |
RGS5 Expression and Pericytes in PAH Mice
To obtain insights into the role of RGS5 in PAH, RGS5 expression in mouse PAH tissues was examined. Immunofluorescence revealed that RGS5 was co-localized with CD31-positive pericytes and that RGS5 was upregulated in PAH tissues (Figure 8A). Similarly, RGS5 was upregulated in PAH mice compared with normal mice based on RT-qPCR (Figure 8B). Taken together, the results further suggested that RGS5, as a potential diagnostic marker, is localized in pericytes and involved in PAH.
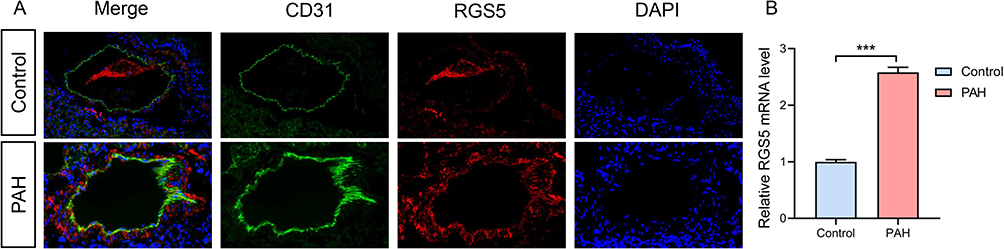 |
Figure 8 RGS5 expression in PAH. (A) An Immunofluorescence staining of the pericyte marker (CD31) and RGS5 in pulmonary microvasculature of PAH mice. (B) Relative RGS5 mRNA expression in normal lung and PAH mouse samples. ***P<0.05. Abbreviations: PAH, pulmonary arterial hypertension; RGS5, regulator of G-protein signaling 5. |
Discussion
Pericytes Participate in Vascular Remodeling in PAH
Pericytes (specialized perivascular cells derived from mesenchyme and embedded in the vascular basement membrane16) are found around pre-capillary arteries, capillaries, post-capillary venules, and in close proximity to endothelial and smooth muscle cells.2 As central regulators of vascular development, stabilization, maturation and remodeling, pericytes serve key roles in vascular homeostasis (vasomotor tone and structural support of microvessels7) and preservation of the pulmonary micro-circulation,16 regulating endothelial cell development, proliferation, differentiation and migration.45 However, pericytes can also contribute to vascular pathology via secretion of pro-inflammatory and profibrotic cytokines, myofibroblast differentiation, extracellular matrix disruption and vessel wall detachment.17 Loss of pericyte communication with alveolar capillaries and a switch to a proinflammatory/profibrotic phenotype are common features of lung diseases associated with fibrosis, inflammation and vascular remodeling.
The involvement of pericytes in PAH was proposed by Meyrick et al46 in 1981. Recent studies have demonstrated increased density and coverage of pericytes (located in the tunica media or adventitia layer of the pulmonary vasculature17) in the distal pulmonary arteries of PAH (with a marked increase in pericyte numbers in distal PAH pulmonary arteries in pathological tissue). In vitro cell experiments revealed enhanced proliferative and migratory capacity of human lung pericytes cultured in human idiopathic PAH endothelial cell conditioned medium,7 suggesting an association with endothelial cell dysfunction (synergistically leading to small vessel injury in PAH by reducing structural stability and neomicrovascular survival)47 Pericytes differ from healthy pulmonary microvascular endothelial cells, which exhibit limited migration, a low mitotic rate and a relatively nonproliferative state,48 and are involved in cellular communication during angiogenesis,17 and exert direct consequences on the characteristic pulmonary vascular obstruction49 and vascular remodeling50 of PAH. This phenomenon is a uniform and independent presence of known vascular diameters, bone morphogenetic protein receptor type 2 mutations, other than vascular remodeling,2 causing muscularization and narrowing of the pulmonary microvasculature, greatly increasing pulmonary vascular resistance.48 Reverse studies have shown that deficiency of the perlecan heparan sulfate leads to pericyte loss, reduced vascular remodeling and right ventricular hypertrophy, and reduced formation of hypoxic pulmonary hypertension,51 and reverse confirms a progressive relationship of pericytes and the pathological progression of PAH. An interesting but necessary study is that pericytes of PAH cannot associate with healthy lung microvascular endothelial cells in co-culture. Conversely, pericyte formation of smaller tubular networks is manifested by an inability to efficiently polarize and subsequently migrate towards healthy lung microvascular endothelial cells,16 exemplifying that pericytes serve only a specific role in PAH progression. Not confined to the traditional sense of tight junctions with endothelial cells,52 whether pericytes in PAH conform to the lack of other endothelial pericyte communication to affect healthy lung microvascular homeostasis continues to be investigated.47 In a review of the literature, a study was found that focused on myocardial infarction and identified PAH as a secondary disease (secondary diagnosis) resulting from the formation of pulmonary structural remodeling characterized by pericyte proliferation 2 weeks after infarction,53 supporting the role of pericyte proliferation as a risk factor for the pathological progression of PAH.
RGS5-Positive + Pericytes Contribute to General Pathological Vascular Remodeling
Not all pericytes express every marker (including α smooth muscle actin, CD146, platelet-derived growth factor receptor β, chondroitin sulfate proteoglycan, desmin, RGS5, etc.).54,55 Their expression is dynamic and varies among different organs, developmental stages, activation/maturation states and within a single microvascular network.55 The significance of our study lies in the prudent screening of RGS5 as a marker gene of pericytes in PAH pathological progression occurring in pulmonary capillary endothelial cells surrounding vascular remodeling pointing target genes.
RGS proteins consist of a family of molecules (>25 are known) that have a uniform catalytic function but differ in tissue distribution.18,56 The RGS family stimulates the intrinsic guanosine triphosphatase activity of the activated Gα subunit (Giα and Gqα),57,58 limiting Gα subunit to the time of GTP binding,56 thereby accelerating G protein inactivation.18 At the same time, they act as effector antagonists that block the activation of Gα subunit interaction with downstream parvalbumin,56 thereby inhibiting signaling downstream of G protein-coupled receptors19 and performing fine-tuning of pericyte motility in vessel growth and stabilization. RGS5 is one of the negative regulators of the heterotrimeric G protein signaling pathway18,56,59 and is considered a pericyte marker at physiological pathological angiogenic sites,54,57,60 suggesting a potential role for RGS5 in developmental angiogenesis and pathological vascular remodeling. Tissues at non-angiogenic sites, including non-transformed pancreatic islets, normal kidneys, non-neoplastic liver tissue, etc., do not express RGS5.54 High RGS5 expression is observed in the heart, lungs, skeletal muscle and small intestine, while low expression is observed in the brain, placenta, large intestine and granulocytes.61
The known organ distribution of RGS5 in the body indicates that it participates in basic regulatory processes, and using genetic analysis experiments, researchers have shown that RGS5 can be differentially expressed in a changing tissue environment, such as during the occurrence of pathological processes. Specifically, in animals undergoing wound healing, increased levels of RGS5 were observed in peripheral cells, suggesting an association between RGS5 expression and nonneoplastic active vascular remodeling.18 Similarly, elevated expression is observed in human stroke when the organism responds to focal ischemic brain parenchymal injury, recruits pericytes marked by upregulation of RGS5 (ischemia inducible factor59) expression, and exerts the latter advantage of possessing mesenchymal stem cells that conditionally develop into microglia to repair brain parenchymal damage.62 In pathological vascular development studies in the eye, researchers found that RGS5 expression was associated with the presence of two widely accepted indicators of vascular maturation (acquisition of pericytes from neovessels and resistance to regression by the appearance of neovessels after inhibition of VEGF),54 implying that upregulated expression of the former is indicative of the maturation state of the latter. Furthermore, in analysis in scleroderma, investigators found that patients had features of myofibroblasts with abundant RGS5 expression, suggesting that RGS5 is involved in the interaction between pericytes and endothelial cells during vascular remodeling.63 In contrast to upregulated expression, investigators have used diabetic model mice to study the causes of impaired wound healing and found that downregulated RGS5 expression was associated with reduced pericyte coverage around capillaries, which in turn was inversely associated with capillary permeability.64
The present results demonstrated that RGS5 mRNA level was upregulated in PAH compared with normal controls. Based on immunofluorescence analysis, RGS5 expression was elevated in pulmonary vessels of the PAH mice, and RGS colocalized with pericyte expression. These results suggest that RGS5 is involved in the pathological process by which pericytes regulate vascular remodeling of the pulmonary microvasculature, and that the highly expressed RGS5 is closely associated with pericyte proliferation, which together promote vascular remodeling of the pulmonary microvasculature, elevated pulmonary vascular resistance and right ventricular hypertrophy, leading to the development of PAH.
In conclusion, the present study is the first to demonstrate that high expression of RGS5 regulates vascular remodeling in the pulmonary microvasculature and the development of PAH through pericytes through bioinformatics analysis and biological verification. A biomarker for pericytes, RGS5, may serve as a potential target for future predictive diagnostics, patient stratification, targeted prevention, and personalized treatment. Targeting the RGS5 may be a new strategy for PAH treatment.
Abbreviations
PAH, Pulmonary arterial hypertension; GEO, Gene expression omnibus; RGS5, Regulator of G-protein signaling 5; RT-qPCR, reverse transcription-quantitative PCR; WGCNA, weighted gene co-expression network analysis; DEGs, differentially expressed genes; scRNA-seq, single-cell RNA sequencing; PCA, principal component analysis; TOM, topological overlap matrix; 1-TOM, corresponding dissimilarity; GO, Gene ontology; BP, biological process; CC, cellular component MF, molecular function; SVM-RFE, Support vector machines recursive feature elimination; RRA, Robust rank aggreg; ROC, Receiver operating characteristic; AUC, area under the curve; UMAP, Uniform manifold approximation and projection; GS, gene significance; MM, module membership.
Data Sharing Statement
The data and material can be found from the correspondence authors.
Ethics Approval
All datasets in the present study were downloaded from public databases, including GSE117261, GSE48149, GSE113439, GSE53408 and GSE16947. These public databases allowed researchers to download and analyze public datasets for scientific purposes. The current research follows the GEO data access policies and publication guidelines. Inclusion of the publicly available data of human samples was approved by First Affiliated Hospital of Fourth Military Medical University review board. All procedures involving animals were reviewed, and the protocols were approved by the Fourth Military Medical University Animal Care and Use Committee (20221005). All animal procedure guidelines followed the Animal Welfare Act and the Guide for Care and Use of Laboratory Animals of the Fourth Military Medical University.
Code Availability
The raw data, including code can be found here: https://www.jianguoyun.com/p/Dd7Wg1AQ97CkCxikpO8EIAA
Funding
This work was supported by grants from National Natural Science Foundation of China (nos. 82070051 and 82303426) and Supported by Fourth Military Medical University Doctoral Science Foundation (2021D04lgf).
Disclosure
The authors have declared that no competing interest exists.
References
1. Ruopp NF, Cockrill BA. Diagnosis and Treatment of Pulmonary Arterial Hypertension. JAMA-J Am Med Assoc. 2022;327(14):1379. doi:10.1001/jama.2022.4402
2. Bordenave J, Thuillet R, Tu L, et al. Neutralization of CXCL12 attenuates established pulmonary hypertension in rats. CARDIOVASC RES. 2020;116:686–697. doi:10.1093/cvr/cvz153
3. Rabinovitch M. Molecular pathogenesis of pulmonary arterial hypertension. J Clin Invest. 2012;122(12):4306–4313. doi:10.1172/JCI60658
4. Hassoun PM. Pulmonary Arterial Hypertension. New Engl J Med. 2021;385(25):2361–2376. doi:10.1056/NEJMra2000348
5. Galiè N, Channick RN, Frantz RP, et al. Risk stratification and medical therapy of pulmonary arterial hypertension. Eur Respir J. 2019;53(1):1801889. doi:10.1183/13993003.01889-2018
6. Boucly A, Weatherald J, Savale L, et al. Risk assessment, prognosis and guideline implementation in pulmonary arterial hypertension. Eur Respir J. 2017;50(2):1700889. doi:10.1183/13993003.00889-2017
7. Ricard N, Tu L, Le Hiress M, et al. Increased Pericyte Coverage Mediated by Endothelial-Derived Fibroblast Growth Factor-2 and Interleukin-6 Is a Source of Smooth Muscle–Like Cells in Pulmonary Hypertension. Circulation. 2014;129(15):1586–1597. doi:10.1161/CIRCULATIONAHA.113.007469
8. Budhiraja R, Tuder RM, Hassoun PM. Endothelial Dysfunction in Pulmonary Hypertension. CIRCULATION. 2004;109(2):159–165. doi:10.1161/01.CIR.0000102381.57477.50
9. Simonneau G, Montani D, Celermajer DS, et al. Haemodynamic definitions and updated clinical classification of pulmonary hypertension. Eur Respir J. 2019;53(1):1801913. doi:10.1183/13993003.01913-2018
10. Tuder RM. Pulmonary vascular remodeling in pulmonary hypertension. Cell Tissue Res. 2017;367(3):643–649. doi:10.1007/s00441-016-2539-y
11. Jeffery TK, Wanstall JC. Pulmonary vascular remodeling: a target for therapeutic intervention in pulmonary hypertension. Pharmacology Therapeutic. 2001;92(1):1–20. doi:10.1016/S0163-7258(01)00157-7
12. Mamazhakypov A, Hein L, Lother A. Mineralocorticoid receptors in pulmonary hypertension and right heart failure: from molecular biology to therapeutic targeting. Pharmacol Therapeut. 2022;231:107987. doi:10.1016/j.pharmthera.2021.107987
13. Pak O, Aldashev A, Welsh D, Peacock A. The effects of hypoxia on the cells of the pulmonary vasculature. Eur Respir J. 2007;30(2):364–372. doi:10.1183/09031936.00128706
14. Humbert M, Guignabert C, Bonnet S, et al. Pathology and pathobiology of pulmonary hypertension: state of the art and research perspectives. Eur Respir J. 2019;53(1):1801887. doi:10.1183/13993003.01887-2018
15. Thompson AAR, Lawrie A. Targeting Vascular Remodeling to Treat Pulmonary Arterial Hypertension. Trends Mol Med. 2017;23(1):31–45. doi:10.1016/j.molmed.2016.11.005
16. Yuan K, Shamskhou EA, Orcholski ME, et al. Loss of Endothelium-Derived Wnt5a Is Associated with Reduced Pericyte Recruitment and Small Vessel Loss in Pulmonary Arterial Hypertension. Circulation. 2019;139(14):1710–1724. doi:10.1161/CIRCULATIONAHA.118.037642
17. Yuan K, Agarwal S, Chakraborty A, et al. Lung Pericytes in Pulmonary Vascular Physiology and Pathophysiology. Compr Physiol. 2021;11:2227–2247.
18. Berger M, Bergers G, Arnold B, Hämmerling GJ, Ganss R. Regulator of G-protein signaling-5 induction in pericytes coincides with active vessel remodeling during neovascularization. Blood. 2005;105:1094–1101. doi:10.1182/blood-2004-06-2315
19. De Vries L, Zheng B, Fischer T, Elenko E, Farquhar MG. The Regulator of G Protein Signaling Family. Annu Rev Pharmacol. 2000;40:235–271. doi:10.1146/annurev.pharmtox.40.1.235
20. Stearman RS, Bui QM, Speyer G, et al. Systems Analysis of the Human Pulmonary Arterial Hypertension Lung Transcriptome. Am J Resp Cell Mol. 2019;60(6):637–649. doi:10.1165/rcmb.2018-0368OC
21. Renaud L, Da Silveira WA, Takamura N, Hardiman G, Feghali-Bostwick C. Prominence of IL6, IGF, TLR, and Bioenergetics Pathway Perturbation in Lung Tissues of Scleroderma Patients with Pulmonary Fibrosis. Front Immunol. 2020;11. doi:10.3389/fimmu.2020.00383
22. Mura M, Cecchini MJ, Joseph M, Granton JT. Osteopontin lung gene expression is a marker of disease severity in pulmonary arterial hypertension. Respirology. 2019;24(11):1104–1110. doi:10.1111/resp.13557
23. Zhao YD, Yun HZH, Peng J, et al. De novo synthesize of bile acids in pulmonary arterial hypertension lung. Metabolomics. 2014;10(6):1169–1175. doi:10.1007/s11306-014-0653-y
24. Saygin D, Tabib T, Bittar H, et al. Transcriptional profiling of lung cell populations in idiopathic pulmonary arterial hypertension. Pulm circ. 2020;10(1):1–15. doi:10.1177/2045894020908782
25. Gentleman RC, Carey VJ, Bates DM, et al. Bioconductor: open software development for computational biology and bioinformatics. Genome BIOL. 2004;5R80.
26. Xu J, Zhou H, Cheng Y, Xiang G. Identifying potential signatures for atherosclerosis in the context of predictive, preventive, and personalized medicine using integrative bioinformatics approaches and machine-learning strategies. Epma J. 2022;13(3):433–449. doi:10.1007/s13167-022-00289-y
27. Chang YC, Liu X, Kim JDO, et al. Multiple Genes for Essential-Hypertension Susceptibility on Chromosome 1q. Am J Hum Genet. 2007;80:253–264. doi:10.1086/510918
28. Xiao B, Zhang Y, Niu W, Gao P, Zhu D. Haplotype-based association of regulator of G-protein signaling 5 gene polymorphisms with essential hypertension and metabolic parameters in Chinese. CLIN CHEM LAB MED. 2009;47(12). doi:10.1515/CCLM.2009.344
29. Arnold C, Demirel E, Feldner A, et al. Hypertension‐evoked RhoA activity in vascular smooth muscle cells requires RGS5. FASEB. 2018;32:2021–2035. doi:10.1096/fj.201700384RR
30. Bindea G, Mlecnik B, Hackl H, et al. ClueGO: a Cytoscape plug-in to decipher functionally grouped gene ontology and pathway annotation networks. Bioinformatics. 2009;25(8):1091–1093. doi:10.1093/bioinformatics/btp101
31. Maere S, Heymans K, Kuiper M. BiNGO: a Cytoscape plugin to assess overrepresentation of Gene Ontology categories in Biological Networks. Bioinformatics. 2005;21(16):3448–3449. doi:10.1093/bioinformatics/bti551
32. Ritchie ME, Phipson B, Wu D, et al. limma powers differential expression analyses for RNA-sequencing and microarray studies. Nucleic Acids Res. 2015;43(7):e47. doi:10.1093/nar/gkv007
33. Wickham H. ggplot2: Elegant Graphics for Data Analysis. New York: Springer-Verlag; 2016.
34. Kolde R. pheatmap: pretty Heatmaps. R package version 1.0.12. 2019.
35. Chen H, Boutros PC. VennDiagram: a package for the generation of highly-customizable Venn and Euler diagrams in R. BMC Bioinform. 2011;12(1):35. doi:10.1186/1471-2105-12-35
36. Langfelder P, Horvath S. WGCNA: an R package for weighted correlation network analysis. BMC Bioinform. 2008;9(1):559. doi:10.1186/1471-2105-9-559
37. Barrett T, Wilhite SE, Ledoux P, et al. NCBI GEO: archive for functional genomics data sets—update. Nucleic Acids Res. 2012;41(D1):D991–D995. doi:10.1093/nar/gks1193
38. Sanz H, Valim C, Vegas E, Oller JM, Reverter F. SVM-RFE: selection and visualization of the most relevant features through non-linear kernels. BMC Bioinform. 2018;19(1). doi:10.1186/s12859-018-2451-4
39. Kolde R, Laur S, Adler P, Vilo J. Robust rank aggregation for gene list integration and meta-analysis. Bioinformatics. 2012;28(4):573–580. doi:10.1093/bioinformatics/btr709
40. Robin X, Turck N, Hainard A, et al. pROC: an open-source package for R and S+ to analyze and compare ROC curves. BMC Bioinform. 2011;12(1):77. doi:10.1186/1471-2105-12-77
41. Butler A, Hoffman P, Smibert P, Papalexi E, Satija R. Integrating single-cell transcriptomic data across different conditions, technologies, and species. Nat Biotechnol. 2018;36(5):411–420. doi:10.1038/nbt.4096
42. Aran D, Looney AP, Liu L, et al. Reference-based analysis of lung single-cell sequencing reveals a transitional profibrotic macrophage. Nat Immunol. 2019;20(2):163–172. doi:10.1038/s41590-018-0276-y
43. Li J, Jia M, Liu M, et al. The effect of activated kappa-opioid receptor (kappa-OR) on the role of calcium sensing receptor (CaSR) in preventing hypoxic pulmonary hypertension development. Biomed Pharmacother. 2020;125:109931. doi:10.1016/j.biopha.2020.109931
44. Rabinovitch M, Guignabert C, Humbert M, Nicolls MR. Inflammation and Immunity in the Pathogenesis of Pulmonary Arterial Hypertension. Circ Res. 2014;115(1):165–175. doi:10.1161/CIRCRESAHA.113.301141
45. Orlidge A, D’Amore PA. Inhibition of Capillary Endothelial Cell Growth by Pericytes and Smooth Muscle Cells. J Cell Biol. 1987;105(3):1455–1462. doi:10.1083/jcb.105.3.1455
46. Meyrick B, Fujiwara K, Reid L. Smooth muscle myosin in precursor and mature smooth muscle cells in normal pulmonary arteries and the effect of hypoxia. Exp Lung Res. 1981;2(4):303. doi:10.3109/01902148109052325
47. Yuan K, Orcholski ME, Panaroni C, et al. Activation of the Wnt/Planar Cell Polarity Pathway Is Required for Pericyte Recruitment during Pulmonary Angiogenesis. Am J Pathol. 2015;185(1):69–84. doi:10.1016/j.ajpath.2014.09.013
48. Khoury J, Langleben D. Heparin-like molecules inhibit pulmonary vascular pericyte proliferation in vitro. Am J Physiol-Lung C. 2000;279(2):L252–L261. doi:10.1152/ajplung.2000.279.2.L252
49. Xu W, Erzurum SC. Endothelial cell energy metabolism, proliferation, and apoptosis in pulmonary hypertension. Compr Physiol. 2011;1(1):357. doi:10.1002/cphy.c090005
50. Voelkel NF, Gomez-Arroyo J, Abbate A, Bogaard HJ, Nicolls MR. Pathobiology of pulmonary arterial hypertension and right ventricular failure. Eur Respir J. 2012;40(6):1555–1565. doi:10.1183/09031936.00046612
51. Chang YT, Tseng CN, Tannenberg P, et al. Perlecan heparan sulfate deficiency impairs pulmonary vascular development and attenuates hypoxic pulmonary hypertension. Cardiovasc Res. 2015;107(1):20–31. doi:10.1093/cvr/cvv143
52. Díaz-Flores L, Gutiérrez R, Madrid JF, et al. Pericytes. Morphofunction, interactions and pathology in a quiescent and activated mesenchymal cell niche. Histol Histopathol. 2009;24(7):909. doi:10.14670/HH-24.909
53. Jasmin JF, Calderone A, Leung TK, Villeneuve L, Dupuis J. Lung structural remodeling and pulmonary hypertension after myocardial infarction: complete reversal with irbesartan. Cardiovasc Res. 2003;58(3):621–631. doi:10.1016/S0008-6363(03)00290-6
54. Mitchell TS, Bradley J, Robinson GS, Shima DT, Ng Y. RGS5 expression is a quantitative measure of pericyte coverage of blood vessels. Angiogenesis. 2008;11(2):141–151. doi:10.1007/s10456-007-9085-x
55. Harrell CR, Simovic Markovic B, Fellabaum C, Arsenijevic A, Djonov V, Volarevic V. Molecular mechanisms underlying therapeutic potential of pericytes. J Biomed Sci. 2018;25(1):21. doi:10.1186/s12929-018-0423-7
56. Cho H, Kozasa T, Bondjers C, Betsholtz C, Kehrl JH. Pericyte-specific expression of Rgs5: implications for PDGF and EDG receptor signaling during vascular maturation. FASEB. 2003;17(3):1–17. doi:10.1096/fj.02-0340fje
57. Bondjers C, Kalén M, Hellström M, et al. Transcription Profiling of Platelet-Derived Growth Factor-B-Deficient Mouse Embryos Identifies RGS5 as a Novel Marker for Pericytes and Vascular Smooth Muscle Cells. Am J Pathol. 2003;162(3):721–729. doi:10.1016/S0002-9440(10)63868-0
58. Özen I, Roth M, Barbariga M, et al. Loss of Regulator of G-Protein Signaling 5 Leads to Neurovascular Protection in Stroke. Stroke. 2018;49(9):2182–2190. doi:10.1161/STROKEAHA.118.020124
59. Roth M, Gaceb A, Enström A, et al. Regulator of G‐protein signaling 5 regulates the shift from perivascular to parenchymal pericytes in the chronic phase after stroke. FASEB. 2019;33:8990–8998. doi:10.1096/fj.201900153R
60. Nisancioglu MH, Mahoney WM, Kimmel DD, Schwartz SM, Betsholtz C, Genove G. Generation and Characterization of rgs5 Mutant Mice. Mol Cell Biol. 2008;28:2324–2331. doi:10.1128/MCB.01252-07
61. Seki N, Sugano S, Suzuki Y, et al. Isolation, tissue expression, and chromosomal assignment of human RGS5, a novel G-protein signaling regulator gene. J Hum Genet. 1998;43(3):202–205. doi:10.1007/s100380050071
62. Özen I, Deierborg T, Miharada K, et al. Brain pericytes acquire a microglial phenotype after stroke. Acta Neuropathol. 2014;128(3):381–396. doi:10.1007/s00401-014-1295-x
63. Mahoney WM, Fleming JN, Schwartz SM. A Unifying Hypothesis for Scleroderma: identifying a Target Cell for Scleroderma. Curr Rheumatol Rep. 2011;13(1):28–36. doi:10.1007/s11926-010-0152-8
64. Okonkwo UA, Chen L, Ma D, et al. Compromised angiogenesis and vascular Integrity in impaired diabetic wound healing. PLoS One. 2020;15(4):e231962. doi:10.1371/journal.pone.0231962
 © 2023 The Author(s). This work is published and licensed by Dove Medical Press Limited. The full terms of this license are available at https://www.dovepress.com/terms.php and incorporate the Creative Commons Attribution - Non Commercial (unported, v3.0) License.
By accessing the work you hereby accept the Terms. Non-commercial uses of the work are permitted without any further permission from Dove Medical Press Limited, provided the work is properly attributed. For permission for commercial use of this work, please see paragraphs 4.2 and 5 of our Terms.
© 2023 The Author(s). This work is published and licensed by Dove Medical Press Limited. The full terms of this license are available at https://www.dovepress.com/terms.php and incorporate the Creative Commons Attribution - Non Commercial (unported, v3.0) License.
By accessing the work you hereby accept the Terms. Non-commercial uses of the work are permitted without any further permission from Dove Medical Press Limited, provided the work is properly attributed. For permission for commercial use of this work, please see paragraphs 4.2 and 5 of our Terms.