")
Back to Journals » International Journal of Nanomedicine » Volume 17
Role of Surface Charge of Nanoscale Ultrasound Contrast Agents in Complement Activation and Phagocytosis
Authors Zhou J, Xiang H, Huang J, Zhong Y , Zhu X, Xu J, Lu Q , Gao B, Zhang H, Yang R , Luo Y, Yan F
Received 28 February 2022
Accepted for publication 27 November 2022
Published 5 December 2022 Volume 2022:17 Pages 5933—5946
DOI https://doi.org/10.2147/IJN.S364381
Checked for plagiarism Yes
Review by Single anonymous peer review
Peer reviewer comments 2
Editor who approved publication: Dr Ebrahim Mostafavi
Jie Zhou,1,2 Hongjin Xiang,1,2 Jianbo Huang,1,2 Yi Zhong,3 Xiaoxia Zhu,1,2 Jinshun Xu,1,2 Qiang Lu,1,2 Binyang Gao,1,2 Huan Zhang,1,2 Rui Yang,1,2 Yan Luo,1,2 Feng Yan1,2
1Ultrasound Department, West China Hospital of Sichuan University, Chengdu, People’s Republic of China; 2Laboratory of Ultrasound Imaging, West China Hospital of Sichuan University, Chengdu, People’s Republic of China; 3Laboratory of Mitochondria and Metabolism, West China Hospital of Sichuan University, Chengdu, People’s Republic of China
Correspondence: Feng Yan, Laboratory of Ultrasound Imaging, West China Hospital of Sichuan University, Chengdu, People’s Republic of China, Tel/Fax +86 028 8516 4146, Email [email protected] Yan Luo, Ultrasound Department, West China Hospital of Sichuan University, Chengdu, People’s Republic of China, Tel/Fax +86 028 8542 3192, Email [email protected]
Purpose: To prepare nanoscale ultrasound contrast agents (Nano-UCAs) and examine the role of their surface charge in complement activation and phagocytosis.
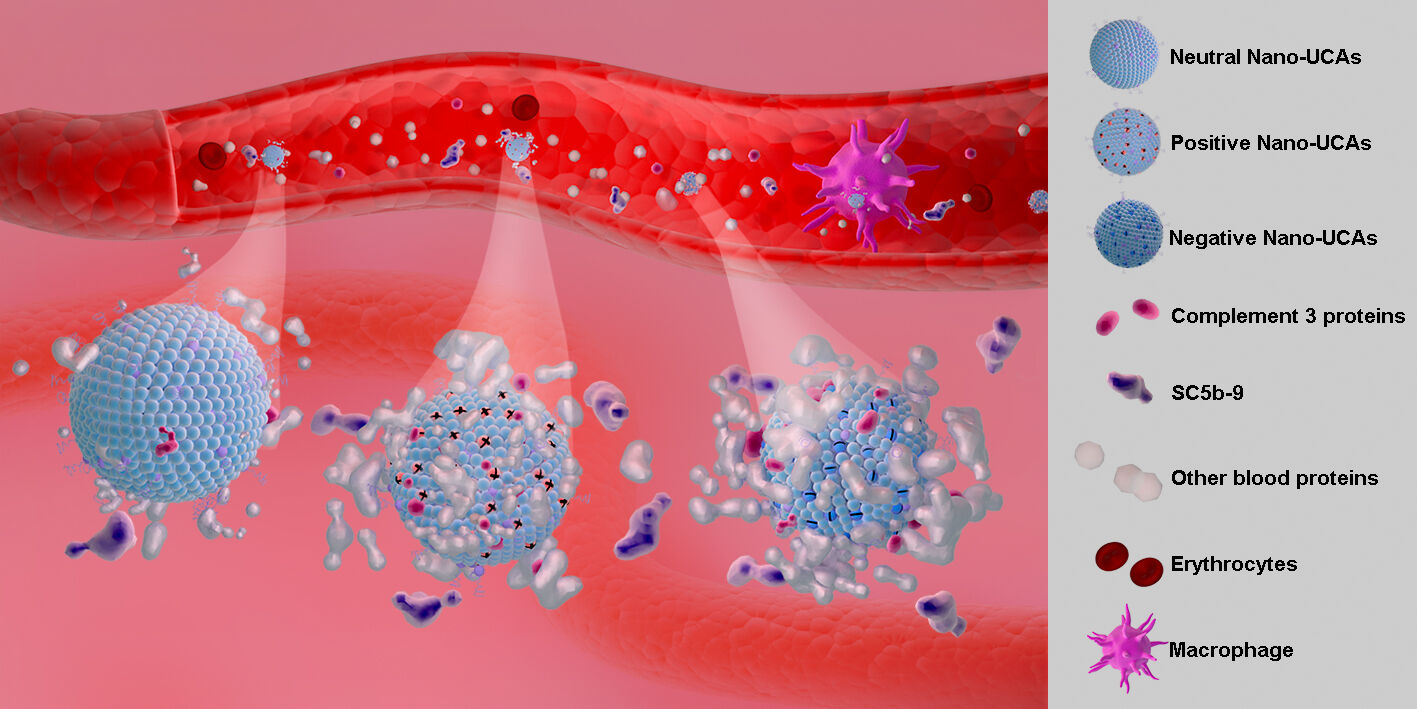
Materials and Methods: We analyzed serum proteins present in the corona formed on Nano-UCAs and evaluated two important protein markers of complement activation (C3 and SC5b-9). The effect of surface charge on phagocytosis was further assessed using THP-1 macrophages.
Results: When Nano-UCAs were incubated with human serum, they were opsonized by various blood proteins, especially C3. Highly charged Nano-UCAs, whether positive or negative, were favorably opsonized by complement proteins and phagocytized by macrophages.
Conclusion: Charged Nano-UCAs show a higher tendency to activated complement system, and are efficiently engulfed by macrophages. The present results provide meaningful insights into the role of the surface charge of nanoparticles in the activation of the innate immune system, which is important not only for the design of targeted Nano-UCAs, but also for the effectiveness and safety of other theranostic agents.
Keywords: nanoscale ultrasound contrast agents, surface charge, protein corona, complement activation, opsonization, phagocytosis
Graphical Abstract:
Introduction
Ultrasound contrast agents (UCAs) are generally gas-filled microbubbles (MBs) with a diameter of 1–8 μm, which can oscillate upon interacting with the ultrasound wave thus enhancing the reflected ultrasound signal, and have been used in clinical imaging for decades.1–3 Traditional MBs are small enough to freely circulate in capillariesbut too large to extravasate from blood vessels to deliver drugs to the tissue. In recent years, nanoscale ultrasound contrast agents (Nano-UCAs) have emerged as an effective drug delivery system for molecular imaging and target therapy, because of their responsive properties to external stimuli.4,5 With a size of hundreds of nanometers, Nano-UCAs can extravasate from blood vessels and accumulate in tumor tissue via the enhanced permeability and retention effect.6 Most Nano-UCAs have a liquid perfluorocarbon core and a phospholipid shell, capable of undergoing liquid-to-gas phase transition.7,8 Nano-UCAs have many potential uses, covering a broad spectrum of biomedical research that can be translated into future theranostic applications, such as molecular imaging,9,10 image-guided therapy,11 ultrasound-mediated drugs and gene delivery,12,13 ultrasound-triggered immunotherapy,14,15 and biosensors.16 Numerous UCA designs have been developed, including echogenic liposomes,17 nanodroplets or nanoemulsions,18 micelles,19 and gas-filled nanobubbles.20 The chemical composition of these nanoparticles can be fine-tuned according to the physicochemical and biological properties of the active compound and their intended application. The outer shell of Nano-UCAs is usually composed of different anionic, cationic, and neutral molecules (phospholipids, polymers, surfactants, etc). Anionic UCAs are typically used to deliver anticancer drugs (eg, doxorubicin, paclitaxel, etc).21,22 Cationic UCAs can be electrostatically coated with nucleic acids, and used in sonoporation for gene delivery.23 Surface charge properties are important not only for the stability of nanoparticles (NPs) in vitro but also for their blood half-life in vivo. The surface charge of NPs is generally characterized through the zeta potential, which is exhibited by any particle in suspension, as well as macromolecules and material surfaces.24 The measurement of the zeta potential is a standard technique to evaluate the surface charge of NPs and predict their stability in vitro.25 However, few studies have reported the role of the surface charge or zeta potential of NPs in the innate immune system.
The innate immune system, including the complement network and the mononuclear phagocytic system (MPS), is the first line of defense against invasion by viruses, bacteria, as well as foreign substances such as micro- and nanoparticles.26 Following intravenous administration, NPs are rapidly covered by blood proteins (opsonins) to form a “protein corona”, in a process termed opsonization. This process aids immune cells to recognize the NPs. The complement protein 3 (C3) is at the core of the complement enzyme-linked reaction, which involves all complement activation pathways. Upon activation, C3 produces important opsonins, such as C3b and its fragments (iC3b and C3dg).27 Phagocytes (either neutrophils or macrophages) can recognize NPs labeled with opsonins via their receptors on the cell surface and eliminate them from the bloodstream.28
The composition of the protein corona depends on the surface and physicochemical properties of the NPs.29 Previous studies have evaluated the interactions of plasma or serum proteins with various NPs, for example, carbon nanotubes,30,31 micelles,32 liposomes,33 polymeric nanospheres,34,35 iron oxide,36 and gold NPs.37 To the best of our knowledge, no systematic studies of the opsonization and activation of the complement system induced by UCAs (microbubbles, nanoemulsions, or nanodroplets) have been published. The shell of UCAs is generally composed of a thin and soft monolayer of phospholipids and lipid-derived polymers.38,39 The gaseous or liquid core endows UCAs with high fluidity and deformability, making them very different from other types of NPs with little or no deformability.
Identifying the materials that are used to prepare Nano-UCAs and understanding their interaction with the immune system are the key to their successful clinical translation. It is well known that the size, shape, hydrophobicity, and polyethylene glycol (PEG) coating of NPs are important factors that affect their interactions with the immune system.40–42 However, little is known about the role of the surface charge of Nano-UCAs in these interactions. In this study, we investigated the role of the surface charge of Nano-UCAs in opsonization, complement activation, and phagocytosis. The process of complement activation was assessed by identifying the composition of the protein corona of Nano-UCAs and quantifying the production of activated C3 and terminal complement complex SC5b-9. The interaction of Nano-UCAs with immune cells was investigated by observing the phagocytosis of NPs using activated THP-1 macrophages. The results of the present study are expected to provide useful insights for understanding the role of nanoscale ultrasound contrast agents in the immune response.
Materials and Methods
Human Serum Specimen Collection
All participants provided informed consent, and the study was approved by the Ethics Committee of West China Hospital of Sichuan University (No. 2021889). The study was conducted in accordance with the Helsinki Declaration. Whole blood samples from the median cubital vein were collected from healthy blood donors at the Department of Ultrasound Imaging, West China Hospital, Sichuan University. The samples were coagulated at room temperature for 2 h and then centrifuged at 2000 g for 20 min to separate the serum.
Synthesis and Characterization of Nano-UCAs
The neutral phospholipid 1,2-dipalmitoyl-sn-glycero-3-phosphocholine (DPPC, S01004 A.V.T Pharmaceutical Co., Ltd, Shanghai, China) was used as the main component of the shell of Nano-UCAs. To prepare neutral (Neu) Nano-UCAs, a 5 molar% amount of 1,2-distearoyl-sn-glycero-3-phosphoethanolamine-N-[methoxy (polyethylene glycol)-2000] (DSPE-mPEG2000, F01008 A.V.T Pharmaceutical Co., Ltd) was added to DPPC to prevent aggregation in vitro and also provide stealth properties to the Nano-UCAs. To prepare Nano-UCAs with a charged shell, either the negatively charged lipid 1,2-dipalmitoyl-sn-glycero-3-phospho-
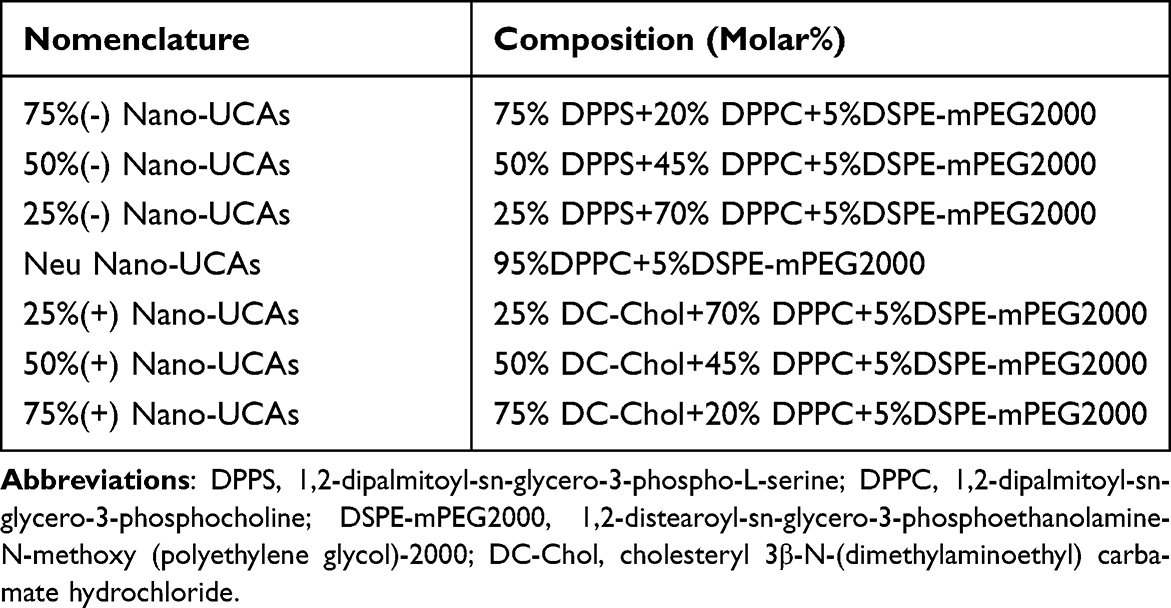 |
Table 1 The Composition and the Nomenclature of Nano-UCAs with Different Surface Charge |
Incubation of Neu Nano-UCAs with Serum to Extract Adsorbed Proteins
The assay system is based on Chen F and Vu Vivian P’s methods.36,43 A 1×10¹² particles/mL concentration of Neu Nano-UCAs in saline was mixed with serum samples obtained from three blood donors in a volume ratio of 1:3 (v/v). At the end of incubation (37 ℃, 1 h), the nanoparticles were recovered and washed three times by centrifugation at 100,000 g in Ca2+/Mg2+-supplemented phosphate-buffered saline (PBS) for 5 min using a Beckman Optima TLX ultracentrifuge. The pellets deposited in the serum were washed with 100 μL 2% sodium dodecyl sulfate (SDS) for 1 h at room temperature to extract the proteins making up the corona. The protein supernatant was recovered by additional ultracentrifugation and stored in frozen aliquots at −80 ℃ until use.
Identification of Proteins in Neu Nano-UCAs Corona
The adsorbed proteins recovered from the surface of the Neu Nano-UCAs were mixed with non-reducing sample loading buffer (P0016N, Native Gel Sample Loading Buffer, 5X, Beyotime Biotechnology, Shanghai, China) and loaded (20 μL per lane) onto 4% stacking sodium dodecyl sulfate-polyacrylamide gels. Electrophoresis was then performed (70 V for 20 min); the resulting gel strips of whole proteins were carefully cut down using a disposable surgical blade. Inside the gel strips, the proteins were dehydrated using acetonitrile (ACN), reduced, alkylated with dithiothreitol and iodoacetamide, and then digested into peptides using trypsin. Peptides (8 μg) were resolubilized in 0.1% formic acid (FA) and analyzed using an EASY-nLC 1200 (Thermo Fisher Scientific, Inc., Waltham, USA) with an Orbitrap Fusion Lumos Tribrid mass spectrometer system (Thermo) in data-dependent acquisition (DDA) mode. The separation column (75 μm × 15 cm, C18 column packed with 3.0 μm C18 particles) was used with a flow rate of 300 nL/min using 0.1% FA (solvent A) and 80% ACN plus 0.1% FA (solvent B) with a 78 min gradient. The LC separation gradient was 5–8% solvent B for 8 min, 8–22% solvent B for 50 min, 22–32% solvent B for 12 min, 32–90% solvent B for 1 min, and 90% solvent B for the last 7 min. Ion source settings, including the spray voltage, sweep gas, and ion transfer tube temperature, were obtained from tune settings and adjusted for current instrument states. For the MS1 scans, the mass ranged from m/z 350 to 1550 with a resolution of 60,000 (at m/z 200), an automatic gain control (AGC) target value was 1 × 10⁶, a maximum injection time was 50 ms, the highest intensity precursor ions were for MS2 analysis in 3 seconds, the minimum abundance of precursor ions is 50,000, and the isolate the window is 2. For the MS2 scan, normalized HCD collision energy was 35%, the resolution was 15,000 (at m/z 200), the AGC target value was set to 5 × 10⁴, and the maximum injection time was 80 ms. The RF lens was 30% and the spectra were collected in profile mode (MS1) and in centroid mode (MS2). Qualitative and quantitative analyses of the MS spectra were performed using the Maxquant software and “Wu Kong” platform (https://www.omicsolution.com/wkomics/main/).
Assay of Activated C3 Bound to Nano-UCAs
In order to study the binding of activated C3 to Nano-UCAs with different surface charges, 1×10¹² particles/mL of neutral and charged Nano-UCAs were mixed with human serum samples in 1:3 (v/v) ratio to prepare the protein supernatant. For each sample, 20 μL aliquots were mixed with non-reducing sodium dodecyl sulfate polyacrylamide gel electrophoresis (SDS-PAGE) loading buffer and boiled for 5 min. The boiled proteins were electrophoretically separated by Tris-Gly 8% gel and transferred to a polyvinylidene fluoride (PVDF) membrane. The membrane was blocked using 5% (w/w) non-fat dry milk in 1×PBS with 0.1% Tween-20 (PBS-T) for 1 h at room temperature and probed with corresponding primary antibodies (mouse monoclonal antibody raised against activated human complement factor C3, I3/15 sc-47687, Santa Cruz Biotechnology, Inc., Dallas, USA) at 4 ℃ overnight, followed by washing the membrane three times with Tris-buffered saline containing 0.05% Tween-20 (TBS-T). Finally, the resulting samples were incubated for 1 h with the corresponding secondary antibodies against the primary antibody species (Mouse IgGκ light chain binding protein conjugated to horseradish peroxidase (HRP), sc-516102, Santa Cruz). The protein band signals on PVDF membrane were visualized using a chemiluminescence imager (ChemiDoc™ MP, Bio-Rad System, Inc., Hercules, USA).
SC5b-9 ELISA
Before and after incubation with Nano-UCAs, the serum was analyzed to determine the SC5b-9 levels using an enzyme-linked immune sorbent assay (ELISA) kit (MicroVue SC5b-9 Plus EIA, Quidel Corporation, San Diego, USA). To quantify the SC5b-9 levels, we used standards SC5b-9 series with concentrations of 10, 40, 110, and 170 ng/mL, according to the manufacturer’s instructions. Standards and samples were added to microassay wells pre-coated with anti-SC5b-9 specific monoclonal antibody. After 1 h of incubation, a wash cycle was performed to remove unbound materials. HRP-conjugated antibodies to antigens on SC5b-9 were added to each well. Incubation with HRP-conjugated antibodies for 30 min was then followed by another wash cycle. Finally, a chromogenic enzyme substrate was added to each well. After reacting with the bound HRP-conjugated antibodies, the substrate turned blue. A reagent was then added to stop color development, resulting in a yellow color. Standard and sample absorbance (A450) values were measured by a microplate reader (Synergy HT, Bio-Tek, Vermont USA). Quantitative analysis of the samples was performed by interpolating the A450 results using the linear regression equation of the standard curve.
Cell Culture
Human pro-monocytic THP-1 cells (CC1904, CellCook Biotechnology Co., Ltd., Guangzhou, China) and human non-small cell lung cancer NCI-H1299 cells (CC0203, CellCook Biotechnology Co., Ltd.) were routinely grown in RPMI 1640 medium (22,400–089, Gibco, Karlsruhe, Germany), containing 10% (v/v) heat-inactivated fetal calf serum (10,100–147, Gibco) supplemented with 10,000 units/mL penicillin and 10,000 units/mL streptomycin (15,140–122, Gibco). Cells were maintained at 37 ℃ in a humidified atmosphere of 95% air and 5% CO2.
Nano-UCAs Uptake by Macrophages
To evaluate Nano-UCAs uptake by macrophages, THP-1 cells were seeded in 35-mm 6-well plates at a density of 1×10⁶ cells/well in the presence of 100 nM phorbol myristate acetate (PMA, P1585, Sigma, St Louis, USA) and allowed to attach to the plates for 48 h. After addition of PMA, differentiated THP-1 cells were incubated with 1×10¹⁰ particles/mL Nano-UCAs labeled with 1,1’-dioctadecyl-3,3,3’,3’-tetramethyl-indocarbocyanine (DiI) perchlorate (C1036, Beyotime Biotechnology) at room temperature for 1 h. After lysosomal fluorescence (C1046, Lyso-tracker red, Beyotime Biotechnology) and nucleus fluorescence (C1022, Hoechst 33,342 blue, Beyotime Biotechnology) staining, cells were fixed and visualized by the laser confocal fluorescence microscopy (LCFM, A1R-MP, Nikon, Tokyo, Japan). For quantitative analysis, after incubation with DiI-labeled Nano-UCAs, THP-1 cells were detached with trypsin EDTA, collected, and analyzed using a flow cytometer (FACS Caliburl, BD Biosciences, Franklin Lake, USA). The labeled Nano-UCAs were also incubated with non-phagocytic NCI-H1299 cells and observed using LCFM, as described above.
Statistical Analysis
The data were analyzed using GraphPad Prism 8 (GraphPad Software, CA, USA). Differences were assessed using the one-way analysis of variance followed by the Newman–Keuls post-hoc test for multiple group comparisons and the Student’s t-test for comparisons between two groups. All quantitative data shown in the figures are presented as mean ± standard deviation (SD).
Results
Characterization of Nano-UCAs with Different Surface Charges
In this study, we prepared seven formulations of Nano-UCAs. In particular, positively and negatively charged Nano-UCAs were prepared by adding different molar ratios of anionic or cationic molecules to the Neu Nano-UCA samples (Table 1); the synthesis is illustrated in Figure 1A. In order to evaluate the role of the surface charge in complement activation, the particle size and corresponding distribution were kept as constant as possible for all formulations. The TEM images in Figure 1B show that the Nano-UCA particles were almost spherical and had a size of approximately 500–600 nm, with a soft smooth surface. The particle size, polydispersity index (PDI), and zeta potential of different Nano-UCA formulations are shown in Figures 1C–E, respectively. The only significant difference between the different nanoparticles is the change in zeta potential. For Neu Nano-UCAs formulated with 95% DPPC + 5% DSPE-mPEG2000, the zeta potential was −0.32±1.95 mV. When the anionic phospholipid DPPS was added to the neutral formulation, the zeta potential decreased gradually from −0.32±1.95 mV (0%) to −11.29±2.01 mV (25%), −22.85±10.81 mV (50%), and −40.95±1.16 mV (75%). In contrast, the zeta potentials of the formulations containing 0%, 25%, 50%, and 75% DC-CHOL increased gradually from −0.32±1.95 mV to 15.80±3.18 mV, 29.16±7.78 mV, and 51.33±2.89 mV, respectively. When stored in saline at 4 ℃, all Nano-UCAs remained relatively stable during the test period (Figure 2).
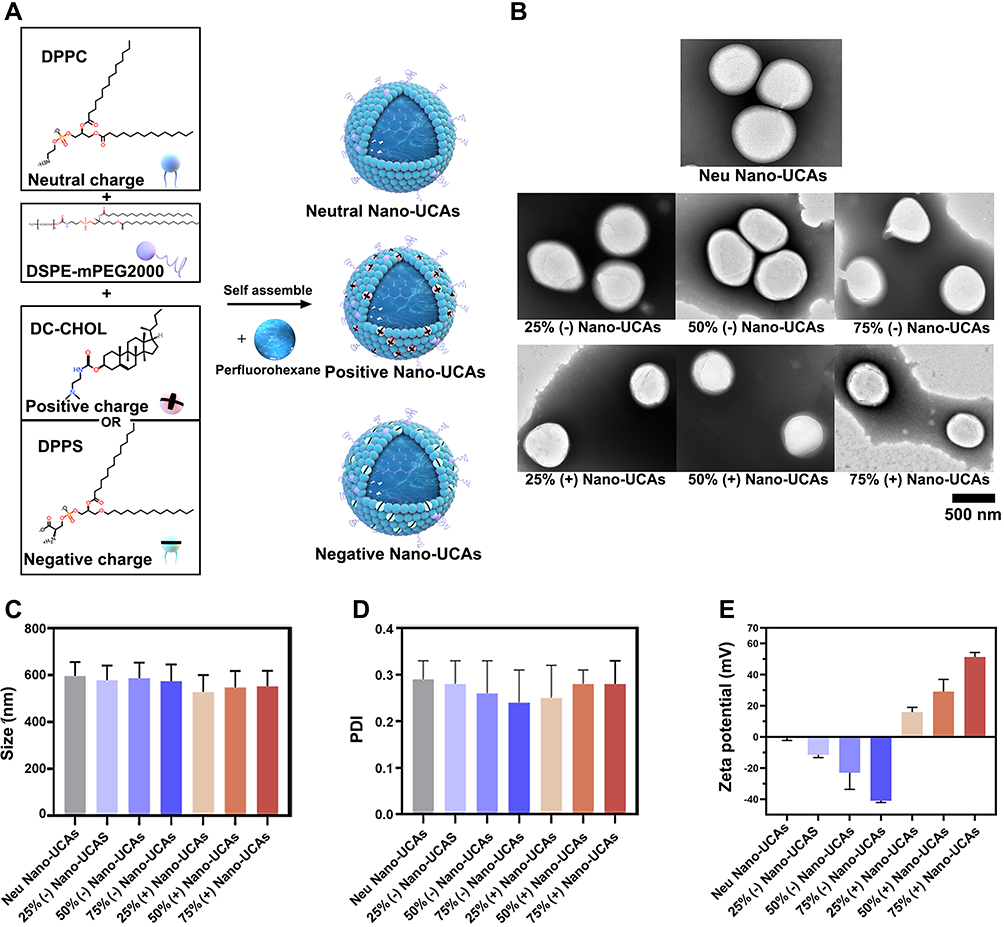 |
Figure 1 Synthesis and characterization of different Nano-UCAs formulations. (A) Schematic representation of Nano-UCAs with various surface charges. Nano-UCAs with neutral, positive, and negative surface charges were prepared with different molar ratios of DPPC (blue ball), DC-CHOL (pink ball), and DPPS (green ball). DSPE-mPEG2000 (5 mol%, purple ball) was added to all formulations to prevent particle aggregation. (B) Transmission electron microscopy images of Nano-UCAs with different surface charges. (C) Mean particle size (nm), (D) mean polydispersity index (PDI), and (E) mean zeta potential (mV) of different Nano-UCAs formulations. |
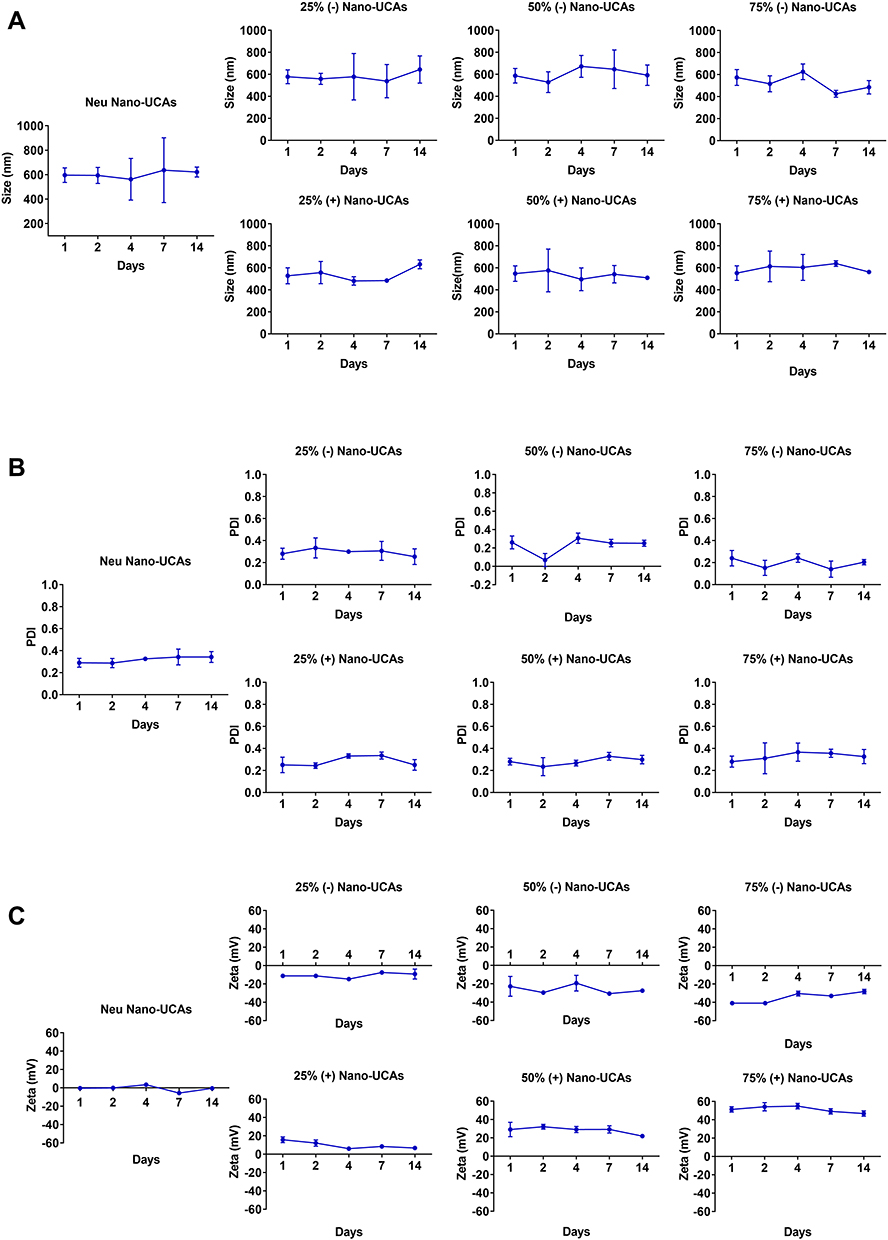 |
Figure 2 In vitro stability of Nano-UCAs. (A) Mean particle size (nm), (B) mean polydispersity index (PDI), and (C) mean zeta potential (mV) of different formulations in saline at 1, 2, 4, 7, and 14 days. Each dot represents the mean ± SD of three replicates. |
Relationship Between Protein Corona, Activated C3, and Surface Charge of Nano-UCAs
To investigate the composition of the protein corona covering the Neu Nano-UCAs, we performed MS analysis of the serum proteins bound to Nano-UCAs (Figure 3A and Supplementary Table 1). C3 was among the most abundant proteins in all three tested serum samples. To further study the influence of surface charge on the opsonization, the activated C3 in the protein corona was determined using the Western blot (WB) analysis. Figure 3B suggests that activated C3 was bound to a protein cluster rather than to the Nano-UCA surface alone: the eluted activated C3 of all surface-charged Nano-UCAs showed a smeared high-molecular-weight pattern (≥270 kDa), compared to that of purified C3 with a molecular weight of 195 kDa. The experiment was repeated three times using three different serum samples. Based on the integrated density (ID) calculated from the gray value (dots per inch, Figure 3C) of the activated C3 WB band by ImageJ software (1.51j8 version, National Institutes of Health, USA), the neutral Nano-UCAs adsorbed the lowest amount of activated C3 (836.45±320.34 ID). The Nano-UCAs with a lower charge bound a relatively low amount of activated C3, with 3490.56±1450.29 ID and 1481.39±40.59 ID for the 25% negatively charged and 25% positively charged Nano-UCAs, respectively. The 50% (-) and 50% (+) Nano-UCAs adsorbed a higher amount of activated C3 than the lower-charge samples, with 6072.28±1049.22 ID and 4145.03±286.69 ID for the negatively and positively charged Nano-UCAs, respectively. The high-charge Nano-UCAs adsorbed the highest amount of activated C3, with 19,448.67±522.58 ID and 18,775.48±1950.21 ID for 75% (-) and 75% (+) Nano-UCAs, respectively.
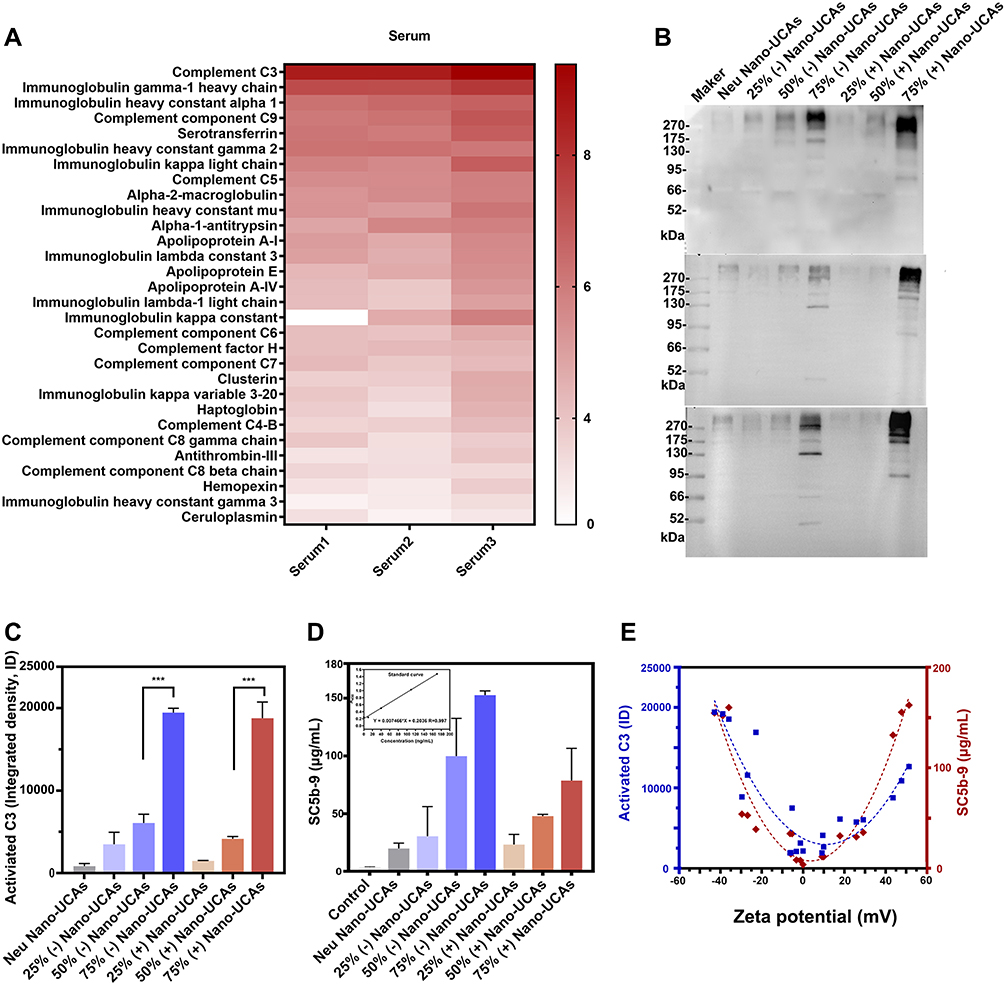 |
Figure 3 Role of surface charge of nanoscale ultrasound contrast agents in the activation of complement system and phagocytosis. (A) Protein corona formed on Neu Nano-UCAs: heat map of top 30 proteins identified in coronas. Proteins are ranked according to the logarithm of the confidence score determined from the number of peptides and the quality of the MS spectra. (B) Western blot non-reducing bands of activated C3 bound to differently charged Nano-UCA surfaces in serum samples. The experiment was repeated three times using three different serum samples. (C) Gray values analysis of WB bands of activated C3. The experiment was repeated three times using three different serum samples. Data are shown as mean ± SD (***P < 0.001). (D) Enzyme-linked immunosorbent assay for quantitative detection of human SC5b-9. The graph in the top-right corner shows the standard curve of SC5b-9, and the histogram below it shows the quantity of SC5b-9 produced in serum samples incubated with differently charged Nano-UCAs. The control column displays SC5b-9 levels in serum before incubation with Nano-UCAs. Data are shown as mean ± SD of three repeated experiments. (E) Effects of surface charge (zeta potential, mV) on the levels of activated C3 (determined by Western blot analysis, blue) and SC5b-9 (determined by ELISA, red) in serum after incubation with Nano-UCAs. For a given Nano-UCAs formulation, each pair of data in the figure represents an individual measurement. |
Analysis of Complement Activation
Serum SC5b-9 levels were measured to assess the effect of the Nano-UCAs on complement activation. To determine the concentration of SC5b-9, a standard curve was obtained using the standard samples provided with the SC5b-9 Plus EIA kit. The slope, intercept, and correlation coefficient of the best-fit line lay within the ranges specified by the manufacturer (y = 0.007466x + 0.2036, r = 0.997). Figure 3D reveals that an increased surface charge led to increased production of SC5b-9 in the serum. For instance, the amount of SC5b-9 produced by Neu Nano-UCAs was 19.84±4.70 µg/mL, while the 25% (-) and 25% (+) Nano-UCAs produced SC5b-9 levels of 30.41±25.69 and 23.27±8.82 µg/mL, respectively. For the 50% (-) and 50% (+) Nano-UCAs, the produced amounts of SC5b-9 were 99.85±32.70 and 47.87±1.52 µg/mL, respectively. Similar to the activated C3 bound on Nano-UCAs, 75% (-) and 75% (+) Nano-UCAs produced the highest amounts of SC5b-9 complex: 152.65±3.65 and 78.64±27.93 µg/mL, respectively. These results indicate a significant correlation between activated C3, SC5b-9, and the surface charge of the Nano-UCAs (Figure 3E), suggesting that the activation of the complement system by the Nano-UCAs depends on their surface charge.
Nano-UCAs Uptake by Macrophages
To further examine whether the Nano-UCAs were simply adsorbed on the cell surface or engulfed by macrophages, THP-1 and NCI-H1299 cells were separately incubated with DiI-labeled Nano-UCAs. After vigorously washing the cells, almost all Nano-UCAs disappeared from the culture medium, whereas they were still observed in the THP-1 cells (Figure 4). LCFM imaging revealed that the Nano-UCAs were localized within fluorescently labeled green lysosomes (Figure 4). Figures 5A–D shows the uptake of differently charged Nano-UCAs by THP-1 cells. All charged Nano-UCAs exhibited strong red fluorescence inside the THP-1 cells (Figure 5A). The analysis of the mean fluorescence intensity (MFI) (Figure 5B) indicated that the uptake of Nano-UCAs by THP-1 cells increased significantly with increasing surface charge density, especially for Nano-UCAs with 75% positive charge. The MFI values of 25% (-), 50% (-), and 75% (-) Nano-UCAs were 10.6, 11.5, and 11.9 times higher than those of the Neu Nano-UCAs, respectively. Moreover, the MFI values of 25% (+), 50% (+), and 75% (+) Nano-UCAs were 9.0, 9.9, and 28.5 times higher than those of the Neu Nano-UCAs, respectively. Similar quantitative results were obtained by flow cytometry (Figures 5C and D).
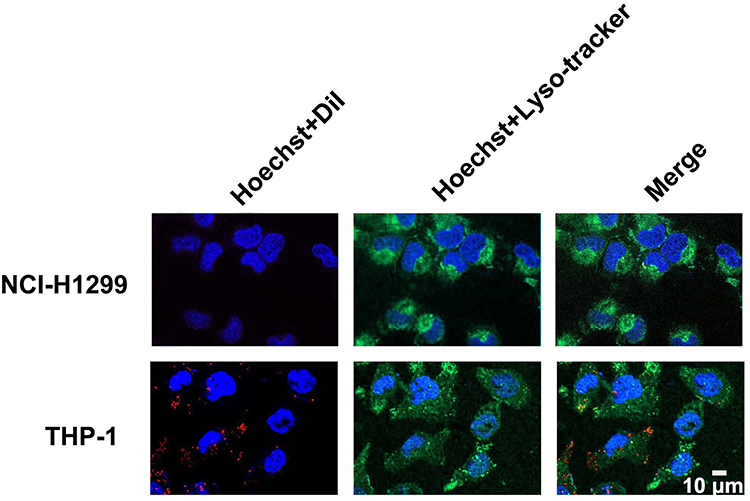 |
Figure 4 Confocal laser scanning microscopy of phagocytosis of Neu Nano-UCAs by THP-1 macrophages. In this experiment, the nanoparticles were first incubated with donor serum to produce the protein corona and then incubated with cells. Non-phagocytic NCI-H1299 cells were also incubated with the same donor serum and used for comparison. DiI-labeled Neu Nano-UCAs (red) were observed in THP-1 cells after intensive washing with PBS, but were not detected in NCI-H1299 cells. |
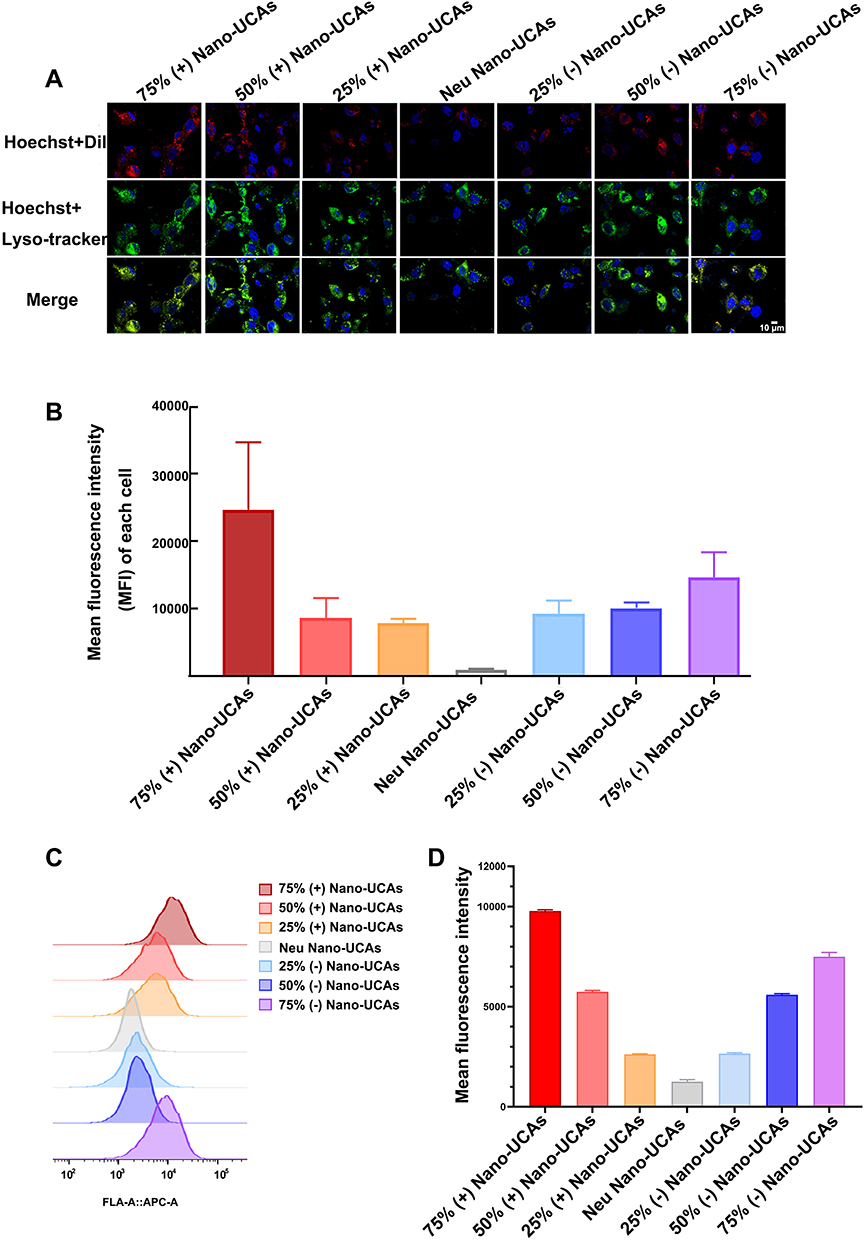 |
Figure 5 Phagocytosis of Nano-UCAs with different surface charges by THP-1 cells. (A) Confocal laser scanning microscopy images of cell uptake of Nano-UCAs after serum incubation to generate protein corona. Lysosomes of THP-1 cells, cell nuclei, and Nano-UCAs were labeled with green, blue, and red fluorescent dye, respectively. All Nano-UCAs were incubated with THP-1 cells for 1 h. Scale bar = 10 mm. (B) Quantification of cell uptake based on MFI values of each cell obtained from confocal laser scanning microscopy. (C) Cell uptake of Nano-UCAs determined by flow cytometry. (D) Quantitative cell uptake of Nano-UCAs with different surface charges, obtained by flow cytometry. |
Discussion
NPs hold great potential for application in nanomedicine, however, their ability to target diseased tissues is still largely unknown, with only 0.7% (median) of the administered NPs dose found to be delivered to solid tumors.44 One of the direct causes for this low efficiency is that the NPs are rapidly cleared by the innate immune system.45,46
The opsonization of blood proteins and uptake by the MPS have been suggested to be the main mechanisms for the rapid removal of liposomes from the blood, affecting their lifespan.47,48 The outer layer of the liposomes is similar to that of MBs and Nano-UCAs, consisting of neutral and/or charged phospholipids. Klapper et al found that neutral liposomes made with the phospholipid dimyristoyl phosphatidylcholine (DMPC) incubated in plasma led to the generation of complement activation products (C3a and SC5b-9).49 Van den Hoven et al reported that empty liposomes containing 5 mol% DSPE-PEG2000 did not significantly induce complement activation (C3, SC5b-9).50 Chonn et al conducted an in-depth study on the effect of the liposome surface charge on complement activation. They used serum samples obtained from healthy humans or guinea pigs incubated with liposomes, followed by determining the residual hemolytic activity of the serum as a measure of complement activation. They found that the surface charge of liposomes was a key factor in complement activation regardless of the surface charge type.51
The innate immune system interacts not only with liposomes, but with all nano- and micro- particles. Lundqvist et al used polystyrene NPs coated with different polymers to conduct a systematic assessment of the effects of the surface charge and size of NPs on the protein corona.29 They found that both the size and surface charge played an important role in formation of the corona of NPs. They also showed that most proteins involved in the complement pathway, such as C3 and the complement factor H, can be adsorbed on the surface of neutral NPs. Our proteomic analysis showed that 600-nm Neu Nano-UCAs incubated with human serum adsorbed more than 30 proteins on their surface (Figure 3A and Supplementary Table 1). Among these proteins, C3 exhibited the highest content, and was bound to other proteins (forming a cluster) rather than to the native nanoparticle surface (Figure 3B), as also reported in other studies.43 Using dextran-coated iron oxide nanoworms incubated in human serum and plasma, Chen et al revealed that the nanoworms were rapidly opsonized by C3 via the alternative pathway of complement system.36 They also demonstrated that C3 covalently bound to the protein corona of NPs rather than to the dextran shell.36 Although the NPs used in the present study are very different from those considered by Chen et al in terms of size, shape, surface coating, and core material, their binding to C3 was rather similar. Although all our Nano-UCAs contained 5 mol% of DSPE-PEG2000, the PEGylation did not prevent either the formation of protein corona or complement activation.
SonazoidTM microbubbles coated with 100% negatively charged phospholipid hydrogenated egg phosphatidylserine (HEPS) are preferably taken up by Kupffer cells in liver,52 providing a parenchyma-specific contrast image denoted as Kupffer phase image.53 However, the exact mechanism by which SonazoidTM microbubbles are specifically accumulated in Kupffer cells is still unclear. Only one previous study investigated the role of the MB surface charge in contrast-enhanced ultrasound imaging.54 Some microbubble agents adhere to activated leukocytes in postcapillary venules via cell surface integrin or opsonization of complement components, resulting in persistent myocardial contrast enhancement in areas of tissue inflammation.54 Furthermore, Fisher et al showed that negatively charged microbubbles (2–3 μm) induced capillary retention, and suggested that this retention was mediated by the attachment of activated C3b to the surface of MBs.55 They used flow cytometry to analyze the complement bound to the surface of MBs and found that C3b mainly bound to anionic MBs, but exhibited much lower adsorption on the surface of neutral MBs containing PEG-40 stearate. Our study further suggests that, regardless of their charge, all Nano-UCAs could induce complement activation; a higher surface charge led to higher amounts of activated C3 binding to NPs (Figure 3C) and of SC5b-9 produced in serum (Figure 3D). Figure 3E summarizes the above findings: the surface charge (or the absolute zeta potential value) of the Nano-UCAs plays an important role in opsonization (activated C3) and complement activation (SC5b-9).
Following complement activation, the Nano-UCAs are cleared by immune cells in vivo. The binding of the complement component C3b to the NPs surface leads to phagocytosis, due to the presence of complement receptors on phagocytic cells.56,57 As shown in Figure 3E, compared with the Neu Nano-UCAs, the charged Nano-UCAs adsorbed or activated the highest amounts of C3 and SC5b-9, leading to their efficient engulfment by macrophages (Figure 5A). This finding may partly explain the mechanism of the specific Kupffer phase imaging of SonazoidTM microbubbles.
The opsonization of NPs is a key step in complement activation, phagocyte recognition, and clearance from blood circulation. Most attempts to avoid or reduce the binding of opsonins have focused on the preparation of stealth NPs. Several strategies have been explored, including using smaller inorganic NPs,58 cell-mimicking microspheres (coating the particles with blood cell membranes),59,60 preparing particles with natural biomolecules,61 controlling protein corona components,62 using cell vesicles as drug carriers,63 or combining drug carriers with histocompatibility molecules.64 Unfortunately, many of these approaches often ignore the role of the nanoparticle surface charge in the innate immune system, despite its importance for the clinical safety and efficacy of nanomedicines.
Recent studies showed that the low targeting efficiency of NPs to tumor sites (0.7–2.2%) severely hinders their clinical application in cancer treatment.44,65 Potential toxic effects, such as anaphylactoid reactions associated with charged Nano-UCAs, are another important issue affecting their clinical translation, as already reported for liposomes and other types of nanomedicines.50 These aspects should be carefully considered in future formulation designs.
Conclusion
In this study, we synthesized Nano-UCAs with different surface charges. Our results show that the surface charge plays an important role in the opsonization and complement activation. Charged Nano-UCAs show a higher tendency to interact with C3 and produce more SC5b-9 compared to neutral Nano-UCAs. Furthermore, the charged Nano-UCAs are efficiently engulfed by macrophages. These results allow us to identify the corona composition of the Nano-UCAs and demonstrate the importance of the surface charge in the complement activation and uptake of Nano-UCAs by macrophages.
Acknowledgments
Thank Yi Zhong, Tao Su and Shisheng Wang (West China-Washington Mitochondria and Metabolism Research Center, West China Hospital, Sichuan University) for relative MS data acquisition and analysis.
Disclosure
The authors report no conflicts of interest in this work.
References
1. Zlitni A, Gambhir SS. Molecular imaging agents for ultrasound. Curr Opin Chem Biol. 2018;45:113–120. doi:10.1016/j.cbpa.2018.03.017
2. Frinking P, Segers T, Luan Y, Tranquart F. Three decades of ultrasound contrast agents: a review of the past, present and future improvements. Ultrasound Med Biol. 2020;46(4):892–908. doi:10.1016/j.ultrasmedbio.2019.12.008
3. Chong WK, Papadopoulou V, Dayton PA. Imaging with ultrasound contrast agents: current status and future. Abdom Radiol. 2018;43(4):762–772. doi:10.1007/s00261-018-1516-1
4. Yang C, Li Y, Du M, Chen Z. Recent advances in ultrasound-triggered therapy. J Drug Target. 2019;27(1):33–50. doi:10.1080/1061186X.2018.1464012
5. de Leon A, Perera R, Nittayacharn P, Cooley M, Jung O, Exner AA. Ultrasound contrast agents and delivery systems in cancer detection and therapy. Adv Cancer Res. 2018;139:57–84. doi:10.1016/bs.acr.2018.04.002
6. Duan L, Yang L, Jin J, et al. Micro/nano-bubble-assisted ultrasound to enhance the EPR effect and potential theranostic applications. Theranostics. 2020;10(2):462–483. doi:10.7150/thno.37593
7. Rapoport N, Payne A, Dillon C, Shea J, Scaife C, Gupta R. Focused ultrasound-mediated drug delivery to pancreatic cancer in a mouse model. J Ther Ultrasound. 2013;1:11. doi:10.1186/2050-5736-1-11
8. Rapoport N, Nam KH, Gupta R, et al. Ultrasound-mediated tumor imaging and nanotherapy using drug loaded, block copolymer stabilized perfluorocarbon nanoemulsions. J Control Release. 2011;153(1):4–15. doi:10.1016/j.jconrel.2011.01.022
9. Pochon S, Tardy I, Bussat P, et al. BR55: a lipopeptide-based VEGFR2-targeted ultrasound contrast agent for molecular imaging of angiogenesis. Invest Radiol. 2010;45(2):89–95. doi:10.1097/RLI.0b013e3181c5927c
10. Pysz MA, Machtaler SB, Seeley ES, et al. Vascular endothelial growth factor receptor type 2-targeted contrast-enhanced US of pancreatic cancer neovasculature in a genetically engineered mouse model: potential for earlier detection. Radiology. 2015;274(3):790–799. doi:10.1148/radiol.14140568
11. Devulapally R, Lee T, Barghava-Shah A, et al. Ultrasound-guided delivery of thymidine kinase-nitroreductase dual therapeutic genes by PEGylated-PLGA/PIE nanoparticles for enhanced triple negative breast cancer therapy. Nanomedicine. 2018;13(9):1051–1066. doi:10.2217/nnm-2017-0328
12. Gao Z, Kennedy AM, Christensen DA, Rapoport NY. Drug-loaded nano/microbubbles for combining ultrasonography and targeted chemotherapy. Ultrasonics. 2008;48(4):260–270. doi:10.1016/j.ultras.2007.11.002
13. Unger EC, Mccreery TP, Sweitzer RH. Ultrasound enhances gene expression of liposomal transfection. Invest Radiol. 1997;32(12):723–727. doi:10.1097/00004424-199712000-00001
14. Wang M, Hou Z, Liu S, et al. A Multifunctional Nanovaccine based on L-arginine-loaded black mesoporous titania: ultrasound-triggered synergistic cancer sonodynamic therapy/gas therapy/immunotherapy with remarkably enhanced efficacy. Small. 2021;17(6):e2005728. doi:10.1002/smll.202005728
15. Dewitte H, Van Lint S, Heirman C, et al. The potential of antigen and TriMix sonoporation using mRNA-loaded microbubbles for ultrasound-triggered cancer immunotherapy. J Control Release. 2014;194:28–36. doi:10.1016/j.jconrel.2014.08.011
16. Lakshmanan A, Jin Z, Nety SP, et al. Acoustic biosensors for ultrasound imaging of enzyme activity. Nat Chem Biol. 2020;16(9):988–996. doi:10.1038/s41589-020-0591-0
17. Wu H, He Y, Wu H, et al. Near-infrared fluorescence imaging-guided focused ultrasound-mediated therapy against Rheumatoid Arthritis by MTX-ICG-loaded iRGD-modified echogenic liposomes. Theranostics. 2020;10(22):10092–10105. doi:10.7150/thno.44865
18. Dong W, Huang A, Huang J, et al. Plasmid-loadable magnetic/ultrasound-responsive nanodroplets with a SPIO-NP dispersed perfluoropentane core and lipid shell for tumor-targeted intracellular plasmid delivery. Biomater Sci. 2020;8(19):5329–5345. doi:10.1039/d0bm00699h
19. Martins YA, Fonseca M, Pavan TZ, Lopez R. Bifunctional therapeutic application of low-frequency ultrasound associated with zinc phthalocyanine-loaded micelles. Int J Nanomed. 2020;15:8075–8095. doi:10.2147/IJN.S264528
20. Ma J, Xu CS, Gao F, Chen M, Li F, Du LF. Diagnostic and therapeutic research on ultrasound microbubble/nanobubble contrast agents (review). Mol Med Rep. 2015;12(3):4022–4028. doi:10.3892/mmr.2015.3941
21. Shen Y, Pi Z, Yan F, et al. Enhanced delivery of paclitaxel liposomes using focused ultrasound with microbubbles for treating nude mice bearing intracranial glioblastoma xenografts. Int J Nanomed. 2017;12:5613–5629. doi:10.2147/IJN.S136401
22. Abdalkader R, Kawakami S, Unga J, et al. Evaluation of the potential of doxorubicin loaded microbubbles as a theranostic modality using a murine tumor model. Acta Biomater. 2015;19:112–118. doi:10.1016/j.actbio.2015.03.014
23. Manta S, Renault G, Delalande A, et al. Cationic microbubbles and antibiotic-free miniplasmid for sustained ultrasound-mediated transgene expression in liver. J Control Release. 2017;262:170–181. doi:10.1016/j.jconrel.2017.07.015
24. Ferreira CD, Nunes IL. Oil nanoencapsulation: development, application, and incorporation into the food market. Nanoscale Res Lett. 2019;14(1):9. doi:10.1186/s11671-018-2829-2
25. El-Housiny S, Shams EM, El-Attar YA, et al. Fluconazole-loaded solid lipid nanoparticles topical gel for treatment of pityriasis versicolor: formulation and clinical study. Drug Deliv. 2018;25(1):78–90. doi:10.1080/10717544.2017.1413444
26. La-Beck NM, Gabizon AA. Nanoparticle interactions with the immune system: clinical implications for liposome-based cancer chemotherapy. Front Immunol. 2017;8:416. doi:10.3389/fimmu.2017.00416
27. Nissila E, Hakala P, Leskinen K, et al. Complement factor H and apolipoprotein E participate in regulation of inflammation in THP-1 macrophages. Front Immunol. 2018;9:2701. doi:10.3389/fimmu.2018.02701
28. Underhill DM, Ozinsky A. Phagocytosis of microbes: complexity in action. Annu Rev Immunol. 2002;20:825–852. doi:10.1146/annurev.immunol.20.103001.114744
29. Lundqvist M, Stigler J, Elia G, Lynch I, Cedervall T, Dawson KA. Nanoparticle size and surface properties determine the protein corona with possible implications for biological impacts. Proc Natl Acad Sci USA. 2008;105(38):14265–14270. doi:10.1073/pnas.0805135105
30. Andersen AJ, Robinson JT, Dai H, Hunter AC, Andresen TL, Moghimi SM. Single-walled carbon nanotube surface control of complement recognition and activation. Acs Nano. 2013;7(2):1108–1119. doi:10.1021/nn3055175
31. Salvador-Morales C, Flahaut E, Sim E, Sloan J, Green ML, Sim RB. Complement activation and protein adsorption by carbon nanotubes. Mol Immunol. 2006;43(3):193–201. doi:10.1016/j.molimm.2005.02.006
32. Hamad I, Hunter AC, Moghimi SM. Complement monitoring of Pluronic 127 gel and micelles: suppression of copolymer-mediated complement activation by elevated serum levels of HDL, LDL, and apolipoproteins AI and B-100. J Control Release. 2013;170(2):167–174. doi:10.1016/j.jconrel.2013.05.030
33. Devine DV, Wong K, Serrano K, Chonn A, Cullis PR. Liposome-complement interactions in rat serum: implications for liposome survival studies. Biochim Biophys Acta. 1994;1191(1):43–51.
34. Borchard G, Kreuter J. The role of serum complement on the organ distribution of intravenously administered poly (methyl methacrylate) nanoparticles: effects of pre-coating with plasma and with serum complement. Pharm Res. 1996;13(7):1055–1058.
35. Hamad I, Al-Hanbali O, Hunter AC, Rutt KJ, Andresen TL, Moghimi SM. Distinct polymer architecture mediates switching of complement activation pathways at the nanosphere-serum interface: implications for stealth nanoparticle engineering. Acs Nano. 2010;4(11):6629–6638. doi:10.1021/nn101990a
36. Chen F, Wang G, Griffin JI, et al. Complement proteins bind to nanoparticle protein corona and undergo dynamic exchange in vivo. Nat Nanotechnol. 2017;12(4):387–393. doi:10.1038/nnano.2016.269
37. Dobrovolskaia MA, Patri AK, Zheng J, et al. Interaction of colloidal gold nanoparticles with human blood: effects on particle size and analysis of plasma protein binding profiles. Nanomed Uk. 2009;5(2):106–117. doi:10.1016/j.nano.2008.08.001
38. Helfield B. A review of phospholipid encapsulated ultrasound contrast agent microbubble physics. Ultrasound Med Biol. 2019;45(2):282–300. doi:10.1016/j.ultrasmedbio.2018.09.020
39. Stride E, Segers T, Lajoinie G, et al. Microbubble agents: new directions. Ultrasound Med Biol. 2020;46(6):1326–1343. doi:10.1016/j.ultrasmedbio.2020.01.027
40. Balogh LP, Nigavekar SSP, Nair BMP, et al. Significant effect of size on the in vivo biodistribution of gold composite nanodevices in mouse tumor models. Nanomed Uk. 2007;3(4):281–296. doi:10.1016/j.nano.2007.09.001
41. Meszaros T, Kozma GT, Shimizu T, et al. Involvement of complement activation in the pulmonary vasoactivity of polystyrene nanoparticles in pigs: unique surface properties underlying alternative pathway activation and instant opsonization. Int J Nanomed. 2018;13:6345–6357. doi:10.2147/IJN.S161369
42. Xiao K, Li Y, Luo J, et al. The effect of surface charge on in vivo biodistribution of PEG-oligocholic acid based micellar nanoparticles. Biomaterials. 2011;32(13):3435–3446. doi:10.1016/j.biomaterials.2011.01.021
43. Vu VP, Gifford GB, Chen F, et al. Immunoglobulin deposition on biomolecule corona determines complement opsonization efficiency of preclinical and clinical nanoparticles. Nat Nanotechnol. 2019;14(3):260–268. doi:10.1038/s41565-018-0344-3
44. Wilhelm S, Tavares AJ, Dai Q, et al. Analysis of nanoparticle delivery to tumours. Nat Rev Mater. 2016;1(5):1. doi:10.1038/natrevmats.2016.14
45. Shi J, Kantoff PW, Wooster R, Farokhzad OC. Cancer nanomedicine: progress, challenges and opportunities. Nat Rev Cancer. 2017;17(1):20–37. doi:10.1038/nrc.2016.108
46. Alexis F, Pridgen E, Molnar LK, Farokhzad OC. Factors affecting the clearance and biodistribution of polymeric nanoparticles. Mol Pharm. 2008;5(4):505–515. doi:10.1021/mp800051m
47. Moghimi SM, Szebeni J. Stealth liposomes and long circulating nanoparticles: critical issues in pharmacokinetics, opsonization and protein-binding properties. Prog Lipid Res. 2003;42(6):463–478. doi:10.1016/s0163-7827(03)00033-x
48. Szebeni J, Moghimi SM. Liposome triggering of innate immune responses: a perspective on benefits and adverse reactions. J Liposome Res. 2009;19(2):85–90. doi:10.1080/08982100902792855
49. Klapper Y, Hamad OA, Teramura Y, et al. Mediation of a non-proteolytic activation of complement component C3 by phospholipid vesicles. Biomaterials. 2014;35(11):3688–3696. doi:10.1016/j.biomaterials.2013.12.085
50. van den Hoven JM, Nemes R, Metselaar JM, et al. Complement activation by PEGylated liposomes containing prednisolone. Eur J Pharm Sci. 2013;49(2):265–271. doi:10.1016/j.ejps.2013.03.007
51. Chonn A, Cullis PR, Devine DV. The role of surface charge in the activation of the classical and alternative pathways of complement by liposomes. J Immunol. 1991;146(12):4234–4241.
52. Snipstad S, Hanstad S, Bjorkoy A, Morch Y, de Lange DC. Sonoporation using nanoparticle-loaded microbubbles increases cellular uptake of nanoparticles compared to co-incubation of nanoparticles and microbubbles. Pharmaceutics. 2021;13(5):640. doi:10.3390/pharmaceutics13050640
53. Park HS, Kim YJ, Yu MH, Jung SI, Jeon HJ. Real-time contrast-enhanced sonographically guided biopsy or radiofrequency ablation of focal liver lesions using perflurobutane microbubbles (sonazoid): value of Kupffer-phase imaging. J Ultrasound Med. 2015;34(3):411–421. doi:10.7863/ultra.34.3.411
54. Lindner JR, Coggins MP, Kaul S, Klibanov AL, Brandenburger GH, Ley K. Microbubble persistence in the microcirculation during ischemia/reperfusion and inflammation is caused by integrin- and complement-mediated adherence to activated leukocytes. Circulation. 2000;101(6):668–675. doi:10.1161/01.cir.101.6.668
55. Fisher NG, Christiansen JP, Klibanov A, Taylor RP, Kaul S, Lindner JR. Influence of microbubble surface charge on capillary transit and myocardial contrast enhancement. J Am Coll Cardiol. 2002;40(4):811–819. doi:10.1016/s0735-1097(02)02038-7
56. Brown EJ. Complement receptors, adhesion, and phagocytosis. Infect Agents Dis. 1992;1(2):63–70.
57. Sengelov H. Complement receptors in neutrophils. Crit Rev Immunol. 1995;15(2):107–131.
58. Perry JL, Herlihy KP, Napier ME, Desimone JM. PRINT: a novel platform toward shape and size specific nanoparticle theranostics. Acc Chem Res. 2011;44(10):990–998. doi:10.1021/ar2000315
59. Gao M, Liang C, Song X, et al. Erythrocyte-membrane-enveloped perfluorocarbon as nanoscale artificial red blood cells to relieve tumor hypoxia and enhance cancer radiotherapy. Adv Mater. 2017;29(35):1701429. doi:10.1002/adma.201701429
60. He H, Guo C, Wang J, et al. Leutusome: a biomimetic nanoplatform integrating plasma membrane components of leukocytes and tumor cells for remarkably enhanced solid tumor homing. Nano Lett. 2018;18(10):6164–6174. doi:10.1021/acs.nanolett.8b01892
61. Peng Q, Zhang S, Yang Q, et al. Preformed albumin corona, a protective coating for nanoparticles based drug delivery system. Biomaterials. 2013;34(33):8521–8530. doi:10.1016/j.biomaterials.2013.07.102
62. Cifuentes-Rius A, de Puig H, Kah JC, Borros S, Hamad-Schifferli K. Optimizing the properties of the protein corona surrounding nanoparticles for tuning payload release. Acs Nano. 2013;7(11):10066–10074. doi:10.1021/nn404166q
63. Greening DW, Gopal SK, Xu R, Simpson RJ, Chen W. Exosomes and their roles in immune regulation and cancer. Semin Cell Dev Biol. 2015;40:72–81. doi:10.1016/j.semcdb.2015.02.009
64. Rodriguez PL, Harada T, Christian DA, Pantano DA, Tsai RK, Discher DE. Minimal “self” peptides that inhibit phagocytic clearance and enhance delivery of nanoparticles. Science. 2013;339(6122):971–975. doi:10.1126/science.1229568
65. Cheng YH, He C, Riviere JE, Monteiro-Riviere NA, Lin Z. Meta-analysis of nanoparticle delivery to tumors using a physiologically based pharmacokinetic modeling and simulation approach. Acs Nano. 2020;14(3):3075–3095. doi:10.1021/acsnano.9b08142
 © 2022 The Author(s). This work is published and licensed by Dove Medical Press Limited. The full terms of this license are available at https://www.dovepress.com/terms.php and incorporate the Creative Commons Attribution - Non Commercial (unported, v3.0) License.
By accessing the work you hereby accept the Terms. Non-commercial uses of the work are permitted without any further permission from Dove Medical Press Limited, provided the work is properly attributed. For permission for commercial use of this work, please see paragraphs 4.2 and 5 of our Terms.
© 2022 The Author(s). This work is published and licensed by Dove Medical Press Limited. The full terms of this license are available at https://www.dovepress.com/terms.php and incorporate the Creative Commons Attribution - Non Commercial (unported, v3.0) License.
By accessing the work you hereby accept the Terms. Non-commercial uses of the work are permitted without any further permission from Dove Medical Press Limited, provided the work is properly attributed. For permission for commercial use of this work, please see paragraphs 4.2 and 5 of our Terms.