")
Back to Journals » Journal of Asthma and Allergy » Volume 17
Study on Predicting Clinical Stage of Patients with Bronchial Asthma Based on CT Radiomics
Authors Chen X, Wang X, Huang S, Luo W, Luo Z, Chen Z
Received 3 November 2023
Accepted for publication 21 March 2024
Published 27 March 2024 Volume 2024:17 Pages 291—303
DOI https://doi.org/10.2147/JAA.S448064
Checked for plagiarism Yes
Review by Single anonymous peer review
Peer reviewer comments 2
Editor who approved publication: Dr Luis Garcia-Marcos
Xiaodong Chen,1,* Xiangyuan Wang,1,* Shangqing Huang,1 Wenxuan Luo,1 Zebin Luo,1,* Zipan Chen2,*
1Radiology Imaging Center, Affiliated Hospital of Guangdong Medical University, Zhanjiang City, People’s Republic of China; 2Health Management Center, Affiliated Hospital of Guangdong Medical University, Zhanjiang City, People’s Republic of China
*These authors contributed equally to this work
Correspondence: Zipan Chen; Zebin Luo, Email [email protected]; [email protected]
Objective: To explore the value of a new model based on CT radiomics in predicting the staging of patients with bronchial asthma (BA).
Methods: Patients with BA from 2018 to 2021 were retrospectively analyzed and underwent plain chest CT before treatment. According to the guidelines for the prevention and treatment of BA (2016 edition), they were divided into two groups: acute attack and non-acute attack. The images were processed as follows: using Lung Kit software for image standardization and segmentation, using AK software for image feature extraction, and using R language for data analysis and model construction (training set: test set = 7: 3). The efficacy and clinical effects of the constructed model were evaluated with ROC curve, sensitivity, specificity, calibration curve and decision curve.
Results: A total of 112 patients with BA were enrolled, including 80 patients with acute attack (range: 2– 86 years old, mean: 53.89± 17.306 years old, males of 33) and 32 patients with non-acute attack (range: 4– 79 years old, mean: 57.38± 19.223 years old, males of 18). A total of 10 imaging features are finally retained and used to construct model using multi-factor logical regression method. In the training group, the AUC, sensitivity and specificity of the model was 0.881 (95% CI:0.808– 0.955), 0.804 and 0.818, separately; while in the test group, it was 0.792 (95% CI:0.608– 0.976), 0.792 and 0.80, respectively.
Conclusion: The model constructed based on radiomics has a good effect on predicting the staging of patients with BA, which provides a new method for clinical diagnosis of staging in BA patients.
Keywords: bronchial asthma, BA, Radiomics, computed tomography, CT
Introduction
Bronchial asthma (BA) is a chronic respiratory disease characterized by airway hyperresponsiveness, inflammation and mucus secretion. Its clinical manifestations are reversible airway narrowing (wheezing, dyspnea) and cough. It is one of the most prevalent chronic respiratory diseases, affecting approximately 339 million people worldwide, killing more than 1000 people worldwide every day, and its incidence is increasing every year. Accurate diagnosis and systematic drug treatment strategies are crucial for the treatment of BA.1,2 Currently, the staging of asthma is usually determined based on symptoms alone. Since these symptoms are not specific to asthma, about 30% of asthma patients are misdiagnosed by doctors when diagnosed based on symptoms alone.3 Pulmonary function tests can also be used for the diagnosis and severity classification of asthma, but they do not fully reflect the type and extent of pathophysiological abnormalities of the disease and are relatively insensitive to early asthma symptoms and subtle symptom changes. Therefore, identifying, treating, and managing bronchi asthma still faces many challenges, such as under- and over-diagnosis, unclear pathogenesis, lack of uniform phenotypic classification criteria, high mortality risk, and high costs associated with exacerbations.4,5 High-resolution CT scans can be used to observe the fine structures of the lungs, thereby understanding different degrees of emphysema, bronchial wall thickening, lung deformation and changes in surrounding blood vessels, etc., which can better evaluate the condition of asthma patients and help clinicians provide precise treatment to patients.6 Studies have shown that quantitative imaging plays an important role in describing asthma phenotypes and predicting future asthma incidence.7,8 This study explores the value of CT radiomics models in predicting the clinical stage of bronchial asthma, and constructs and evaluates prediction models.
Materials and Methods
Research Purpose
The study was performed at our hospital. The investigation conformed with the principles outlined in the Declaration of Helsinki and our study was approved by the Medical Ethics Committee of the First Affiliated Hospital of Guangdong Medical University (YJ2021-053-01). Retrospective review of medical records and waiver of informed consent were granted by the Committee of Clinical Investigation at our hospital.
Data of patients with BA from January 1, 2018 to October 30, 2021 were retrospectively collected, and all patients underwent chest CT examination in the radiology department of our hospital. The inclusion criteria and exclusion criteria are as follow:
Inclusion criteria: ① Age, gender and race: There is no restriction on race or ethnicity; ② Diagnosis by a clinician and in compliance with the “Guidelines for the Prevention and Treatment of Bronchial Asthma” (2016 Edition) and Staging criteria; ③ Patients did not receive systemic treatment before CT examination.
Exclusion criteria: ① Incomplete required data, such as lack of CT examination; ② Poor imaging data, such as artifacts; ③ Patients combined with other respiratory diseases other than bronchial asthma, such as COPD, interstitial pneumonia, Active tuberculosis, community-acquired pneumonia, lung cancer, pulmonary heart disease, pulmonary embolism, etc.
Finally, a total of 112 patients with bronchial asthma were included in this study, of which 80 were in the acute attack stage (male of 33; age range: 2 to 86 years old) and 32 were non-acute patients (male of 18; age range: 4 to 79 years old). (see Table 1)
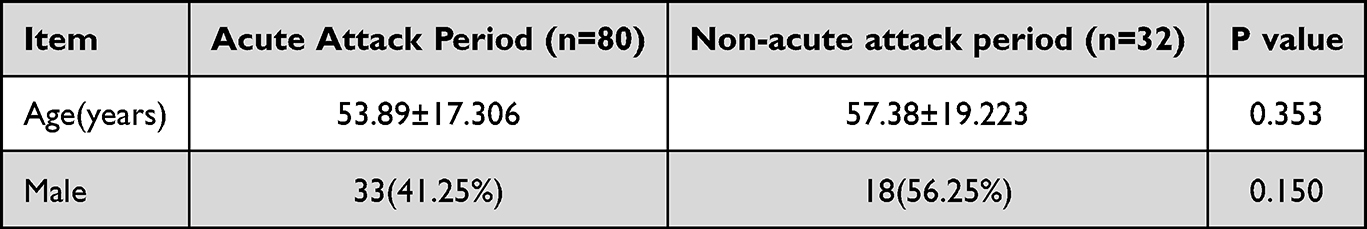 |
Table 1 Basic Clinical Data of Bronchial Asthma in Acute Attack and Non-Acute Stages [x±s, Cases (%)] |
Scanning Instruments and Radiomics Analysis Software
Scanning equipment: SOMATOM Sensation 64-slice spiral CT machine, Toshiba Aquilion ONE 320-slice dynamic volume CT, Optima CT680 Expert. LK (Lung Kit, Version 2.2.0, GE Healthcare) software was used for image preprocessing and split. AK (Artificial Intelligence Kit, Version3.3.0, GE Healthcare) software was used to extract radiomics feature selection. R language (The R Programming Language, Version 3.6.0) is used for dimensionality reduction, model construction and evaluation of feature data.
Patient Preparation, Scanning Position and Range
Before the examination, the patient’s disease history needs to be inquired, and the patient’s contraindications for CT examination (such as whether she is pregnant) need to be ruled out. Metal objects (metal buttons, necklaces, etc.) were removed from the body before the examination. Patients were asked not to move the body during the examination, and cooperate with the inhalation and breath-holding operations. Patients were placed in a supine position with both upper arms extended above the head, and a whole lung scan was completed from the lung apex to the lung base while holding the breath at the end of maximum inspiration.
Chest CT Scanning Method and Parameter Settings
SOMATOM Sensation 64-slice spiral CT machine, Toshiba Aquilion ONE 320 row dynamic volumetric CT, and Optima CT680 Expert were used for scanning. The scanning parameters are as follows: tube voltage 120kv, tube current using automatic tube current adjustment technology, window width 1500HU, window level −500HU, matrix 512 ×512, the scanning layer thickness is 1.0mm.
Image Preprocessing and Segmentation
Image preprocessing and segmentation are implemented based on LK software. We collected the patient’s imaging data in the PACS system of the radiology department of our hospital, exported it in dicom format, and then imported the patient’s chest CT images into the LK software.
In order to reduce the image differences introduced by different machines and equipment, we have preprocessed the imported images through standardization, resampling, and noise reduction. First, we standardized the chest CT images through z-score to obtain the standard normal distribution of image intensity; then resampled the images and unified the voxel size to 1.0mm × 1.0mm × 1.0mm; finally, Gaussian filtering kernel was used for noise reduction.
Automatically segment the whole lung tissue of the preprocessed CT image. The selected areas include the trachea, bronchi at all levels of both lungs and the whole lung parenchyma. After the segmentation is completed, the integrity of the automatically segmented area of interest is checked. Incomplete and over-segmented parts are inspected with manual modification, this process is completed through consultation between two professional medical imaging diagnosticians with 5 years of diagnostic experience. When the modification difference is greater than 20% of the overall image, it will be decided by another professional medical imaging diagnostician with 10 years of diagnostic experience.
The processed images and segmented lung regions were exported and saved in nii.gz format. The ROI extraction of the LK software image is shown in Figure 1.
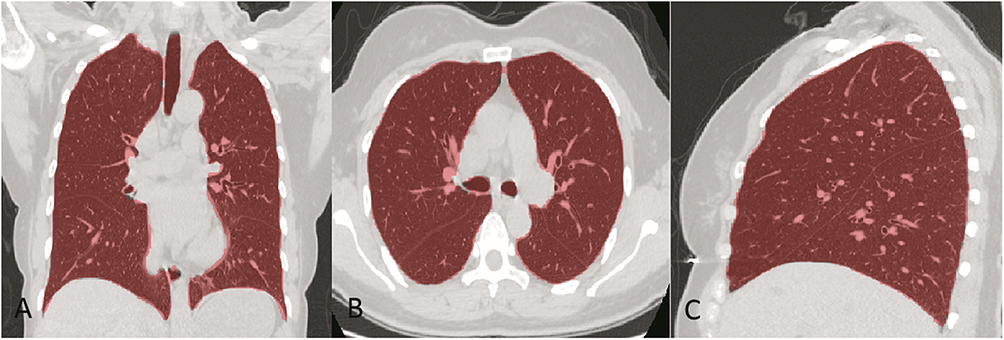 |
Figure 1 ROI delineation with the LK software. (A–C) shows the LK software’s ROI delineation in the coronal, transverse, and sagittal views of the patient’s CT image respectively. |
Extraction of Radiomics Features
The AK software was used to extract radiomics feature selection, and the preprocessed images and files about the region of interest of lungs were imported into the software separately. A total of 1316 radiomics features were extracted from the region of interest of each patient’s lung CT image, mainly including three categories: ① First-order statistics, which can be analyzed through histograms, through common and basic metrics, such as energy, entropy, average and median to calculate; ② Texture features, including gray level co-occurrence matrix (GLCM), gray level size zone matrix (GLSZM), gray level correlation matrix (GLDM) and gray level run length matrix (GLRLM)); ③ High-order filtering transformation features, including intensity and texture features obtained by filtering transformation and wavelet transformation of the original image, are processed using filters, such as logarithms, square roots and exponentials.
Selection and Model Construction of Radiomics Features
Using the R language data analysis platform, the data set was randomly divided into a training group and a test group at a ratio of 7:3. All cases from the training cohort were used to train the predictive model, while cases from the testing cohort were used to independently evaluate the performance of the model. Missing values and outliers in the feature data set were replaced using the median and blocking methods respectively, and finally the data were standardized using Z-score.
Too many radiomics features may lead to problems such as model overfitting. In this study, there are three methods to gradually select the optimal radiomics features: first, use the variance selection method to remove feature values with a variance threshold less than 0; then use the Max-Relevance Min-Redundancy (mRMR) method to select the top 30 most relevant radiomics features; finally, use the least absolute shrinkage and selection operator (LASSO) method to reduce the feature size and effectively identify the most important features.
A multi-factor logistic regression model was used to model the ultimately retained radiomics features with predictive value. The logistic regression model is a generalized linear regression analysis model. The probability of the predicted result of this algorithm is between 0 and 1. It is suitable for continuous and categorical independent variables and is easy to use and interpret.
Evaluation of Radiomics Models
The ten-fold crossover method was used for model training, and the receiver operating characteristic (ROC) curve was used to analyze the radiomics diagnostic performance and calculate the accuracy, sensitivity, specificity and area under the curve (AUC). Draw the model calibration curve to evaluate the consistency between the prediction probability of the radiomics model and the clinical staging results, and conduct a Hosmer-Lemeshow test (P value >0.05 means there is no difference between the predicted and actual curves). Decision curve analysis was used to evaluate the clinical utility of the radiomics model (by estimating the net benefits of the constructed model within different threshold probability ranges). The flow chart of radiomics is shown in Figure 2.
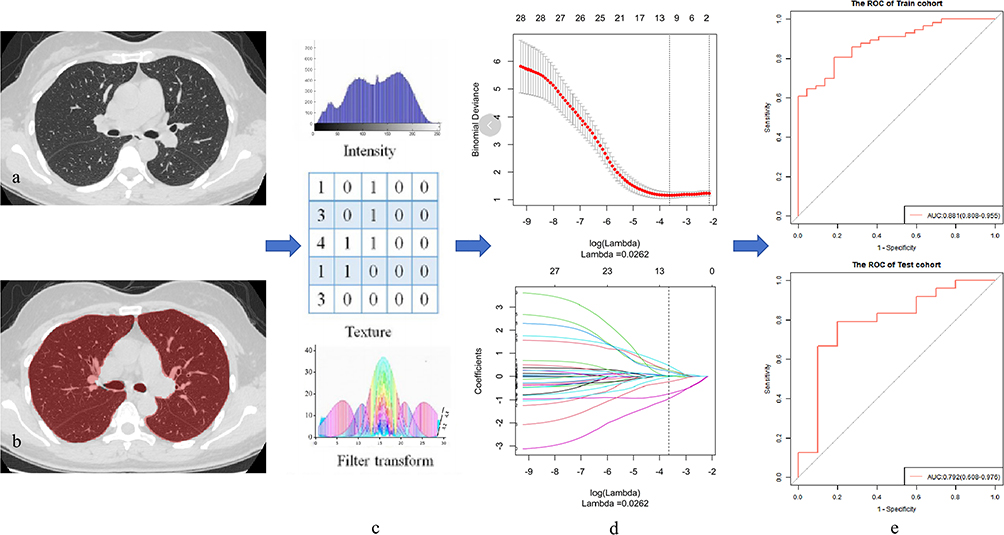 |
Figure 2 Adiomics flow chart. It includes 5 steps: (a) Acquisition of CT images. (b) Delineation of image ROI. (c) Extraction of omics features. (d) Selection of omics features. (e) Evaluation of models. |
Statistical Methods
The SPSS Statistics 26.0 statistical analysis software was used to perform statistical analysis on the demographic data of the acute and non-acute phases of bronchial asthma. Measurement data were expressed in the form of mean ± standard deviation (x ± s), and t-test was used for comparison between groups. Qualitative data were expressed as rates (%), and the gender composition ratio between the two groups was analyzed using the chi-square test. P<0.05 (two-sided) indicates that the difference is statistically significant.
Results
Demographic Data of Acute and Non-Acute Phases of Bronchial Asthma
A total of 112 patients with bronchial asthma were included in this study, of which 80 with acute attacks (male of 33; age range: 2 to 86 years old; average age of 53.89±17.306 years) and 32 with non-acute patients (male of 18; age range: 4 to 79 years old; average age of 57.38±19.223 years). Statistical analysis of the age and gender composition ratios between the two groups showed that the P values were 0.353 and 0.150 respectively, and the P values were all greater than 0.05, indicating that there was no statistical difference in the age and gender composition ratios between the two groups (see Table 1).
Radiomic Characteristics of Diagnostic Models
After feature selection and dimensionality reduction using the variance method, mRMR method and LASSO method (see Figure 3), it was found that the binomial deviation was the smallest when the optimal tuning parameter logλ=0.0262, and a total of 10 optimal imaging omics features were selected accordingly (see Figure 4). These 10 radiomic features were used to construct a multifactor logistic regression discriminant model. The features included in the multi-factor logistic regression model and the corresponding coefficients are shown in Table 2. A radiomics nomogram was compiled based on selected radiomics features, as shown in Figure 5.
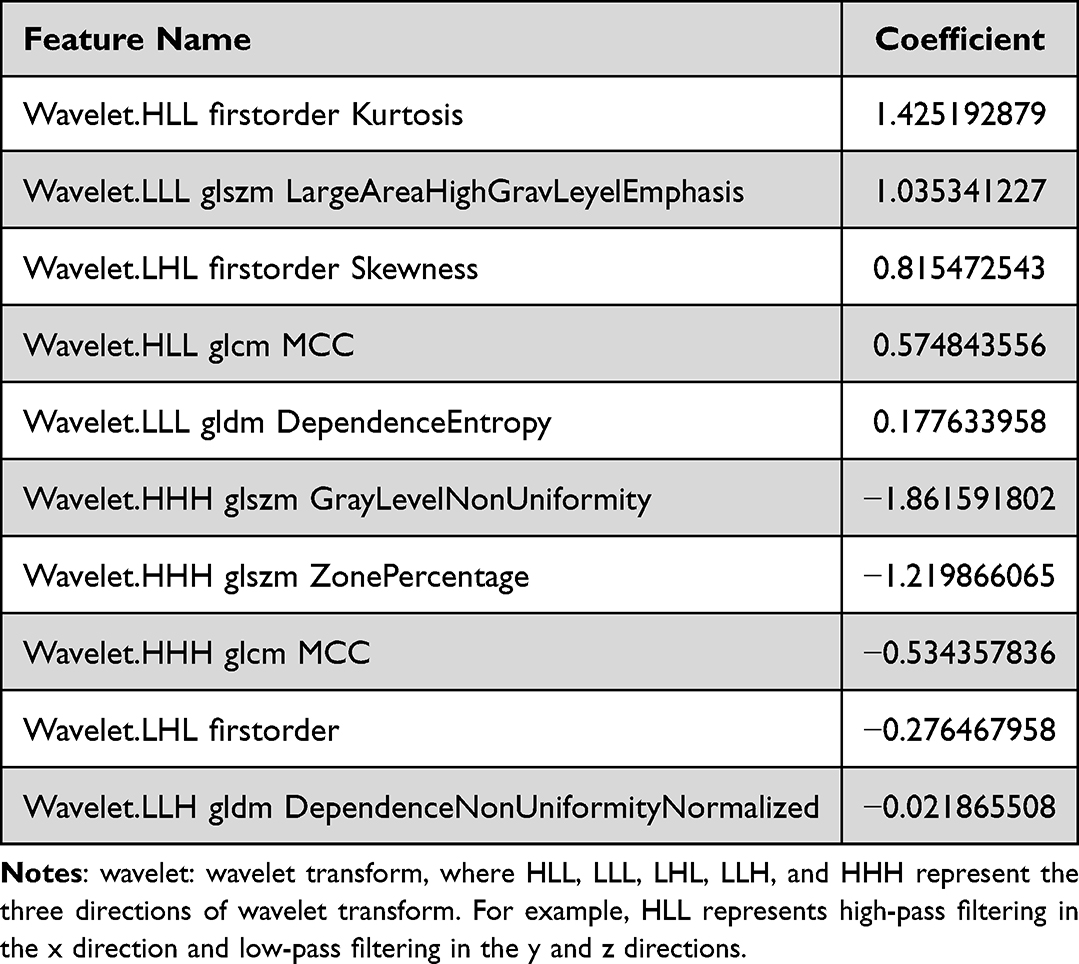 |
Table 2 Features Included in the Multi-Factor Logistic Regression Model and Corresponding Coefficients |
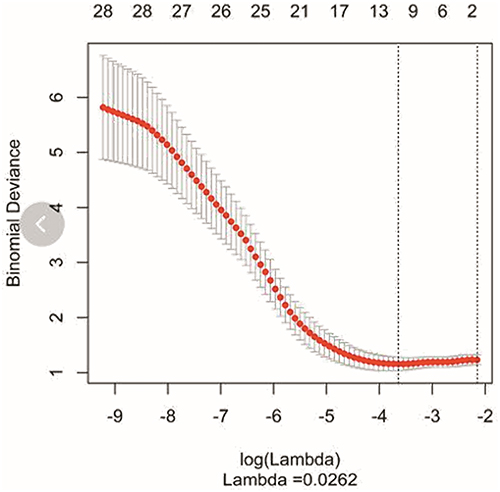 |
Figure 3 Feature selection of LASSO regression. It was done by adjusting different hyperparameters (λ) to minimize the binomial deviation of the model, thereby achieving the purpose of screening optimal features. For each λ value, we can get a confidence interval of the target parameter around the mean value of the target parameter shown in the red dot. The two vertical dotted lines on the right indicate two special λ values: the minimum λ and the λ within one standard error. In this study, we use the minimum λ to find the factor, and the λ value is 0.0262; top of the picture is the number of included features. |
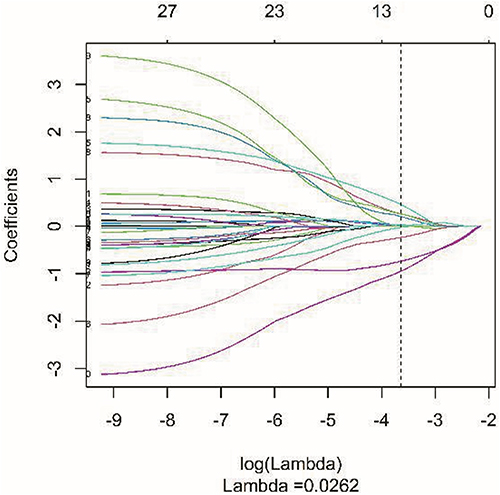 |
Figure 4 Selection of optimal imaging omics features. Each curve in the figure represents the change trajectory of each independent variable coefficient. The ordinate is the value of the coefficient, the lower abscissa is log (λ), and the upper abscissa is the number of non-zero coefficients in the model at this time. |
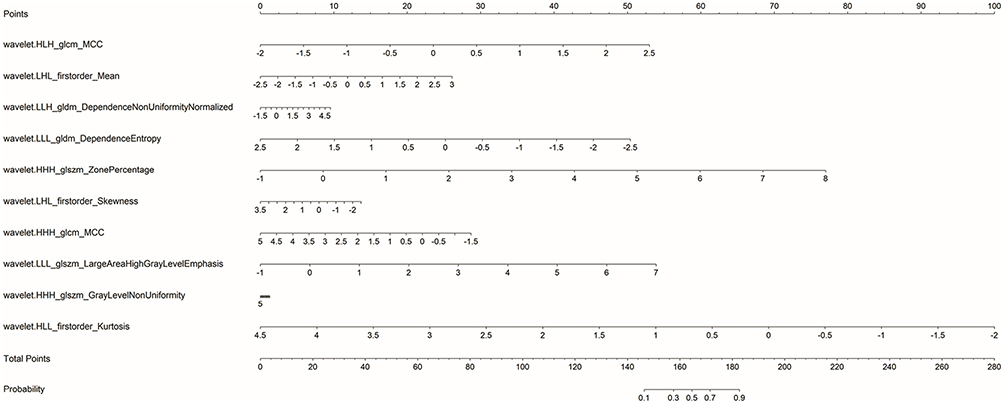 |
Figure 5 Radiomics nomogram. A radiomics nomogram was compiled based on selected radiomics features. |
Diagnostic Performance of Machine Learning Model
A total of 112 cases were included in this study and divided into a training group and a testing group in a ratio of 7:3. In the end, the training group and the test group were 78 cases and 34 cases respectively. The data of the training group and the test group were analyzed, and logistic regression modeling was performed based on the selected features. In the training group, the AUC, sensitivity and specificity based on the logistic regression model were 0.881 (95% CI: 0.808–0.955), 0.804, 0.818 respectively. In the test group, the AUC, sensitivity and specificity based on the logistic regression model were 0.792 (95% CI: 0.608–0.976), 0.792, and 0.80 respectively (see Table 3). Figure 6A is the ROC curve of the training group; Figure 6B is the ROC curve of the test group; Figure 7 is the diagnosis situation diagram of the test group.
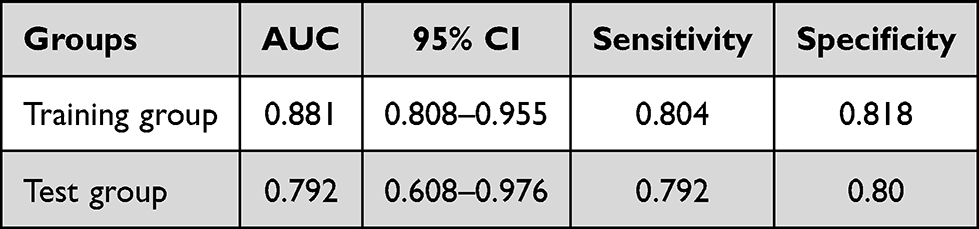 |
Table 3 Results of the Logistic Regression Model for Predicting Bronchial Asthma Stage |
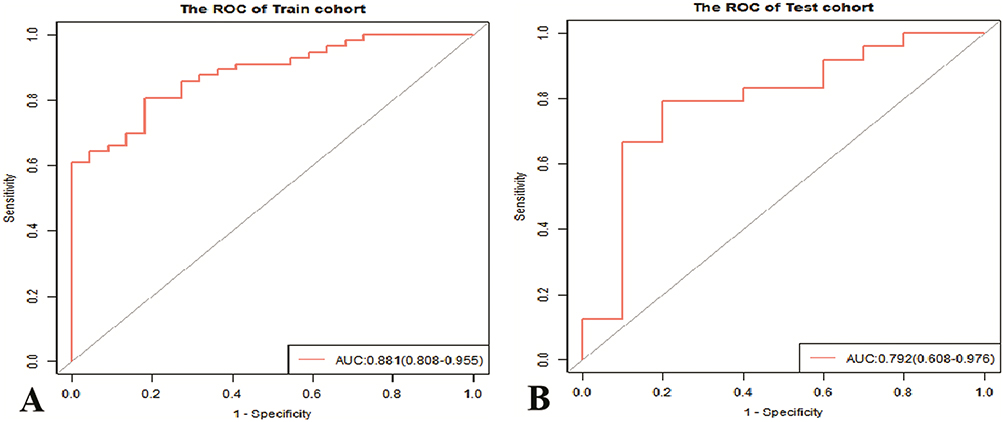 |
Figure 6 ROC curves of the radiomics model. (A). ROC curve of the radiomics model of the training group: AUC value is 0.881. (B). ROC curve of the radiomics model of the test group: AUC value is 0.792. |
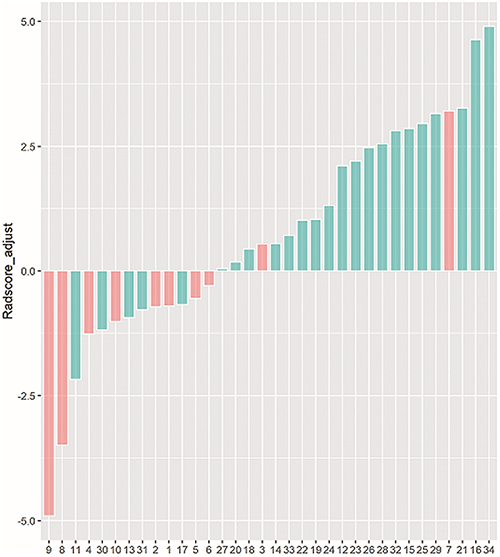 |
Figure 7 Diagnostic situation diagram. Diagnostic situation diagram of the test group (34 cases): the results of the diagnostic model depend on the data of the test group. |
The calibration curve of the radiomics model based on CT plain scan is shown in Figure 8. Calibration curve Hosmer-Lemeshow (P value >0.05 indicates no difference between the predicted curve and the actual curve) test results show that there is good consistency between the radiomics model prediction of bronchial asthma stage and clinical results in both the training group and the test group. The P values of the training group and test group were 0.952; 0.997 respectively.
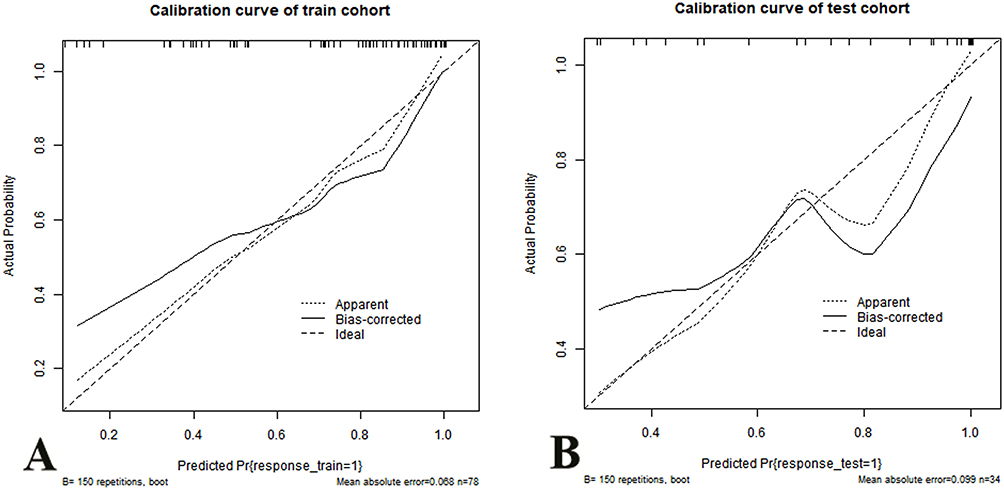 |
Figure 8 Calibration curves of the radiomics model. (A) and (B) are the calibration curves of the training group and the test group in the radiomics model respectively. (the x-axis represents the prediction of the nomogram, the y-axis represents the actual situation of bronchial asthma staging, the dotted line shows the ideal nomogram, and the solid line represents the performance of nomograms for the test group.). |
The decision curve of the CT-based radiomics model is shown in Figure 9. The decision curve analysis results show that both in the training group and the test group the radiomics models achieved good net benefits in identifying the clinical stages of bronchial asthma.
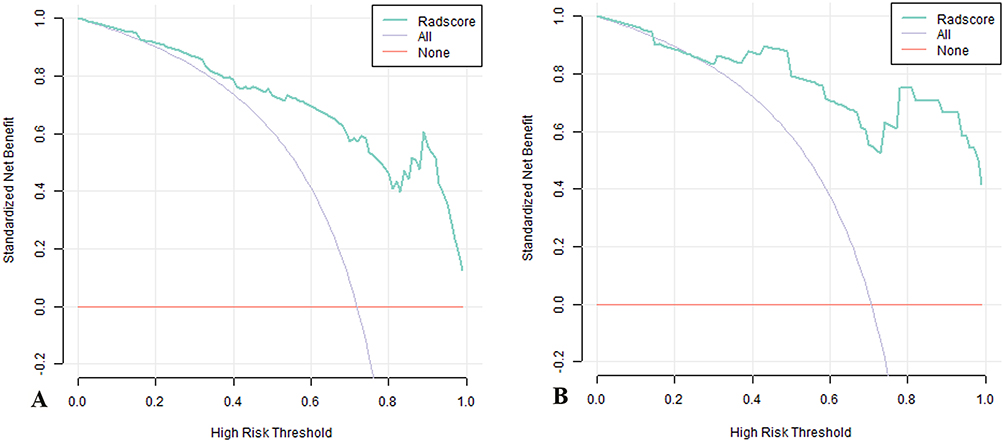 |
Figure 9 Decision curves of the radiomics model. (A) and (B) are the decision curves of the radiomics model of the training group and the test group respectively. (the light solid line in the above figure represents that all patients can benefit from the model, the solid horizontal line represents that all patients cannot benefit, and the discontinuous curve above the two curves represents the decision curve of the model we constructed. The interval between this curve and the light solid line and the horizontal solid line is called the net benefit area.). |
Discussion
Structural and Functional Changes Based on Quantitative CT Images During Acute Asthma Attacks
Asthma is considered an inflammatory condition in which chronic inflammation leads to airway remodeling and intermittent airway narrowing due to the release of bronchoconstrictor chemicals. The mechanisms underlying asthmatic airway hyperresponsiveness may be complex interactions between factors driving remodeling and inflammation.9 Acute exacerbations of asthma are often triggered by a variety of factors and an acute asthma attack is a medical emergency that must be promptly diagnosed and treated. The diagnosis of asthma relies primarily on worsening of symptoms and signs, combined with measurements of pulse oximetry and lung function.
CT is an ideal noninvasive examination method for assessing the distribution, extent, and severity of morphological changes in the airways and lung parenchyma.10 Yoshida et al reported that airway obstruction measured as lumen diameter was significantly greater in the distal segment of the airway during an asthma attack.11 Elliot found that airway wall thickening was related to inflammatory infiltration.12 Li et al compared the acute attack period of asthma with the recovery period, and found that the percentage of airway wall area was significantly thickened.13 There are many existing studies demonstrating changes in parenchymal airway lung function as a result of asthma exacerbation. Winkler et al demonstrated that airway obstruction causes ventilation to be redistributed to other airways, thereby increasing ventilation heterogeneity.14 Additionally, Kim et al reported that asthmatic patients had more ventilatory defects than healthy subjects based on gas capture scores.15 A recent study showed that the correlation between acute exacerbation of asthma and small airways is greater than that of large airways, especially in the lower lobes.16 Bronchial asthma in CT applications have progressed over the past dozen years, but it is difficult to assess the full utility of quantitative imaging and understand its considerable work remains on its potential role in asthma clinical care.
The Application of Radiomics Models in Asthma Has High Potential
Through radiomics methods, we can not only quantify the images of asthma patients, but also perform finer and more powerful phenotypic classification to reveal the hidden mechanisms of the disease and its connection with asthma, and it takes less time, comparing the traditional methods such as manually observing CT images and simple measurements by experienced experts.17 We can extract quantitative feature information that is difficult to see or quantify with the naked eye from standard medical images, and then establish a quantifiable and repeatable model for evaluating clinical outcomes, including diagnostic, prognostic, or predictive perspectives, to accurately identify and describe pathological entities.17
In the past, some scholars used language processing algorithms and machine learning algorithms to conduct research related to asthma. In a retrospective birth cohort study of Wi et al, a natural language processing algorithm for diagnosing childhood asthma was developed for the first time using EHR (electronic health records) and predetermined asthma standards.18,19 The algorithm has high effectiveness in diagnosing childhood asthma in external EHR systems, but further validation is needed in adult cohorts.18,19 Mäkikyrö et al used machine learning algorithms to classify asthma phenotypes based on the severity of the disease and achieved some results.20 However, the application of CT based imaging omics in bronchial asthma is currently limited. Zhang et al found that deep learning CT features based evaluation of small airway obstruction in children with asthma has good feasibility for glucocorticoid treatment (accuracy of 81%). However, further validation is needed in the adult cohort.21 In this study, we established and evaluated a multivariate logistic regression model based on the imaging omics method of chest CT to predict the staging of asthma, and achieved good results, indicating that the use of imaging omics methods can be used in clinical research related to asthma.
In addition, studies have shown that imaging omics methods for predicting survival and risk stratification in patients with COPD are feasible.22 The constructed radiomics model exhibits acceptable performance and has been confirmed by consistent results from external validation groups.22 Li et al constructed a highly effective COPD diagnostic model based on CT imaging omics;23 Lafata et al constructed a predictive model based on CT imaging omics to quantify changes in lung function and accurately diagnose the severity of COPD related to spirometry testing.24 From this, it can be seen that in the future, imaging omics may also have significant application value in the diagnosis, staging, prognosis, and monitoring of treatment response of bronchial asthma.
The Radiomics Model Based on Chest CT Scans Can Effectively Predict the Clinical Stage of Bronchial Asthma
In this study, we evaluated the predictive performance of multivariate logistic regression models for asthma staging based on the imaging omics method, and found that they performed well in both the training and testing groups (with the AUC, sensitivity, and specificity of 88.1%, 80.4%, 81.8% and 79.2%, 79.2%, 80.0%, respectively). According to the information consulted by the author, there are currently no literature reports on predicting the clinical staging of bronchial asthma based on CT imaging omics. A previous study showed that the logical analysis model achieved a high accuracy of 72.6% in diagnosing adult asthma based on symptoms and signs, biochemical results, lung function tests, and bronchial provocation tests.25 And in this study, we achieved good results in staging asthma, which demonstrated that the model constructed based on imaging omics has great application value and prospects in predicting the staging of bronchial asthma patients.
In this study, we conducted feature selection using the variance method, mRMR method, and lasso method in sequence. We ultimately selected 10 optimal features, all of which are wavelet transform features of higher-order statistical features. This is similar to a study on the evaluation value of imaging omics features in COPD.26 It may be due to the fact that higher-order statistical features can more clearly display subtle changes in tissue morphology, which are indicators of texture and heterogeneity and are almost impossible to recognize with the naked eye. Moreover, wavelet transform can eliminate noise or sharpen the image, and this process does not alter its radiological features.27 Therefore, compared to the non acute stage of asthma, the increase in these characteristic values in the acute stage group indicates a rougher texture and increased heterogeneity.
The selected features in this study do not include first-order features and texture features based on shape and size, which are inconsistent with the situation where acute asthma attacks can lead to structural and functional changes such as tracheal wall thickening and lumen narrowing (“mosaic sign”). This may be due to the use of the trachea, lungs, bronchi, and whole lung parenchyma as the ROI for imaging omics feature extraction in this study, while the destruction of asthma may only occur locally in the lung lobes, which may lead to inaccurate estimation of imaging features.27
In recent years, some deep learning models trained from chest CT images have been used for COPD classification, especially convolutional neural networks (CNN). For example, González et al trained a CNN model to detect COPD (n=1000) in a COPD gene detection queue, with an accuracy of 0.773.28 However, training a deep CNN from scratch is difficult because it requires a large amount of label training data and professional knowledge. Compared with traditional machine learning methods and modern deep learning methods that require a large amount of data, our model can achieve good AUC and accuracy with only a small amount of data, and the results are explanatory. This may be because the logical analysis model we used is a simple neural network, without hidden layers, and has supervised machine learning methods.28
In this study, the delineation of ROI was performed using LK software, which can automatically identify the patient’s trachea, lungs, bronchi, and whole lung parenchyma as areas of interest. While in previous studies, the selection of imaging omics ROI for some obstructive diseases was generally based on selecting several cross-sectional sections of the lungs.17,23 As we all know, asthma is a complex and highly heterogeneous clinical entity characterized by various pathological and physiological processes, and disease heterogeneity is also manifested in abnormal spatial distribution. For example, previous literature has reported that acute attacks of bronchial asthma can lead to structural changes in the small airways, especially in the lower lobe.16 Therefore, selecting only a few layers may not fully and accurately reflect the pathological and physiological changes of bronchial asthma, and the ROI selection method in this study can encompass all the aforementioned pathological changes.
In addition, in this study, there was no statistically significant difference in the staging of bronchial asthma compared to the patient’s age and gender. This may be due to the fact that acute exacerbation of asthma is usually caused by various factors, such as viral respiratory infections, exposure to allergens, air pollution, seasonal changes, or poor asthma drug compliance.29 There are literature reports that fluctuations in sex hormone levels during puberty, menstrual cycle, and pregnancy are associated with the pathogenesis of asthma in women.30 This is not reflected in this article, which may be due to the fact that the majority of patients in this study are middle-aged and elderly, with a large age range.
Shortcomings and Prospects of This Study
This study has some limitations that need to be explained. First, The number of cases included in this analysis is relatively small, especially for patients in non acute exacerbation stage, which will inevitably lead to selection bias. In future research, the sample size should be increased to reduce sampling errors, and the prediction model should be improved and validated through a larger data size. Second, it only included one single center data and did not include geographical factors affecting disease distribution. Future work will strive to provide homogeneous imaging data from multiple centers in multiple regions, which may conducive to the adjustment and promotion of optimization models. Third, the age span of this study is relatively large, with mostly middle-aged and elderly people, and the predictive efficacy of bronchial asthma staging in different age groups was not compared.
Summary
In this study, we constructed and evaluated the predictive performance of a multifactor logistic regression model for asthma staging based on CT radiomics, indicating that radiomics has great value and potential in predicting the staging of bronchial asthma patients. It provides an effective quantitative analysis method for predicting the differentiation of clinical staging of bronchial asthma.
Ethical Approval
The study was performed at the Affiliated Hospital of Guangdong Medical University (Zhan Jiang, China). The investigation conformed with the principles outlined in the Declaration of Helsinki and our study was approved by the Medical Ethics Committee of the First Affiliated Hospital of Guangdong Medical University (YJ2021-053-01). Retrospective review of medical records and waiver of informed consent were granted by the Committee of Clinical Investigation at our hospital.
Statement of Informed Consent
Patient consent to review their medical records was not required by the Committee of Clinical Investigation of the First Affiliated Hospital of Guangdong Medical University. The reasons for the waiver are as follow: (a) There is no any risk to the subjects in the study; (b) Exemption from informed consent will not have adverse effects on the health and rights of the subjects; (c) The privacy and personal identity information of the subjects are protected. All patient data in this study are anonymized and maintained with confidentiality.
Acknowledgments
We thank Dr. Yuting Liao at Philips Healthcare, GuangZhou, China for her insightful suggestions and technical support.
Funding
The work was supported by the Clinical Research Project of the Affiliated Hospital of Guangdong Medical University (LCYJ2020B010); Zhanjiang Science and Technology Development Special Fund Competitive Allocation Project (2019A01026; 2020A01024); Guangdong Medical University Doctoral Fund of the University Affiliated Hospital (BJ201521).
Disclosure
No potential conflict of interest was reported by the authors.
References
1. Reddel Helen K, Bacharier Leonard B, Bateman Eric D, et al. Global initiative for asthma strategy 2021. executive summary and rationale for key changes. Arch Bronconeumol. 2022;58(1):35–51. doi:10.1016/j.arbres.2021.10.003
2. Thomas R, Spagnolo P, Pierre-Olivier B, et al. Diagnosis and management of asthma -the Swiss guidelines. Respiration. 2018;95(5):364–380. doi:10.1159/000486797
3. Aaron Shawn D, Vandemheen Katherine L, FitzGerald JM. Reevaluation of diagnosis in adults with physician-diagnosed asthma. JAMA. 2017;317(3):269–279. doi:10.1001/jama.2016.19627
4. King-Biggs MB. Asthma. Ann Intern Med. 2019;171(7):ITC49–ITC64. doi:10.7326/AITC201910010
5. Ravdeep K, Chupp G. Phenotypes and endotypes of adult asthma: moving toward precision medicine. J Allergy Clin Immunol. 2019;144(1):1–12. doi:10.1016/j.jaci.2019.05.031
6. Nam BD, Ko S, Hwang JH. Quantitative evaluation of computed tomography findings in patients with bronchial asthma: prediction of therapeutic response. J Med Imaging Radiat Oncol. 2021;65(6):663–671. doi:10.1111/1754-9485.13169
7. Qin Y, Jing W, Yanjun H, et al. Deep learning algorithms-based CT images in glucocorticoid therapy in asthma children with small airway obstruction. J Healthc Eng. 2021;2021:5317403. doi:10.1155/2021/5317403
8. Young Hoon C, Joon Beom S, Sang Min L, et al. Radiomics approach for survival prediction in chronic obstructive pulmonary disease. Eur Radiol. 2021;31(10):7316–7324. doi:10.1007/s00330-021-07747-7
9. King G, Noble PB. Airway remodelling in asthma: it’s not going away. Respirology. 2016;21(2):203–204. doi:10.1111/resp.12727
10. Kim S, Lee CH, Jin KN, et al. Severe asthma phenotypes classified by site of airway involvement and remodeling via chest CT scan. J Investig Allergol Clin Immunol. 2018;28(5):312–320. doi:10.18176/jiaci.0265
11. Yoshida Y, Takaku Y, Nakamoto Y, et al. Changes in airway diameter and mucus plugs in patients with asthma exacerbation. PLoS One. 2020;15(2):e0229238. doi:10.1371/journal.pone.0229238
12. Elliot John G, Noble Peter B, Mauad T, et al. Inflammation-dependent and independent airway remodelling in asthma. Respirology. 2018;23(12):1138–1145. doi:10.1111/resp.13360
13. Xun L, Naidoo P, Paul G, et al. Lung-volume controlled computerised tomography in real-life acute severe asthma. J Asthma. 2014;51(3):282–287. doi:10.3109/02770903.2013.860165
14. Winkler T, Venegas Jose G. Complex airway behavior and paradoxical responses to bronchoprovocation. J Appl Physiol. 2007;103(2):655–663. doi:10.1152/japplphysiol.00041.2007
15. Won Wha K, Chang Hyun L, Goo Jin M, et al. Xenon-enhanced dual-energy CT of patients with asthma: dynamic ventilation changes after methacholine and salbutamol inhalation. AJR Am J Roentgenol. 2012;199(5):975–981. doi:10.2214/AJR.11.7624
16. Joonwoo P, Sujeong K, Jae-Kwang L, et al. Quantitative CT image-based structural and functional changes during asthma acute exacerbations. J Appl Physiol. 2021;131(3):1056–1066. doi:10.1152/japplphysiol.00743.2020
17. Yingli S, Cheng L, Liang J, et al. Radiomics for lung adenocarcinoma manifesting as pure ground-glass nodules: invasive prediction. Eur Radiol. 2020;30(7):3650–3659. doi:10.1007/s00330-020-06776-y
18. Chung-Il W, Sunghwan S, Rolfes Mary C, et al. Application of a natural language processing algorithm to asthma ascertainment an automated chart review. Am J Respir Crit Care Med. 2017;196(4):430–437. doi:10.1164/rccm.201610-2006OC
19. Chung-Il W, Sunghwan S, Mir A, et al. Natural language processing for asthma ascertainment in different practice settings. J Allergy Clin Immunol Pract. 2018;6(1):126–131. doi:10.1016/j.jaip.2017.04.041
20. Mäkikyrö Elina MS, Jaakkola Maritta S, Jaakkola Jouni JK. Subtypes of asthma based on asthma control and severity: a latent class analysis. Respir Res. 2017;18(1):24. doi:10.1186/s12931-017-0508-y
21. Zhang W, Wang Y. Evaluation of glucocorticoid therapy in asthma children with small airway obstruction based on CT features of deep learning. Comput Math Methods Med. 2021;2021:7936548. doi:10.1155/2021/7936548
22. Cho YH, Seo JB, Lee SM, et al. Radiomics approach for survival prediction in chronic obstructive pulmonary disease. Eur Radiol. 2021;31(10):7316–7324.
23. Zongli L, Ligong L, Zuoqing Z, et al. A novel CT-based radiomics features analysis for identification and severity staging of COPD. Acad Radiol. 2022;29(22):663–673.
24. Lafata Kyle J, Zhennan Z, Jian-Guo L, et al. An exploratory radiomics approach to quantifying pulmonary function in CT images. Sci Rep. 2019;9:11509. doi:10.1038/s41598-019-48023-5
25. Tomita K, Nagao R, Touge H, et al. Deep learning facilitates the diagnosis of adult asthma. Allergol Int. 2019;68(4):456–461. doi:10.1016/j.alit.2019.04.010
26. Litvin AA, Burkin DA, Kropinov AA, et al. Radiomics and digital image texture analysis in oncology (Review). Sovrem Tekhnologii Med. 2021;13(2):97–104. doi:10.17691/stm2021.13.2.11
27. Yang K, Yang Y, Kang Y, et al. The value of radiomic features in chronic obstructive pulmonary disease assessment: a prospective study. Clin Radiol. 2022;77(22):e466–e472.
28. González G, Ash SY, Vegas-Sánchez-Ferrero G, et al. Disease staging and prognosis in smokers using deep learning in chest computed tomography. Am J Respir Crit Care Med. 2018;197(2):193–203. doi:10.1164/rccm.201705-0860OC
29. Manti S, Licari A, Salvatore L, et al. Management of asthma exacerbations in the paediatric population: a systematic review. Eur Respir Rev. 2021;30(161):200367. doi:10.1183/16000617.0367-2020
30. Guo-Qiang Z, Ermis Saliha Selin Ö, Madeleine R, et al. Sex disparities in asthma development and clinical outcomes: implications for treatment strategies. J Asthma Allergy. 2022;15:231–247. doi:10.2147/JAA.S282667
 © 2024 The Author(s). This work is published and licensed by Dove Medical Press Limited. The full terms of this license are available at https://www.dovepress.com/terms.php and incorporate the Creative Commons Attribution - Non Commercial (unported, v3.0) License.
By accessing the work you hereby accept the Terms. Non-commercial uses of the work are permitted without any further permission from Dove Medical Press Limited, provided the work is properly attributed. For permission for commercial use of this work, please see paragraphs 4.2 and 5 of our Terms.
© 2024 The Author(s). This work is published and licensed by Dove Medical Press Limited. The full terms of this license are available at https://www.dovepress.com/terms.php and incorporate the Creative Commons Attribution - Non Commercial (unported, v3.0) License.
By accessing the work you hereby accept the Terms. Non-commercial uses of the work are permitted without any further permission from Dove Medical Press Limited, provided the work is properly attributed. For permission for commercial use of this work, please see paragraphs 4.2 and 5 of our Terms.