")
Back to Journals » Journal of Multidisciplinary Healthcare » Volume 17
The Association Between Obesity Measures and Metabolic Syndrome Risk in Korean Adolescents Aged 10–18 Years
Authors Song M, Kang S, Kang H
Received 25 January 2024
Accepted for publication 16 April 2024
Published 22 April 2024 Volume 2024:17 Pages 1769—1776
DOI https://doi.org/10.2147/JMDH.S461406
Checked for plagiarism Yes
Review by Single anonymous peer review
Peer reviewer comments 2
Editor who approved publication: Dr Scott Fraser
Munku Song, Seamon Kang, Hyunsik Kang
College of Sport Science, Sungkyunkwan University, Suwon, South Korea
Correspondence: Hyunsik Kang, College of Sport Science, Sungkyunkwan University, Suwon, 16419, South Korea, Tel +82-31-299-6923, Fax +82-31-299-6929, Email [email protected]
Introduction: Childhood obesity is strongly linked to an increased risk of metabolic syndrome (MetS), type 2 diabetes, and cardiovascular disease in adulthood, endangering the global healthcare system. No single tool for detecting MetS is suitable for all pediatric populations. This study aimed to investigate the association between obesity measures and MetS in Korean children and adolescents.
Method and Materials: The data were obtained from 1663 children and adolescents aged 10– 19 years (771 girls) who participated in the Fourth and Fifth Korea National Health and Nutrition Examination Surveys. Body mass index (BMI), waist circumference (WC), and waist-to-hip ratio (WHtR) were included as obesity measures. Fasting blood glucose, triglycerides, high-density lipoprotein cholesterol, and resting blood pressure were included as metabolic risk factors. MetS was defined as the clustering of metabolic risk factors such as elevated fasting blood glucose, elevated mean arterial pressure, elevated triglycerides, and low high-density lipoprotein cholesterol.
Results: Regardless of the obesity measures used, obese children and adolescents were more likely to have a clustering of metabolic risk factors compared to their non-obese counterparts: BMI-based obesity (odds ratio, OR=4.151, 95% confidence interval, CI=2.763~6.238, p< 0.001), WC-based obesity (OR=1.917, 95% CI=1.066~3.446, p=0.010), and WHtR-based obesity (OR=2.160 and 95% CI=1.203~3.878, p=0.003). A receiver operating curve analysis showed that BMI (area under the curve, AUC=0.849, 95% CI=0.8270.871) outperformed WC (AUC=0.833, 95% CI=0.8090.856) and WHtR (AUC=0.794, 95% CI=0.7670.821) in detecting the presence of MetS.
Conclusion and Recommendation: Study findings suggest that obese teenagers are more likely to have metabolic syndrome than non-obese teens. Concerning accuracy, convenience, and ease of use and calculation, BMI is the best screening tool for detecting MetS in Korean children and adolescents.
Keywords: obesity, pediatrics, adolescence, metabolic syndrome, risk factors
Introduction
A significant proportion of obese children and adolescents in lower-, middle-, and high-income countries become obese adults who have an increased risk of metabolic disorders such as type 2 diabetes (T2D) and cardiovascular disease (CVD), which threatens the global healthcare system.1,2 Early detection of metabolic complications associated with overweight and obesity is critical for developing a therapeutic strategy to combat the clinical and economic burden of adult obesity.3,4
Metabolic syndrome (MetS) in adults is defined as a clustering of elevated blood glucose, elevated resting blood pressure, elevated triglycerides, decreased high-density lipoprotein cholesterol, and central or abdominal obesity. MetS is a preclinical stage of metabolic disorders such as T2D and CVD.5 Because there is no universal or uniform definition of MetS, many studies involving children and adolescents use adult definitions with a modified cutoff point for each component of MetS.6 Nonetheless, the prevalence of metabolic syndrome among children and adolescents is rising globally, notably in high-income countries.7 Recent population-based studies involving Korean children and adolescents showed that the prevalence of MetS increased from 3.9% in 2007 to 4.78% in 2022 based on the National Cholesterol Education Program definition, or from 2.29% in 2007 to 3.10% in 2022 based on the International Diabetes Federation definition.8,9
Anthropometric measures, including body mass index (BMI), waist circumference (WC), waist-to-hip ratio (WHtR), and others, have all been used as a diagnostic tool for detecting MetS among children and adolescents. However, the prevalence of MetS varies depending on which obesity measures and MetS definitions are used.10,11 BMI is a limited anthropometric marker of pediatric metabolic risk due to the scarcity of data on this population. Meanwhile, WC and WHtR are central adiposity measures that can be used in research and clinical settings.12 In particular, WC has become a useful measure of childhood and adolescent obesity that can predict fat mass as well as or better than BMI, and it assesses total adiposity, a measure that is closely related to intra-abdominal fat.13,14
In South Korea, the rising prevalence of MetS in children and adolescents poses a threat to the healthcare system.15 Detecting MetS in teens is a primary measure against metabolic disorders in adulthood. However, little is known about the accuracy of BMI, WC, and WHtR as obesity indexes for detecting MetS in Korean pediatric populations. The purpose of this study was to examine the accuracy of obesity indicators in estimating MetS risk in a representative sample of Korean adolescents aged 10 to 18 years.
Materials and Methods
Data Source and Study Participants
As shown in Figure 1, we initially included 4598 boys and girls aged 10 to 18 years (2432 boys and 2166 girls) who participated in the Fourth and Fifth Korea National Health and Nutrition Examination Surveys (KNHNES) in South Korea from 2008 to 2011. The participants with no anthropometric or body composition data (1540 boys and 1395 girls) were then excluded. The final analyses included a total of 1663 participants (892 boys and 771 girls). Additional detailed information about the 2008–2011 KNHNES is available through the national public database (https://www.cdc.gov/nchs/nhanes/about_nhanes.htm; accessed on October 10, 2023).
 |
Figure 1 Selection of study participants. Abbreviation: KNHNES, Korea National Health and Nutrition Examination Survey. |
Variables
Measurement of Anthropometrics and Body Composition
A stadiometer was used to determine height and weight to the nearest 0.1 kg and 0.1 cm, respectively. BMI was calculated as weight divided by the square of height (kg/m2). The waist and hip circumferences were measured to 0.1 cm using a tape ruler placed at the midpoint between the lowest rib and the iliac crest and at the greatest part of the hips, respectively. WHtR was then calculated as the waist divided by the hip.
Definition of Clustered Metabolic Risk Factors
Fasting blood glucose (FBG), total cholesterol (TC), triglycerides (TG), and high-density lipoprotein cholesterol (HDLC) were measured with a Hitachi Automatic Analyzer 7600 (Hitachi, Tokyo, Japan). Systolic blood pressure (SBP) and diastolic blood pressure (DBP) were measured in a seated position with a mercury sphygmomanometer, and the last two of the three measurements were averaged. Mean arterial pressure (MAP) was calculated using the formula: MAP = DBP + 1/3 (SBP-DBP).
A Z-score method was used to calculate the standardized continuous metabolic syndrome (cMetS) value for each of the MetS components.16 The Z-score for HDL-C was derived by multiplying by −1 because it is inversely related to MetS risk. The Z-score for each MetS component was used to calculate the cMetS values using the formula [FBG + TG + MAP - HDLC], where a higher value indicates a comparatively higher risk of MetS.17 The cMetS values were then dichotomized at the cutoff value plus one standard deviation (1 SD) to identify children and adolescents who had or did not have clustered metabolic risk factors. The cut-point of 1 SD was chosen to roughly correspond with the prevalence of clustered metabolic risk factors, which is assumed to be a biological phenomenon unrelated to chance.18
Covariates
The covariates were age (years); gender (male vs female); and nutrient intake of carbohydrates (g/day), fats (g/day), and proteins (g/day). The Korean version of the International Physical Activity Questionnaire-Short Form (https://sites.google.com/view/ipaq) was used to monitor moderate to vigorous physical activity in terms of duration (min per session) and frequency (days per week), and activity was quantified in units of min per week.
Statistical Analyses
Quantile-quantile plots were used to verify the normality of the data distribution before statistical analyses. Analysis of variance (ANOVA), followed by Tukey’s post hoc test if necessary, and Chi-square test were used to test mean group differences of continuous (in mean and standard deviation) and discontinuous (in number and percentage) variables, respectively. One-way ANOVA was used to test incremental linear trends in cMetS according to the number of MetS components. Binary logistic regression was used to calculate the odds ratio (OR) and 95% confidence interval (CI) of obesity measures for high cMetS with low cMetS as a reference (OR=1). ROC curve analysis was performed to determine how well obesity measures discriminate between individuals with and without clustered metabolic risk factors. Statistical significance was tested at p = 0.05 using SPSS-PC software (version 27, SPSS, Chicago, IL, USA).
Results
Table 1 represents the descriptive statistics of the study participants. Boys had higher values than girls for BMI (p<0.001), WC (p<0.001), WHtR (p=0.005), SBP (p<0.001), DBP (p<0.001), fasting blood glucose (p<0.001), and cMetS scores (p<0.001), but had lower HDLC (p<0.001). Furthermore, boys consumed more proteins (p<0.001), fats (p<0.001), and carbohydrates (p<0.001) than girls.
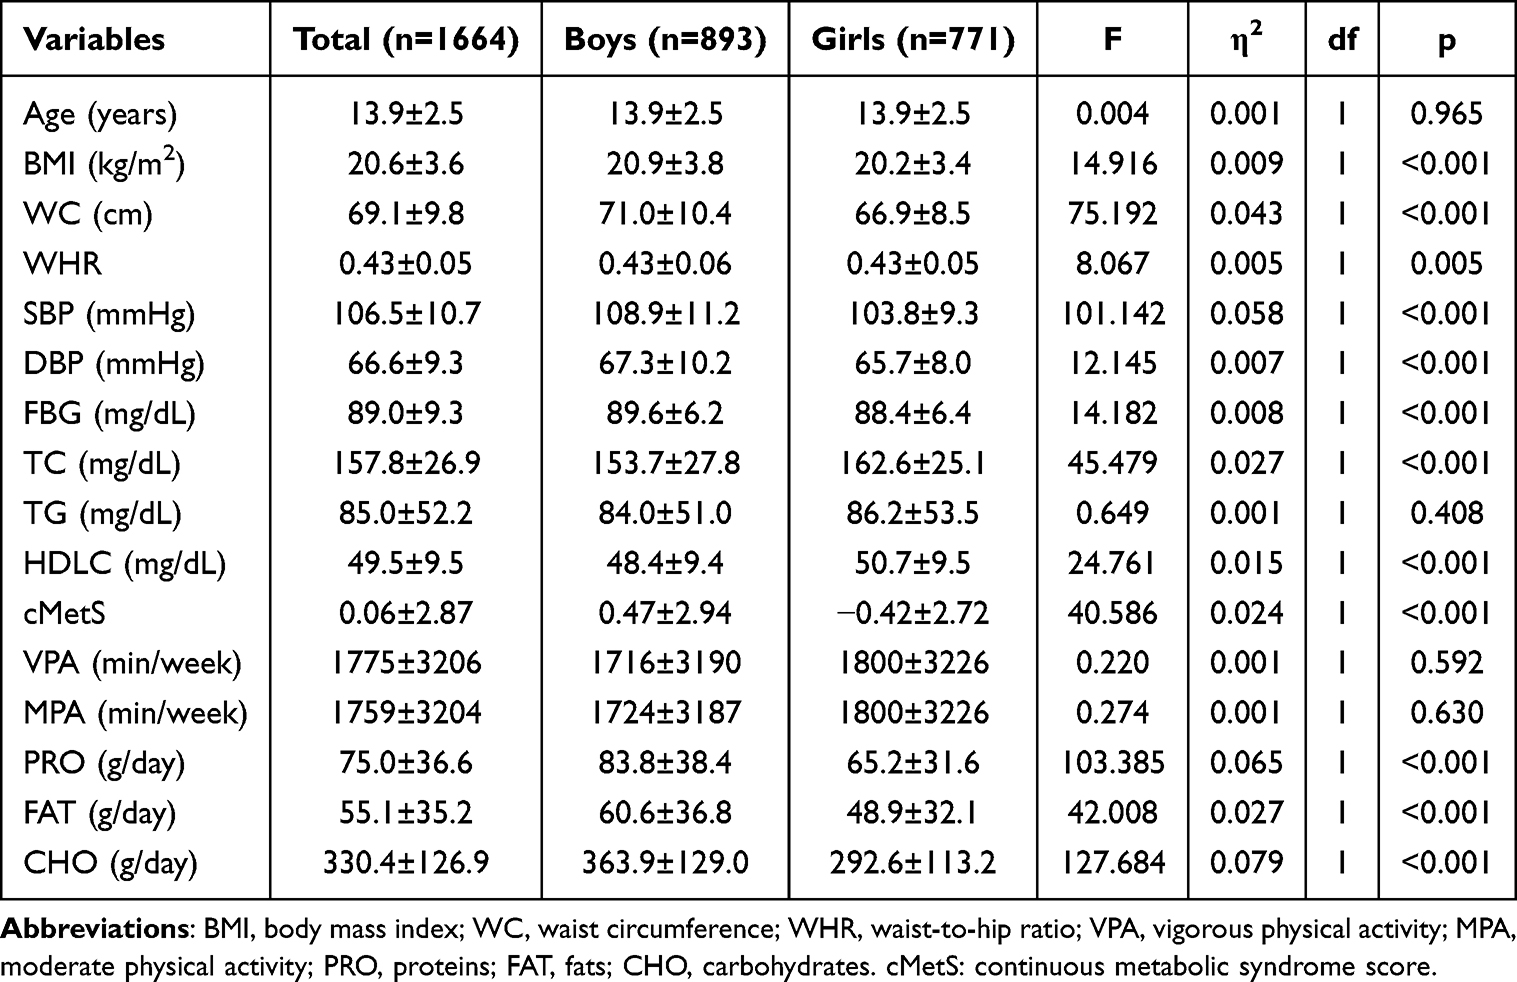 |
Table 1 Descriptive Statistics of Study Participants |
Table 2 represents the prevalence of MetS components in this study population. Decreased HDLC (33.5%) and hypertension (29.2%) accounted for the greatest proportion of MetS components in the total group, with boys having a higher proportion of hypertension (33.2% vs 24.6%, p<0.001) and girls having a higher proportion of decreased HDLC (49.8% vs 19.4%, p<0.001). Additionally, as shown in Figure 2, there was a linear, incremental trend in cMetS values as the number of MetS components increased, with boys having a higher cMetS than girls regardless of MetS component count (F (7,3) = 3.074, p=0.027).
 |
Table 2 Prevalence of Metabolic Syndrome Components |
 |
Figure 2 The relationship between the number of metabolic syndrome components and continuous metabolic syndrome score. |
Table 3 represents the ORs and 95% CIs for clustered metabolic risk factors by obesity status. Regardless of the obesity measures used, obese children and adolescents were at an increased risk for having clustered metabolic risk factors compared to their non-obese counterparts: BMI-based obesity (OR=4.151, 95% CI=2.763~6.238, p<0.001), WC-based abdominal obesity (OR=1.917, 95% CI=1.066~3.446, p=0.010), and WHtR-based upper body obesity (OR=2.160 and 95% CI=1.203~3.878, p=0.003). The increased risk of BMI- (OR=3.699, 95% CI=2.361~5.794, p<0.001) and WHR-based obesity (OR=2.252, 95% CI1.196~4.241, p=0.012)) remained statistically significant even after adjustments for potential covariates, including age, gender, physical activity, dietary intake of macronutrients, and serum vitamin D.
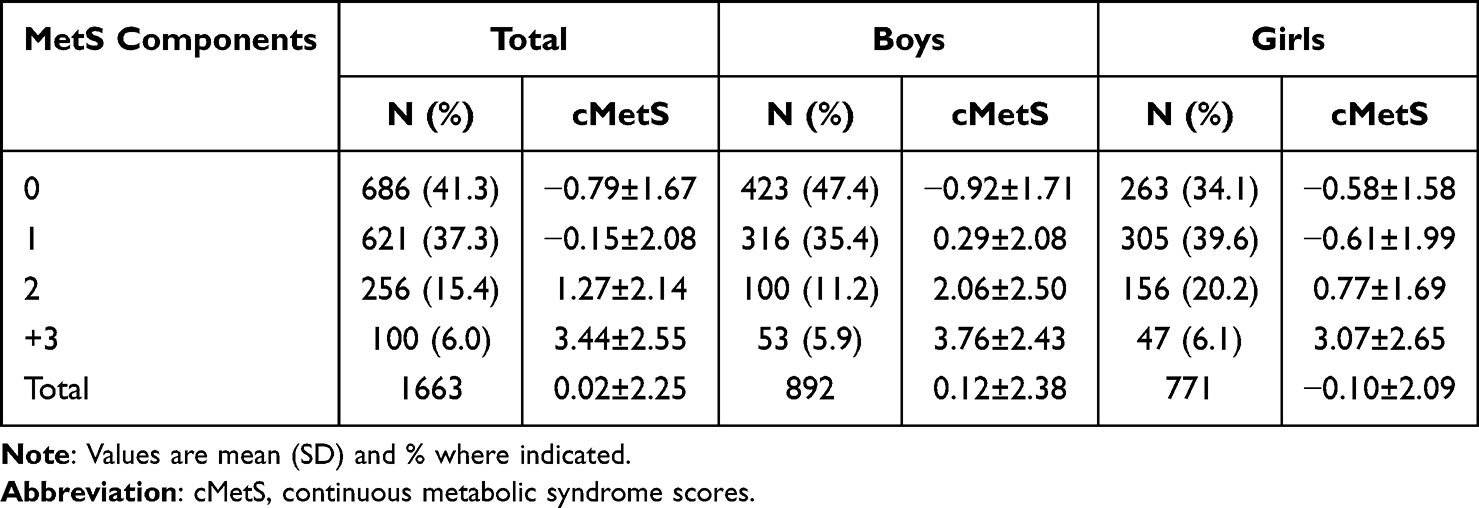 |
Table 3 Continuous Metabolic Syndrome Scores According to the Number of Metabolic Syndrome Components |
As shown in Figure 3, ROC curve analysis was performed to determine how well obesity measures discriminate between those with and without clustered MetS risk factors. In the total group, BMI (AUC=0.849, 95% CI=0.8270.871) outperformed WC (AUC=0.833, 95% CI=0.8090.856) and WHtR (AUC=0.794, 95% CI=0.7670.821) in detecting clustered MetS risk factors in the total group (A). The same pattern was observed in boys (B) and girls (C).
 |
Figure 3 The area under the receiver operating characteristic curve (AUC) and 95% confidence interval (C.I.) of obesity measures for identifying clustered metabolic risk factors in the total group (A), boys (B), and girls (C). |
Discussion
Anthropometric measures of obesity have been used as a diagnostic tool to detect cMetS in children and adolescents, but no single tool is appropriate for all populations. This cross-sectional study examined the relationship between obesity measures and cMetS in Korean children and adolescents. As expected, obese children and adolescents are at an increased risk of having higher cMetS values compared to their non-obese counterparts. Metabolic risk factors are more likely to cluster as the number of metabolic syndrome components increases. As a screening tool, BMI outperformed WC and WHtR for detecting cMetS in this study population.
In agreement with the study findings, BMI is one of the most widely used tools for diagnosing MetS in children and adolescents. Radetti et al conducted a cross-sectional study with 2664 children and adolescents to determine the efficacy of various obesity measures, including BMI, BMI standard deviation score, fat-free mass index, fat mass index, tri-ponderal mass index (TMI), and WHtR, in detecting MetS.19 They concluded that BMI outperformed other measures in detecting MetS and had additional advantages such as being simple to use, quick to calculate, and low in cost. In a systematic review and meta-analysis of ten published articles on the relationship between anthropometrics and MetS in children and adolescents, Sun et al showed that TMI and BMI performed similarly in detecting MetS.20 The diagnostic value of BMI for screening MetS is reported in Japanese patients with schizophrenia.21 In a follow-up study of 17.3±0.4 years involving 2,454,693 teenagers in Israel, Twig et al found that BMI in late adolescence is positively related to CVD mortality risk in adulthood.22 A recent review study by Khanna et al concluded that even with some limitations, BMI has a diagnostic role in predicting various health conditions such as diabetes, hypertension, and disease-related mortality.23 Taken together, the findings from the current and previous studies support the clinical importance of BMI as a screening tool for MetS in children and adolescents.
However, the ability of obesity indicators to detect MetS varies by population. For example, WHtR outperformed MetS in detecting metabolically unhealthy Spanish obese adolescents,24 as well as MetS in Egyptian obese adolescents,25 Brazilian adolescents,26 and Taiwan adolescents.10 In a cross-sectional study involving 1687 Colombian collegiate students (63.4% women), Ramírez-Vélez et al showed that percent body fat and fat mass index performed moderately well in predicting MetS.27 In a systematic review of 10 cross-sectional studies involving 17,764 American, Asian, African, and European teens aged 10–19 years, Lima Borges et al investigated how well anthropometric measures of obesity could detect high blood pressure.28 They found that BMI, WC, and WHtR were not very good at detecting high blood pressure in adolescents.
Differences in the accuracy of obesity measures in detecting MetS between populations may be due to a variety of factors, including age, gender, race, nutritional status, different socioeconomic and cultural factors, and lifestyle choices.29,30 In this study, we also found a gender difference in cMetS values: boys have higher cMetS than girls. In agreement with this, a gender difference in MetS risk has been reported in recent studies involving Korean children and adolescents31 and treatment-seeking European adolescents with severe obesity.32 Concerning gender difference, MetS is more common in girls in pre- or early puberty than in boys in middle- or late puberty. Hormonal changes during puberty and their impact on insulin resistance may have distinct effects on metabolic components by gender and age.33 Additionally, during adolescence, girls are more concerned with body image and self-identity than boys. Physical, psychological, social, and cultural factors appear to play a role in gender-specific body image and self-identity.34 A cohort study focusing on those factors will be required to assess the accuracy of anthropometric measures in detecting MetS risk in children and adolescents.
Strength and Limitations
The strength of this study is that a representative sample of Korean children and adolescents aged 10–18 years was used to investigate the prognostic role of the three most common indicators of obesity, such as BMI, WC, and WHtR, in detecting the presence of MetS. This study has some limitations. First, the cross-sectional nature of the study does not allow us to provide any cause-and-effect explanation about the relationship between obesity measures and MetS. A longitudinal study should be conducted to better understand the role of obesity measures in MetS risk stratification in a pediatric population. Second, the accuracy of obesity measures in detecting the presence of MetS can vary depending on the definition of MetS used. An additional study is guaranteed to determine whether the accuracy of the prognostic tools for detecting the presence of MetS varies according to the definitions used. Third, additional covariates not included in the current study could improve the accuracy of obesity measures as a screening tool for the presence of MetS in pediatric populations.
Conclusions and Recommendation
In conclusion, the current study findings suggest that obese teenagers are more likely to have metabolic syndrome than non-obese teens. In terms of accuracy, convenience, and ease of use and calculation, BMI outperforms WC and WHtR in detecting the presence of MetS in Korean children and adolescents.
Abbreviations
MetS, Metabolic syndrome; BMI, Body mass index; WC, Waist circumference; WHtR, Waist-to-hip ratio; AUC, Area under the curve; T2D, Type-2 diabetes; CVD, Cardiovascular disease; KHNNES, Korea National Health and Nutrition Examination Surveys; FBG, Fasting blood glucose; TC, Total cholesterol; TG, Triglycerides; HDLC, High-density lipoprotein cholesterol; SBP, Systolic blood pressure; DBP, diastolic blood pressure.
Data Sharing Statement
All the required documents are available in the hands of the corresponding author and can be supplied upon request.
Ethics Approval and Consent to Participate
The Institutional Review Board of the Korean Institute for Health and Social Affairs reviewed and approved this study (approval no. 2008-04EXP-01-C, 2009-01CON-03-2C, 2010-02CON-21-C, and 2011-02CON-06-C), which was performed following the Declaration of Helsinki. Informed consent was obtained from all participants and/or their parents.
Acknowledgments
We thank the Korea Disease Control and Prevention Agency (KDCA) for approving my application to access the data.
Author Contributions
All authors made a significant contribution to the work reported, whether that is in the conception, study design, execution, acquisition of data, analysis, and interpretation, or all these areas; took part in drafting, revising, and critically reviewing the article; gave final approval of the version to be published; have agreed on the journal to which the article has been submitted; and agree to be accountable for all aspects of the work.
Funding
This study was supported by a Research Grant (Grant No. KSSO202303) from the Korean Society for the Study of Obesity.
Disclosure
The authors declare that they have no competing interests in this work.
References
1. Lister NB, Baur LA, Felix JF. et al. Child and adolescent obesity. Nat Rev Dis Primers. 2023;9(1):24. doi:10.1038/s41572-023-00435-4
2. Ng CD, Cunningham SA. In, out, and fluctuating: obesity from adolescence to adulthood. Ann Epidemiol. 2020;41:14–20. doi:10.1016/j.annepidem.2019.12.003
3. Hampl SE, Hassink SG, Skinner AC, et al. Clinical practice guideline for the evaluation and treatment of children and adolescents with obesity. Pediatrics. 2023;151(2):e2022060640. doi:10.1542/peds.2022-060640
4. Sanyaolu A, Okorie C, Qi X, Locke J, Rehman S. Childhood and adolescent obesity in the United States: a public health concern. Glob Pediatr Health. 2019;6:233379. doi:10.1177/2333794X19891305
5. Kim S, So WY. Prevalence of metabolic syndrome among Korean adolescents according to the national cholesterol education program, adult treatment panel III and international diabetes federation. Nutrients. 2016;8:588. doi:10.3390/nu8100588
6. Chae J, Seo MY, Kim SH, Park MJ. Trends and risk factors of metabolic syndrome among Korean adolescents, 2007 to 2018. Diabetes Metab J. 2021;45(6):880–889. doi:10.4093/dmj.2020.0185
7. Noubiap JJ, Nansseu JR, Lontchi-Yimagou E, et al. Global, regional, and country estimates of metabolic syndrome burden in children and adolescents in 2020: a systematic review and modelling analysis. Lancet Child Adolesc Health. 2022;6(3):158–170. doi:10.1016/S2352-4642(21)00374-6
8. Lee J, Kang SC, Kwon O, Hwang SS, Moon JS, Kim J. Reference values for waist circumference and waist-height ratio in Korean children and adolescents. J Obes Metab Syndr. 2022;31:263–271. doi:10.7570/jomes22033
9. Moon JS, Lee SY, Nam CM, et al. 2007 Korean National Growth Charts: review of developmental process and an outlook. Korean J Pediatr. 2008;51:1–25.
10. Chin YT, Lin WT, Wu PW, et al. Characteristic-grouped adiposity indicators for identifying metabolic syndrome in adolescents: develop and valid risk screening tools using dual population. Nutrients. 2020;12(10):3165. doi:10.3390/nu12103165
11. Reisinger C, Nkeh-Chungag BN, Fredriksen PM, Goswami N. The prevalence of pediatric metabolic syndrome-a critical look on the discrepancies between definitions and its clinical importance. Int J Obes. 2021;45(1):12–24. doi:10.1038/s41366-020-00713-1
12. Magalhães EI, Sant’Ana LF, Priore SE, Franceschini Sdo C. Waist circumference, waist/height ratio, and neck circumference as parameters of central obesity assessment in children. Rev Paul Pediatr. 2014;32(3):273–281. doi:10.1590/0103-0582201432320
13. Brambilla P, Bedogni G, Heo M, Pietrobelli A. Waist circumference-to-height ratio predicts adiposity better than body mass index in children and adolescents. Int J Obes. 2013;37(7):943–946. doi:10.1038/ijo.2013.32
14. Pinho CPS, Diniz ADS, Arruda IKG, Leite APDL, Petribu MMV, Rodrigues IG. Waist circumference measurement sites and their association with visceral and subcutaneous fat and cardiometabolic abnormalities. Arch Endocrinol Metab. 2018;62(4):416–423. doi:10.20945/2359-3997000000055
15. Kim JH, Lim JS. Prevalence trends of metabolic syndrome among Korean children and adolescents from a population-based cross-sectional survey. Life. 2022;12(9):1404. doi:10.3390/life12091404
16. Shafee G, Kelishadi R, Heshmat R, et al. First report on the validity of a continuous metabolic syndrome score as an indicator for metabolic syndrome in a national sample of paediatric population—the CASPIAN-III study. Endokrynol P. 2013;64(4):278–284. doi:10.5603/ep.2013.0006
17. Heshmat R, Heidari M, Ejtahed H-S, et al. Validity of a continuous metabolic syndrome score as an index for modeling metabolic syndrome in children and adolescents: the CASPIAN-V study. Diabetol Metab Syndr. 2017;9:89. doi:10.1186/s13098-017-0291-4
18. Vukovic R, Milenkovic T, Stojan G, et al. Pediatric siMS score: a new, simple and accurate continuous metabolic syndrome score for everyday use in pediatrics. PLoS One. 2017;12(12):e0189232. doi:10.1371/journal.pone.0189232
19. Radetti G, Fanolla A, Grugni G, Lupi F, Sartorio A. Indexes of adiposity and body composition in the prediction of metabolic syndrome in obese children and adolescents: which is the best? Nutr, Metab Cardiovasc Dis. 2019;29(11):1189–1196. doi:10.1016/j.numecd.2019.06.011
20. Sun J, Yang R, Zhao M, Bovet P, Xi B. Tri-ponderal mass index as a screening tool for identifying body fat and cardiovascular risk factors in children and adolescents: a systematic review. Front Endocrinol. 2021;12:694681. doi:10.3389/fendo.2021.694681
21. Sugawara N, Yasui-Furukori N, Yamazaki M, et al. Predictive utility of body mass index for metabolic syndrome among patients with schizophrenia in Japan. Neuropsychiatr Dis Treat. 2020;16:2229–2236. doi:10.2147/NDT.S269619
22. Twig G, Yaniv G, Levine H, et al. Body-mass index in 2.3 million adolescents and cardiovascular death in adulthood. N Engl J Med. 2016;374(25):2430–2440. doi:10.1056/NEJMoa1503840
23. Khanna D, Peltzer C, Kahar P, Parmar MS. Body mass index (BMI): a screening tool analysis. Cureus. 2022;14(2):e22119. doi:10.7759/cureus.22119
24. Yeste D, Clemente M, Campos A, et al. Precisión diagnóstica del índice de masa triponderal (kg/m3) para identificar el fenotipo de riesgo metabólico en pacientes obesos [Diagnostic accuracy of the tri-ponderal mass index in identifying the unhealthy metabolic obese phenotype in obese patients]. An Pediatr. 2021;94(2):68–74. Spanish. doi:10.1016/j.anpedi.2020.04.004
25. Zaki ME, El-Bassyouni HT, El-Gammal M, Kamal S. Indicators of the metabolic syndrome in obese adolescents. Arch Med Sci. 2015;11(1):92–98. doi:10.5114/aoms.2015.49214
26. Oliveira RG, Guedes DP. Performance of anthropometric indicators as predictors of metabolic syndrome in Brazilian adolescents. BMC Pediatr. 2018;18(1):33. doi:10.1186/s12887-018-1030-1
27. Ramírez-Vélez R, Correa-Bautista JE, Sanders-Tordecilla A, et al. Percentage of body fat and fat mass index as a screening tool for metabolic syndrome prediction in Colombian university students. Nutrients. 2017;9(9):1009. doi:10.3390/nu9091009
28. Lima Borges L, Rodrigues de Lima T, Augusto Santos Silva D. Accuracy of anthropometric indicators of obesity to identify high blood pressure in adolescents-systematic review. PeerJ. 2022;10:e13590. doi:10.7717/peerj.13590
29. Chan V, Liujiao C, Wong MMH, Lo K, Tam W. Diagnostic accuracy of waist-to-height ratio, waist circumference, and body mass index in identifying metabolic syndrome and its components in older adults: a systematic review and meta-analysis. Curr Develop Nutri. 2024;8(1):102061. doi:10.1016/j.cdnut.2023.102061
30. Kim E, Lee GB, Yon DK, Kim HC. Trends in socioeconomic inequalities in obesity among Korean adolescents: the Korea Youth Risk Behavior Web-based Survey (KYRBS) 2006 to 2020. Epidemiol Health. 2023;45:e2023033. doi:10.4178/epih.e2023033
31. Choi J, Yoon TW, Yu MH, Kang DR, Choi S. Gender and age differences in the prevalence and associated factors of metabolic syndrome among children and adolescents in South Korea. Child Health Nurs Res. 2021;27(2):160–170. doi:10.4094/chnr.2021.27.2.160
32. Barstad LH, Júlíusson PB, Johnson LK, Hertel JK, Lekhal S, Hjelmesæth J. Gender-related differences in cardiometabolic risk factors and lifestyle behaviors in treatment-seeking adolescents with severe obesity. BMC Pediatr. 2018;18(1):61. doi:10.1186/s12887-018-1057-3
33. Tryggestad JB, Chernausek SD. BMI changes through childhood: the impact on puberty, linear growth and hormonal regulation. Pediatr Res. 2020;88(1):11–13. doi:10.1038/s41390-020-0903-9
34. Toselli S, Grigoletto A, Zaccagni L, et al. Body image perception and body composition in early adolescents: a longitudinal study of an Italian cohort. BMC Public Health. 2021;21(1):1381. doi:10.1186/s12889-021-11458-5
 © 2024 The Author(s). This work is published and licensed by Dove Medical Press Limited. The full terms of this license are available at https://www.dovepress.com/terms.php and incorporate the Creative Commons Attribution - Non Commercial (unported, v3.0) License.
By accessing the work you hereby accept the Terms. Non-commercial uses of the work are permitted without any further permission from Dove Medical Press Limited, provided the work is properly attributed. For permission for commercial use of this work, please see paragraphs 4.2 and 5 of our Terms.
© 2024 The Author(s). This work is published and licensed by Dove Medical Press Limited. The full terms of this license are available at https://www.dovepress.com/terms.php and incorporate the Creative Commons Attribution - Non Commercial (unported, v3.0) License.
By accessing the work you hereby accept the Terms. Non-commercial uses of the work are permitted without any further permission from Dove Medical Press Limited, provided the work is properly attributed. For permission for commercial use of this work, please see paragraphs 4.2 and 5 of our Terms.