")
Back to Journals » Nature and Science of Sleep » Volume 8
The effects of fabric for sleepwear and bedding on sleep at ambient temperatures of 17°C and 22°C
Authors Shin M , Halaki M , Swan P, Ireland A, Chow CM
Received 10 November 2015
Accepted for publication 22 December 2015
Published 22 April 2016 Volume 2016:8 Pages 121—131
DOI https://doi.org/10.2147/NSS.S100271
Checked for plagiarism Yes
Review by Single anonymous peer review
Peer reviewer comments 2
Editor who approved publication: Dr Steven A Shea
Mirim Shin,1 Mark Halaki,1 Paul Swan,2 Angus Ireland,2 Chin Moi Chow1
1Exercise, Health and Performance Research Group, Faculty of Health Sciences, The University of Sydney, Lidcombe, 2Australian Wool Innovation Limited, The Woolmark Company, Sydney, NSW, Australia
Abstract: The fibers used in clothing and bedding have different thermal properties. This study aimed to investigate the influences of textile fabrics on sleep under different ambient temperature (Ta) conditions. Seventeen healthy young participants (ten males) underwent nine nights of polysomnography testing including an adaptation night. Participants were randomized to each of the three binary factors: sleepwear (cotton vs wool), bedding (polyester vs wool), and Ta (17°C vs 22°C with relative humidity set at 60%). Skin temperature (Tsk) and core temperature (Tc) were monitored throughout the sleep period. Sleep onset latency (SOL) was significantly shortened when sleeping in wool with trends of increased total sleep time and sleep efficiency compared to cotton sleepwear. At 17°C, the proportion of sleep stages 1 (%N1) and 3 (%N3) and rapid eye movement sleep was higher, but %N2 was lower than at 22°C. Interaction effects (sleepwear × Ta) showed a significantly shorter SOL for wool than cotton at 17°C but lower %N3 for wool than cotton at 22°C. A significantly lower %N2 but higher %N3 was observed for wool at 17°C than at 22°C. There was no bedding effect on sleep. Several temperature variables predicted the sleep findings in a stepwise multiple regression analysis and explained 67.8% of the variance in SOL and to a lesser degree the %N2 and %N3. These findings suggest that sleepwear played a contributory role to sleep outcomes and participants slept better at 17°C than at 22°C.
Keywords: cotton, polyester, wool, polysomnography, skin temperature, core body temperature
Introduction
Thermal environment is an important factor that affects human sleep since sleep regulation is closely linked to thermoregulation. For instance, sleep onset is normally initiated by a decrease in core body temperature (Tc) and an increase in skin temperature (Tsk) distally for heat to be dissipated from the core to the environment through the periphery yielding a rise in distal–proximal temperature gradient (DPG).1,2 Tc continues to decrease across the night to a nadir, while Tsk remains high and an increase in Tc is seen at sleep termination.3 Thermal environment including temperature, humidity, and air speed influences sleep.4 Especially, cold exposure significantly increased wake after sleep onset (WASO) and stage 1 sleep (N1) and decreased stage 2 (N2) and rapid eye movement (REM) sleep in semi-nude participants possibly due to altered thermoregulatory mechanisms.5 Yet, in practice, clothing or bedding acts to insulate the body and improved thermal comfort when used in cold environments such that sleep variables showed no significant differences at an ambient temperature (Ta) range of 13°C–23°C6 and 3°C–17°C.7 In addition, previous experimental studies determined thermoneutral temperatures as 20°C–22.2°C under covered conditions.8,9 In fact, the usage of air-conditioner or heater is increasing to maintain optimal sleeping environment. However, this strategy leads to escalating energy costs; thus, optimizing sleepwear or bedding would be one of the cost-effective strategies.
A theoretical study on thermal comfort model in the sleeping environment confirmed that insulation provided by sleepwear and bedding maintains thermal comfort during sleep.10 Textile fabrics, through their inherent thermal insulation and hygral properties, have critical influence on thermal comfort with respect to heat and moisture transfer between skin and the surrounding environment.11 Both natural (cotton and wool) and artificial (polyester) fibers have been used for sleepwear and bedding. Differences in their textile properties suggest potential differential effects on thermal insulation, and therefore, a systematic approach to investigating their influences on sleep is warranted. Wool is a naturally crimped keratin protein fiber of high hygroscopicity (the ability to absorb moisture when the fiber is completely dry) and high thermal insulation compared to cotton, acrylic, nylon, and polyester.12,13 Such properties of wool can help regulate the Tsk and the microclimate temperature and relative humidity (RH) in the space between skin and sleepwear/bedding, which in turn may keep the wearer more comfortable under a range of conditions.14 Heat of sorption (heat being released when water molecules are absorbed into the fiber structure) decreases in order of wool, cotton, and polyester fibers.13 Thus, wool fibers, compared to either cotton or polyester fibers, would be expected to have a greater capacity to absorb moisture and release heat to/from surrounding air or skin, in a temperature- and RH gradient-dependent manner. Unsurprisingly, when comparing cotton to polyester fabric at a Ta of 37°C and 60% RH, a higher sweating rate was observed with polyester15 since polyester is less hygroscopic than cotton.
There are few practical studies on the effect of fabric type for bedding, on sleep. A study found that sleeping on woolen underlay significantly lowered body movement, reported higher subjective sleep quality, and better feeling in the morning when compared to the control pads.16 A study that compared wool-filled duvets and polyester-filled duvets at 16°C revealed that heart rate and the microclimate temperature and humidity were lower for wool during the sleep period.17 Lower sweat production, Tsk, and microclimate temperature and humidity were observed with wool blanket compared to acrylic–fiber–cotton blends under warm and humid conditions.18 The authors ascribed these changes to the moisture-buffering and transport properties of wool fibers.18 However, none of these previous studies recorded objective sleep measures using polysomnography (PSG).
Given the likely importance of thermal comfort for sleep,10,19 we may thus expect to observe different impacts of fabric for sleepwear and bedding on sleep. Therefore, this study, in a 2×2×2 factorial design, evaluated the effects of sleepwear (wool vs cotton), bedding type (wool vs polyester), and temperature (17°C vs 22°C) on sleep, using PSG. The recorded overnight average temperature (collected from 2012 to 2014) in the winter season from 10 pm to 6 am was 17.1°C±2.6°C and that for the spring and autumn seasons were 21.1°C±1.9°C and 21.6°C±2.2°C, respectively, in Australian houses (Faculty of Architecture, The University of Sydney, Australian Research Council’s Discovery Projects, DP 11010559). Thus, these temperatures were selected for this study to simulate ambient conditions observed for those seasons. We hypothesized that 1) wool sleepwear/bedding would provide better sleep than nonwool sleepwear/bedding and 2) participants would sleep better at 17°C than at 22°C.
Methods
Participants
This study was conducted with the approval of the University of Sydney Human Ethics Committee (Protocol No. 13528). Written informed consent was obtained from all participants. Seventeen participants (ten males and seven females) aged 24.6±6.9 years with a mean body mass index of 23.7±2.2 kg·m−2 completed nine nights of PSG testing including an adaptation night. All female participants were on contraceptives to minimize hormonal effects on sleep.20 Participants with preexisting medical conditions such as cardiorespiratory conditions (hypertension, cardiovascular diseases, respiratory infections, or chronic obstructive pulmonary diseases) and metabolic conditions (diabetes or metabolic syndrome) were excluded. Sleep disorders (insomnia, sleep apnea, periodic limb movement disorders, or bruxism) were assessed during the familiarization night where full PSG testing was conducted. Participants with a history of having difficulty swallowing food or large capsules were also excluded because they were required to swallow a capsule for measuring Tc. Individuals on night shifts or medications/drugs or who smoked or had traveled across transmeridian borders in the last 2 weeks were also excluded. Participants abstained from alcohol on the study days and from caffeinated beverages and vigorous exercise 8 hours before their average bedtime.
Procedures
Participants wore an actigraph wristwatch device on the nondominant arm for a week, prior to study commencement, to assess their average bedtime and wake time. These schedules were applied during testing nights. They attended the sleep laboratory on nine occasions nonconsecutively to avoid the previous night’s sleep affecting the sleep the next night with no more than a week apart between studies. On the familiarization night, they completed the demographics and medical history questionnaire. Participants slept on a king size single mattress with a 100% cotton bed sheet. The climate conditions of the bedrooms had been controlled 2 hours before their bedtime. The mean bedroom temperatures for the two study conditions were 17.4°C±0.3°C and 22.4°C±0.5°C with RH of 60.3%±2.0%. The Ta and RH were continuously recorded throughout the night by a Hygrochron™ iButton (type DS1923; Maxim/Dallas Semiconductor Corporation, Dallas, TX, USA) placed on the bedside table. Following the familiarization night, participants were randomized to eight different sleeping conditions according to a 2×2×2 matrix of sleepwear (wool vs cotton), bedding (wool vs polyester duvet with a cotton cover), and Ta (17°C vs 22°C) by means of random sequences generated within Excel using the RAND function. On each test night, participants ate a standardized mixed macronutrient meal 4 hours before, and swallowed a temperature capsule 2 hours before, their average bedtime. Participants changed into the testing sleepwear.
Sleepwear and bedding
Sleepwear (100% cotton or 100% Merino wool) was custom-tailored sets of pajamas in long sleeve and long pants in four sizes (small, medium, large, and extra-large). Both sets of sleepwear were loosely knitted and closely matched for mass (P=1.0) and thickness (P=0.095). The fabric characteristics of sleepwear are presented in Table 1. Since commercially available bedding (polyester or wool duvet) was used in this study, some differences existed in the fabric physical parameters between polyester and wool bedding (Table 1).
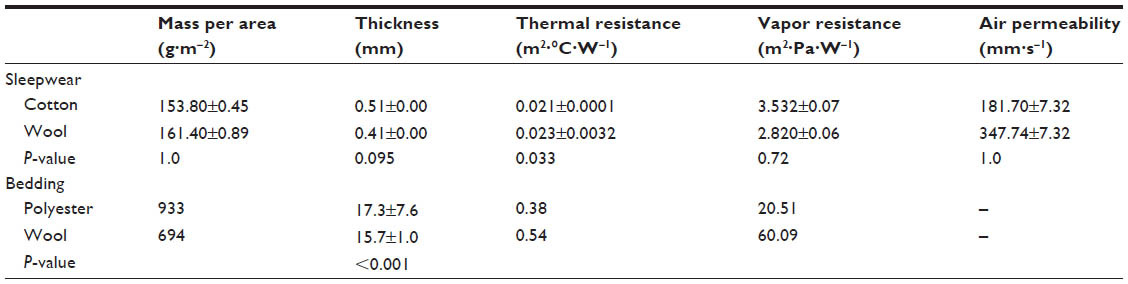 | Table 1 Fabric characteristics of sleepwear |
Measurements
Subjective ratings
On each study night, participants rated their thermal sensation at bedtime and on waking (while lying in bed) on a Likert scale ranging from 1 (cold), 2 (cool), 3 (slightly cool), 4 (neutral), 5 (slightly warm), 6 (warm) to 7 (hot) and mood including vitality (sluggish vs energetic), well-being (grouchy vs content), and anxiety (tense vs relaxed) with a scale of 1 (above the left descriptor) to 5 (above the right descriptor). Tactile sensation ratings for sleepwear/bedding were for lightness (light vs heavy), softness (soft vs hard), dampness (damp vs dry), and comfort (discomfort vs comfort) with a scale of 1 (above the left descriptor) to 5 (above the right descriptor), and thermal sensation ranged from 1 (cold) to 7 (hot). They were also allowed to mark smooth/grainy/rough/prickly/slippery/starchy/stiff or report any other tactile sensation. All subjective assessments were administered via pen and paper.
Polysomnography
Sleep was measured using the Compumedics E-series or W-series Sleep system (Compumedics Australia Pty Ltd, Abbotsford, VIC, Australia). Electroencephalography (EEG) electrode placement (C3/A2, O2/A1, and F3/Cz for W-series or F3/A2 for E-series) was conducted in accordance with the International 10-20 system. Electrocardiogram, chin electromyogram, and electrooculogram were continuously recorded. All electrode sites were referenced to the vertex (Cz), and a ground electrode was attached to the forehead (Fpz). All signals were sampled at the rate of 256 Hz. The impedance of EEG recording electrodes was checked prior to data collection, and the threshold was <5 kΩ. On the adaptation night, left and right leg electromyogram, oxygen saturation, thoracic and abdominal breathing movements, and airflow were also recorded to exclude sleep disorders. PSG data were blind scored by two experienced scorers according to the American Academy of Sleep Medicine guidelines.21 The sleep indices including sleep onset latency (SOL), WASO, total sleep time (TST), sleep efficiency (SE), EEG arousal index (number of EEG arousals per hour), and proportion of sleep stages as a percentage of TST including NREM (non-rapid eye movement) sleep, stages N1, N2, and N3 and REM sleep, were assessed.
Actigraphy
Actiwatch 2 (Philips Respironics, Murryville, PA, USA) was placed on the nondominant wrist. Actigraphic data were scored using Respironics Actiware v5.59.0015. Data were collected in 30-second epochs. Rest intervals (time in bed) were manually set based on activity level and the timing of lights-out and -on, and sleep indices variables were estimated by the software algorithm. The sensitivity of the actigraphy was set to the medium level.
Skin temperature measurements
Hygrochron™ iButtons (type DS1923; Maxim/Dallas Semiconductor Corporation) were used to measure Tsk and for monitoring the ambient condition (Ta and RH) during the sleep period. Seven iButtons were attached to the participants’ skin according to a previous study22 (the left and right medial metatarsal area at plantar sites of foot, left and right thenar areas at palmar sites of hands, left musculus rectus femoris, abdomen, and left mid-infraclavicular area) 2 hours before their bedtime and removed on waking. All iButtons were configured with a sampling rate of 30 seconds and data retrieved through the eTemperature software (OnSolution Pty Ltd, Castle Hill, NSW, Australia) and exported to Microsoft Excel for analysis. Distal Tsk was calculated as the average temperature of both feet and hands, and a weighted average was calculated for proximal Tsk using the equation (0.383 × mid-thigh + 0.293 × infraclavicular + 0.324 × abdomen) according to Raymann et al.22
Core body temperature measurement
The Equivital system (Philips Respironics) was employed to detect overnight Tc. The temperature capsule “Jonah” (Philips Respironics) was swallowed with water 2 hours before bedtime, after the capsule was activated. Temperature data transmission began 15 seconds after activation at a rate of four times per minute. The data logger was housed in the Equivital belt worn by the participant throughout the night to minimize data loss. Following waking, the data were downloaded and exported to Microsoft Excel using the Equivital manager software.
Temperature data analysis
The overnight temperature data yielded Tc, distal and proximal Tsk, DPG, and distal–core temperature gradient (DCG) at sleep onset and when their peaks were reached (peak temperatures identified according to the highest peak reached without a change in gradient) after bedtime (Figure 1). After the peak was reached, the temperature variables showed a “plateau” with oscillations across the rest of the night. Tc nadirs (the lowest value reached) for each study night were detected manually using MATLAB (The MathWorks Inc., USA). The reliability of manual detection of peak temperature and nadir, performed twice by the same experimenter, demonstrated high repeatability (correlation coefficients ranged 0.8–1.0). The second attempt was selected for statistical analysis. The slopes (based on the gradient taken 2.5 minutes from either side of the sleep onset point) for distal Tsk, proximal Tsk, Tc, DPG, and DCG as well as the duration from sleep onset to the peak or nadir were also detected (Figure 1). The magnitude (M) and rate of temperature change (R) in distal Tsk (M-disTsk and R-disTsk), proximal Tsk (M-proxTsk; R-proxTsk), and Tc (M-Tc; R-Tc) between bedtime and sleep onset and between sleep onset and the peak were determined. The fluctuation in temperatures at the temperature plateau was analyzed using the root mean square of the temperature over the plateau. Tc data at a rate of two times per minute were analyzed to match the sampling rate of iButtons.
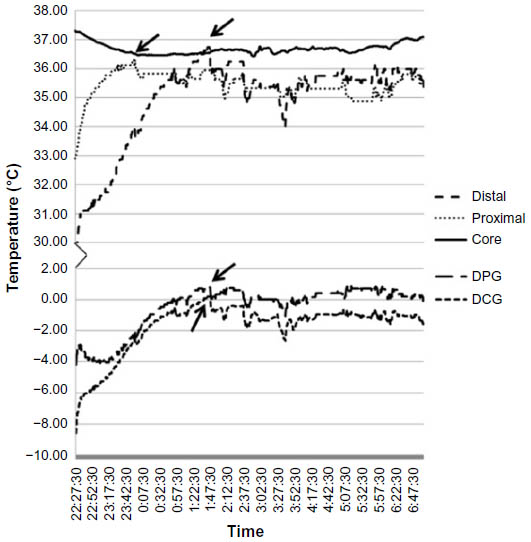 | Figure 1 Temperature changes during sleep for one participant from bedtime to wake time. |
Statistical analysis
Subjective ratings were analyzed by means of the Kruskal–Wallis test (SPSS v21; IBM Corporation, Armonk, NY, USA). Of the 136 test nights, two nights of PSG data were excluded from the analysis due to technical issues. A linear mixed model analysis (SPSS) was applied to the sleep variables of SOL, WASO, TST, SE, and proportion of sleep stages as a percentage of TST (%N1, %N2, %N3, and %REM sleep) to test the main effects of sleepwear, bedding, and Ta conditions and their two-way and three-way interactions. Further analysis on interaction results was performed using Fisher’s least significant difference for pairwise comparisons. A stepwise multiple regression using SPSS was performed to explore possible temperature variables that predicted SOL and sleep stages. Predictors that showed significance were analyzed by a linear mixed model to determine whether the temperature data supported the sleep findings. Pairwise comparisons were applied for post hoc analysis. The criterion of significance was set at 0.05, but any P-value between 0.05 and 0.1 was considered “a trend toward significance”.
Results
Subjective ratings
A significant difference in the rating of thermal sensation on a 7-point Likert scale was observed between the two Ta conditions at bedtime with a mean of 2.8±1.3 at 17°C and 4.0±1.1 at 22°C, χ2 (1, N=136), P<0.001. However, there were no significant differences (P>0.10) in other subjective ratings.
Main effects of sleepwear, bedding, and Ta on sleep
Main effects were observed for sleepwear and Ta. Table 2 shows mean ± standard deviation values for wool and cotton sleepwear for SOL, TST, and SE, averaged across bedding and Ta conditions. Sleeping in wool sleepwear produced a significantly shorter SOL than cotton. Marginally significant results were observed for an increased TST and SE when sleeping in wool compared to cotton sleepwear.
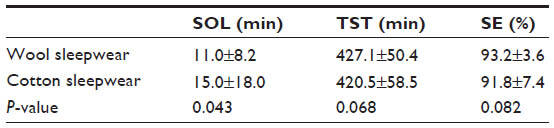 | Table 2 Mean ± SD for sleep variables of SOL, TST, and SE sleeping in wool or cotton sleepwear averaged across ambient temperature and bedding type |
Table 3 shows that regardless of the sleepwear or bedding type, sleeping at 17°C caused significant changes in sleep staging with an increased %N1 and %REM sleep and a trend to increased %N3, but a significant decreased %N2 compared to 22°C. Bedding type had no effect on any of the sleep variables (P≥0.14).
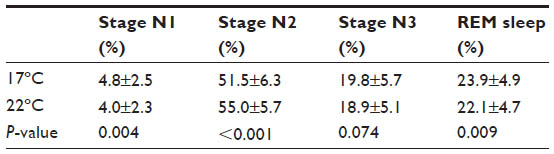 | Table 3 Effect of ambient temperature conditions on proportion of each sleep stage (mean ± SD) averaged across sleepwear and bedding type |
Interaction effects on sleep
A marginal significant interaction between sleepwear and Ta was observed for SOL (P=0.06). Pairwise comparisons further revealed that at the ambient condition of 17°C, participants fell asleep much faster in wool (9.9±6.6 minutes) than in cotton sleepwear (18.1±0.9 minutes), P=0.006, whereas no difference was found between sleepwear at 22°C (Figure 2A). A significant interaction existed for %N2 (P=0.045). When participants slept in wool sleepwear, a lower %N2 was observed at 17°C than at 22°C, P<0.001 (Figure 2B). There was a marginal significant interaction for %N3, P=0.055. When participants slept in wool sleepwear, they had higher %N3 at 17°C (20.1%±5.9% TST) than at 22°C (19.6%±5.7% TST), P=0.009. A pairwise comparison also revealed that sleeping in cotton produced more %N3 than sleeping in wool at 22°C, P=0.05, but there was no difference in %N3 between cotton and wool sleepwear at 17°C (Figure 2C). Mean values of sleep variables for all eight conditions are presented in Table S1.
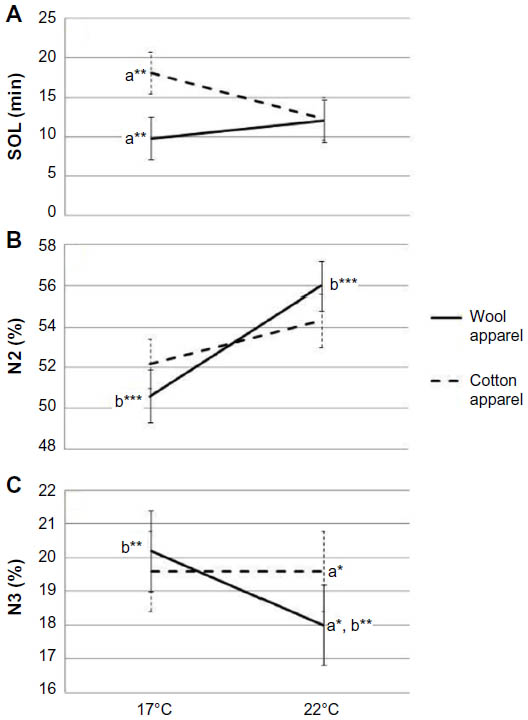 | Figure 2 Effect of sleepwear and ambient temperature on SOL (A), %N2 (B), and %N3 (C). |
Skin and core body temperature data
The mean proximal and distal skin temperature and the mean Tc at bedtime and sleep onset, as well as Tsk peak and Tc nadir, are presented in Table S2. There were no significant differences in the temperature data between sleepwear and between temperature conditions. However, the stepwise multiple regression analysis revealed that several temperature factors significantly explained 67.8% of the variance in SOL, P<0.001 (Table 4). They were in order of prediction strength: M-proxTsk and M-disTsk from bedtime to sleep onset, DCG at sleep onset, and R-Tc from bedtime to sleep onset. Decreases in these variables predicted an early sleep onset (Table 4). The temperature predictors of SOL were further analyzed using a linear mixed model with post hoc analysis, which showed marginal interaction effects between sleepwear and Ta in M-proxTsk (P=0.056), M-disTsk (P=0.058), and R-Tc (P=0.071) from bedtime to sleep onset and DCG at sleep onset (P=0.003) (Figure 3). Comparison between sleepwear conditions at 17°C showed a significantly lower M-proxTsk and M-disTsk from bedtime to sleep onset, lower DCG at sleep onset, but higher R-Tc from bedtime to sleep onset predicted earlier sleep onset for wool than cotton sleepwear. Comparison between Ta conditions showed a significantly higher M-proxTsk, M-disTsk, and R-Tc from bedtime to sleep onset at 17°C compared to 22°C for cotton sleepwear, predicting a delayed sleep onset. A significantly lower DCG at sleep onset was also observed at 17°C than at 22°C for the wool sleepwear, predicting an early sleep onset. Post hoc analysis showed no significant difference in SOL between Ta conditions (Figure 2).
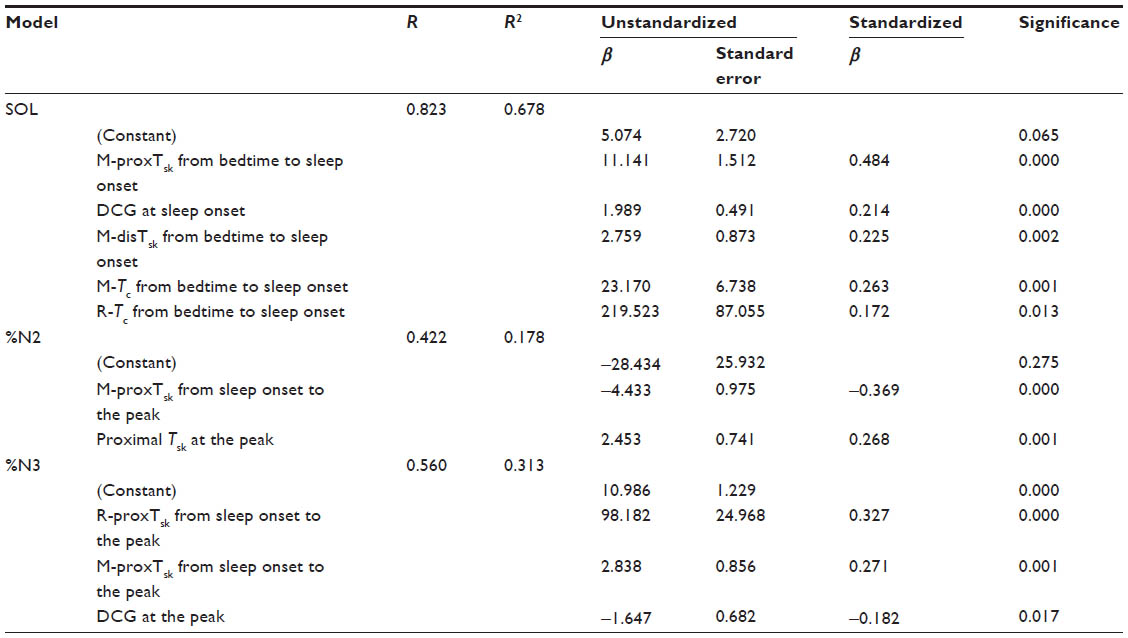 | Table 4 Body temperature predictors of SOL and sleep stages (%N2 and %N3) |
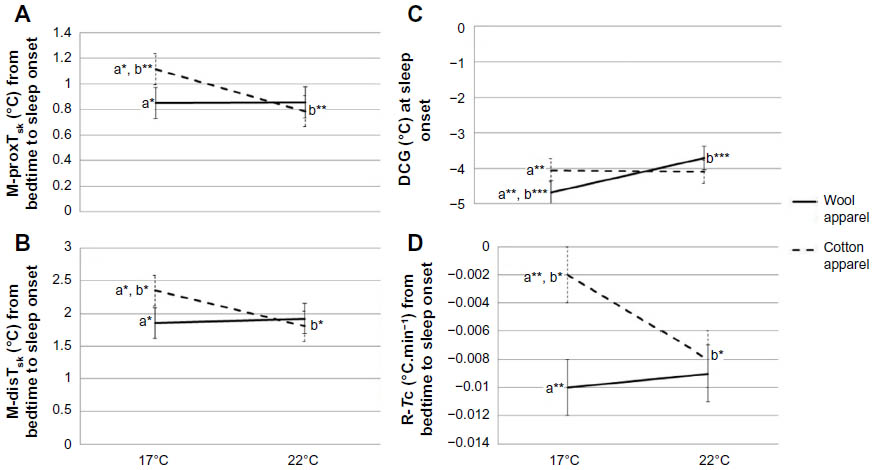 | Figure 3 Temperature predictors of sleep onset latency. The predictors are M-proxTsk (A), M-disTsk (B), DCG (C), R-Tc (D). |
The stepwise multiple regression analysis revealed that M-proxTsk from sleep onset to the peak and the proximal Tsk at the peak significantly predicted %N2 sleep (P<0.001), explaining 17.8% of the variance. Increase in M-proxTsk from sleep onset to the peak and decrease in proximal Tsk at the peak lowered the proportion of N2 (Table 4). The R-proxTsk and M-proxTsk from sleep onset to the peak and DCG at the peak predicted %N3 sleep and explained 31.3% of the variance, P<0.001 (Table 3). Increases in R-proxTsk and M-proxTsk from sleep onset to the peak but decrease in DCG at the peak predicted an increase in %N3. Post hoc analysis showed no significant findings that support the temperature predictors for %N2 and %N3.
Discussion
This study compared the effects of cotton and wool sleepwear, and polyester and wool bedding on sleep at 17°C and 22°C, at RH of 60%. The main effects for sleepwear showed that wool sleepwear significantly promoted sleep onset and showed a marginally significant increased TST and SE compared to cotton sleepwear. The main effects for Ta existed for sleep outcomes, but no main effects were observed for bedding types. There were several sleepwear × Ta interactions for SOL, %N2, and %N3 (Figure 2): 1) a significantly shorter SOL was observed for wool sleepwear compared to cotton at 17°C, but not at 22°C; 2) a significantly greater %N3 was observed for cotton than wool sleepwear at 22°C; 3) a significantly decreased %N2 but increased %N3 was observed for wool sleepwear at 17°C when compared to 22°C. The thermal sensation at bedtime revealed that participants felt significantly colder at 17°C than at 22°C. The skin and core temperature data strongly supported the earlier sleep findings, with the temperature variables explaining 67.8% of the variance in SOL, 31.8% in %N3, and 17.8% in %N2. These findings were inconsistent with a previous study that showed no significant observed differences in sleep variables at an ambient range of 13°C–23°C.23 However, this comparison may not be appropriate since their sleepwear and covering ensemble differed from this study, and differences in fabric properties would influence thermal comfort and hence sleep outcomes.
Our regression analysis indicated that M-proxTsk from bedtime to sleep onset was a strong predictor of SOL (Table 3; Figure 3) suggesting that a smaller M-proxTsk with wool sleepwear reflected lesser skin warming; hence, shorter SOL with wool than cotton sleepwear at 17°C. These data are consistent with a previous study on healthy young participants that showed subtle warming of the proximal skin in the comfortable range, using a thermosuit, decreased SOL, although manipulation of distal skin temperature was not effective.22 However, our findings are not comparable to their study since they conducted a multiple sleep latency test during the day where Tsk was lower, whereas our study was conducted during the night where Tsk was higher. The same research team also manipulated skin temperature during the night but did not report SOL.24 Additionally, the shorter SOL observed with wool at 17°C was in keeping with the greater rate of decline in Tc (Table 3; Figure 3) and in line with the existing literature demonstrating that sleep was initiated during the decline in Tc.25 Literature showed that heat dissipation through distal regions, that is, increase in distal Tsk precedes Tc drop.1 Indeed, we observed increases in distal Tsk, where its magnitude was smaller along with a lower DCG for wool compared to cotton sleepwear, suggesting a greater ease of sleep onset.
While sleeping in wool was linked to a shorter sleep onset at 17°C, at the higher Ta of 22°C, sleeping in cotton produced a higher %N3. When Ta conditions were considered, sleeping in wool sleepwear significantly increased %N3 and decreased %N2 at 17°C compared to 22°C, suggesting that sleeping in wool promoted better quality of sleep at the cooler temperature. These findings are supported by the stepwise multiple regression, in that the increase in M-proxTsk from sleep onset to the peak predicted the increase in %N3 and decrease in %N2 (Table 3). A previous study also showed that proximal skin warming significantly suppressed wakefulness and enhanced SWS (slow-wave sleep) in young and elderly healthy subjects and those with insomnia.24 However, according to the post hoc analysis, there were no significant findings on M-proxTsk to support the increased %N3.
The mechanisms that explain why wool sleepwear promoted faster sleep onset and deeper sleep than cotton sleepwear at 17°C, but cotton sleepwear promoted deeper sleep than wool at 22°C are not immediately apparent. However, thermal resistance may explain these differences particularly when sleepwear was closely matched for mass and thickness. Given that wool has significantly higher thermal resistance than cotton (Table 1), wool would be expected to insulate better than cotton resulting in less heat flow between skin and wool. This finding is further supported by the smaller increases in distal and proximal Tsk from bedtime to sleep onset for wool compared to cotton (Figure 3A and B). However, we cannot verify this mechanism as the microclimate temperature or humidity between skin and sleepwear and between sleepwear and bedding was not measured. Notably, the bed microclimate between sleepwear and bedcover around the middle part of the body was known to be thermally comfortable when the temperature ranged between 31.1°C and 31.6°C.26
A temperature effect was also observed where the lower Ta condition of 17°C increased %N1, %N3, and %REM sleep compared to 22°C, irrespective of sleepwear or bedding type. Published literature reported a reduction in REM sleep duration in cold or warm exposure,5,27 but the amount of REM sleep reached a maximum in the thermoneutral zone.28 Given the fact that %N3 and REM sleep were higher at 17°C, the slightly cooler Ta would be more desirable for sleep when bedding and sleepwear were used.
We observed no bedding effect despite a slightly unmatched bedding type with respect to thickness and thermal resistance. Wool bedding was thinner than polyester bedding but with a higher thermal resistance, which was similar to the findings for sleepwear. It is possible that the thermal insulation provided by wool fibers could be explained by the structure and composition of the wool (the crimped nature, fabric construction, and fiber conductivity).11,12,29 It is generally accepted that thermal resistance is directly correlated to fabric thickness. However, it should be emphasized that neither standard thickness nor thermal resistance tests (eg, AS2001 and ISO11092) have been developed to cater for composite, high-bulk materials bedding that are of highly variable thickness due to incorporation of patterned quilting. In fact, the measured thickness of the polyester bedding varied from 8.3 mm to 27.2 mm for the ten individual readings taken. This variation in thickness not only casts doubt on the reliability of the average as an indication of the “effective” thickness of the bedding but also introduces a major source of variation to its corresponding thermal resistance.
A number of limitations are considered. The microclimate temperature and RH between the skin surface and fabric were not recorded. It is possible that they may elucidate the mechanisms that underlie the observed sleep and skin and core temperature changes. Future studies are encouraged to incorporate these measurements. In addition, the variable results among test specimens for the thickness and, to a lesser extent, the thermal resistance tests of the bedding have highlighted the need for further development in the test methods for composite textile materials such as bedding that have variable thickness within their structure caused by quilting patterns. Although participants were asked about their whole body thermal sensation prior to bedtime and on waking, the local thermal sensations of different body regions were not assessed. Furthermore, participants’ body movements during sleep that may affect their skin temperatures could not be recorded due to unavailability of infrared video cameras. Participants may respond more positively in sleep testing for the fabric used in their daily sleepwear. Thus, the fabric of the sleepwear usually worn may be confounding and should be investigated in future studies.
Conclusion
In summary, hypothesis 1 was partially supported in that at 17°C sleeping in wool promoted a greater ease of sleep onset than in cotton, whereas at 22°C sleeping in cotton promoted greater increase in %N3 than in wool. Considering Ta conditions, greater %N3 and lesser %N2 were observed with wool sleepwear at 17°C than at 22°C. There were no bedding effects on sleep. Our findings confirmed hypothesis 2 that lower temperature condition (17°C) was more conducive to sleep. Importantly, skin and core temperature variables that significantly predicted SOL, %N2, and %N3 supported these sleep findings. These findings highlight wool, next to the skin, as an efficient insulator that may influence skin warming and hence promote sleep onset and sleep quality at the lower temperature. These outcomes emphasize the importance of optimizing sleepwear with seasonal changes. Further clinical efficacy trials of wool and cotton sleepwear in providing thermal insulation and comfort will be needed in individuals such as older adults, who have low basal metabolic rate and muscle mass, and shift workers, who experience a circadian timed low nocturnal core temperature and cold sensation during the night shift. Future challenges include how one might “optimize” thermal comfort for sleep, given that the sleeping microclimate is directly influenced by not only the sleepwear but also the variable heat produced by the sleeping subject.
Acknowledgments
The authors thank Australian Wool Innovation Ltd (AWI) for financial support for the project that yielded material discussed in this article.
Author contributions
MS collected the data and MS, MH, and CMC analyzed the data. All authors contributed toward data analysis, drafting and revising the paper and agree to be accountable for all aspects of the work.
Disclosure
CMC received research funding and MS received a research scholarship from Australian Wool Innovation Ltd (AWI) for a project that yielded material discussed in this manuscript. PS is a General Manager and AI is a program manager of AWI. MH reports no conflicts of interest in this work.
References
Krauchi K, Cajochen C, Werth E, Wirz-Justice A. Functional link between distal vasodilation and sleep-onset latency? Am J Physiol Regul Integr Comp Physiol. 2000;278(3):R741–R748. | |
Krauchi K, Wirz-Justice A. Circadian rhythm of heat production, heart rate, and skin and core temperature under unmasking conditions in men. Am J Physiol. 1994;267:R819–R826. | |
van Marken Lichtenbelt WD, Daanen HAM, Wouters L, et al. Evaluation of wireless determination of skin temperature using iButtons. Physiol Behav. 2006;88:489–497. | |
Okamoto-Mizuno K, Mizuno K. Effects of thermal environment on sleep and circadian rhythm. J Physiol Anthropol. 2012;31:14. | |
Haskell EH, Palca JW, Walker JM, Berger RJ, Heller HC. The effects of high and low ambient temperatures on human sleep stages. Electroencephalogr Clin Neurophysiol. 1981;51:494–501. | |
Muzet A, Libert JP, Candas V. Ambient temperature and human sleep. Cell Mol Life Sci. 1984;40:425–429. | |
Okamoto-Mizuno K, Tsuzuki K, Mizuno K, Ohshiro Y. Effects of low ambient temperature on heart rate variability during sleep in humans. Eur J Appl Physiol. 2009;105:191–197. | |
Karacan I, Thornby J, Anch A, Williams RL, Perkins HM. Effects of high ambient temperature on sleep in young men. Aviat Space Environ Med. 1978;49(7):855–860. | |
Sewitch DE, Kittrell EMW, Kupfer DJ, Reynolds CF 3rd. Body temperature and sleep architecture in response to a mild cold stress in women. Physiol Behav. 1986;36:951–957. | |
Lin Z, Deng S. A study on the thermal comfort in sleeping environments in the subtropics – developing a thermal comfort model for sleeping environments. Build Environ. 2008;43:70–81. | |
Holmer I. Heat exchange and thermal insulation compared in woollen and nylon garments during wear trials. Text Res J. 1985;55:511–518. | |
Holcombe BV, Hoschke BN. Dry heat transfer characteristics of underwear fabrics. Text Res J. 1983;53:368–374. | |
Morton WE, Hearle JWS. Physical Properties of Textile Fibres. Manchester: Textile Institute; 1986. | |
Li Y, Holcombe BV, Apcar F. Moisture buffering behavior of hygroscopic fabric during wear. Text Res J. 1992;62(11):619–627. | |
Ha M, Tokura H, Yamashita Y. Effect of two kinds of clothing made from hydrophobic and hydrophilic fabrics on local sweating rates at an ambient temperature of 37°C. Ergonomics. 1995;38:1445–1455. | |
Dickson PR. Effect of a fleecy woollen underlay on sleep. Med J Aust. 1984;140(2):87–89. | |
Copsey SM, Palin MJ, Thomas NT, Scott R. An ergonomic comparison of wool and polyester-filled quilts. Paper presented at: The 7th International Wool Textile Research Conference; 1985; Tokyo, Japan. | |
Umbach KH. Comparative thermophysiological tests on blankets made from wool and acrylic-fibre-cotton blends. J Text Inst. 1986; 77(3):212–222. | |
Lin Z, Deng S. A study on the thermal comfort in sleeping environments in the subtropics – measuring the total insulation values for the bedding systems commonly used in the subtropics. Build Environ. 2008;43:905–916. | |
Baker FC, Driver HS. Circadian rhythms, sleep, and the menstrual cycle. Sleep Med. 2007;8:613–622. | |
Iber C, Ancoli-Israel S, Chesson A, Quan SF. The AASM Manual for the Scoring of Sleep and Associated Events: Rules, Terminology, and Technical Specification. 1st ed. Darien, IL: American Academy of Sleep Medicine; 2007. | |
Raymann RJEM, Swaab DF, Van Someren EJW. Cutaneous warming promotes sleep onset. Am J Physiol Regul Integr Comp Physiol. 2005; 288:R1589–R1597. | |
Candas V, Libert JP, Vogt JJ, Ehrhart J, Muzet A. Body temperature during sleep under different thermal conditions. In: Fanger PO, Valbjorn O, editors. Indoor Climate: Effect on Human Comfort, Performance and Health. Copenhagen: Danish Building Research Institute; 1979:763–775. | |
Raymann RJEM, Swaab DF, Van Someren EJW. Skin deep: enhanced sleep depth by cutaneous temperature manipulation. Brain. 2008;131:500–513. | |
Van Someren EJW. Mechanisms and functions of coupling between sleep and temperature rhythms. Prog Brain Res. 2006;153:309–324. | |
Gieremek K, Ciesla W. Natural wool fabrics in physiotherapy. In: Bettany-Saltikov J, editor. Physical Therapy Perspectives in the 21st Century – Challenges and Possibilities. Croatia: InTech; 2012:398. | |
Zhang P, Gong RH, Yanai Y, Tokura H. Influence of clothing material properties on rectal temperature in different environments. Int J Cloth Sci Tech. 2002;14(5):299–306. | |
Zhang P, Gong RH, Yanai Y, Tokura H. Effects of clothing material on thermoregulatory responses. Text Res J. 2002;72(1):83–89. | |
Song C, Liu Y, Zhou X, Wang X, Li J, Liu J. Temperature field of bed climate and thermal comfort assessment based on local thermal sensations. Build Environ. 2016;95:381–390. | |
Haskell EH, Palca JW, Walker JM, Berger RJ, Heller HC. Metabolism and thermoregulation during stages of sleep in humans exposed to heat and cold. J Appl Physiol Respir Environ Exerc Physiol. 1981; 51(4):948–954. | |
Libert J-P, Bach V. Thermoregulation and sleep in the human. In: Parmeggiani PL, Velluti RA, editors. The Physiologic Nature of Sleep. Hackensack, NJ: Imperial College Press; 2005:407–431. | |
Gonzalez RR. Biophysics of heat exchange and clothing: applications to sports physiology. Med Exerc Nutr Health. 1995;4:290–305. |
Supplementary materials
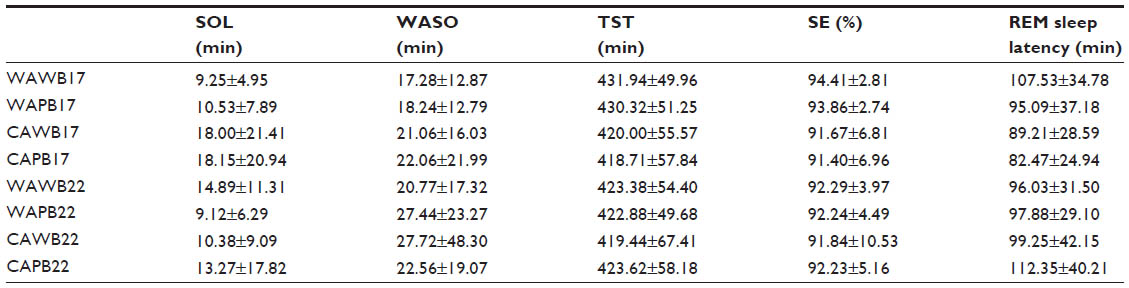 | Table S1 Average sleep parameters for each condition (mean ± SD) |
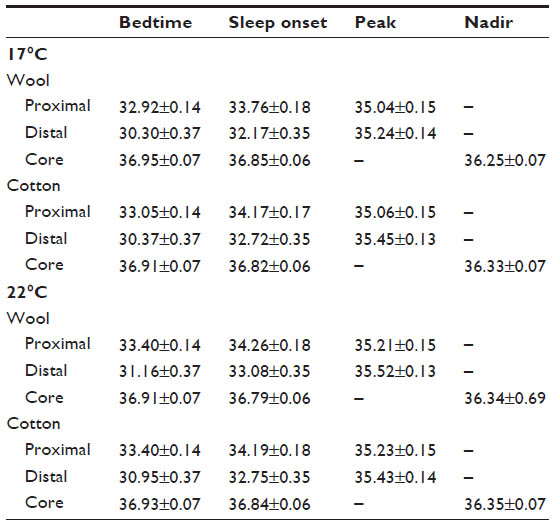 | Table S2 Proximal and distal skin temperature and core body temperature at bedtime, sleep onset, its peak, and nadir |
 © 2016 The Author(s). This work is published and licensed by Dove Medical Press Limited. The full terms of this license are available at https://www.dovepress.com/terms.php and incorporate the Creative Commons Attribution - Non Commercial (unported, v3.0) License.
By accessing the work you hereby accept the Terms. Non-commercial uses of the work are permitted without any further permission from Dove Medical Press Limited, provided the work is properly attributed. For permission for commercial use of this work, please see paragraphs 4.2 and 5 of our Terms.
© 2016 The Author(s). This work is published and licensed by Dove Medical Press Limited. The full terms of this license are available at https://www.dovepress.com/terms.php and incorporate the Creative Commons Attribution - Non Commercial (unported, v3.0) License.
By accessing the work you hereby accept the Terms. Non-commercial uses of the work are permitted without any further permission from Dove Medical Press Limited, provided the work is properly attributed. For permission for commercial use of this work, please see paragraphs 4.2 and 5 of our Terms.