")
Back to Journals » Clinical Interventions in Aging » Volume 18
Triglyceride Glucose Index is Strongly Associated with a Fragility Fracture in Postmenopausal Elderly Females with Type 2 Diabetes Mellitus Combined with Osteoporosis: A 6-Year Follow-Up Study
Authors Pan J, Huang X, Wang Q, Sun J, Zhai Z, Mo J , Huang J, Lu W
Received 6 August 2023
Accepted for publication 5 November 2023
Published 9 November 2023 Volume 2023:18 Pages 1841—1849
DOI https://doi.org/10.2147/CIA.S434194
Checked for plagiarism Yes
Review by Single anonymous peer review
Peer reviewer comments 3
Editor who approved publication: Prof. Dr. Nandu Goswami
Jiangmei Pan,1,2,* Xiuxian Huang,1,* Qiu Wang,1,* Jingxia Sun,1,* Zhenwei Zhai,1,* Jiacheng Mo,3 Jianhao Huang,1 Wensheng Lu1
1Department of Endocrinology and Metabolism, Guangxi Academy of Medical Sciences and the People’s Hospital of Guangxi Zhuang Autonomous Region, Nanning, Guangxi, 530021, People’s Republic of China; 2Youjiang Medical University for Nationalities, Baise, Guangxi, 533000, People’s Republic of China; 3Information Network Center of Guangxi Academy of Medical Sciences and the People’s Hospital of Guangxi Zhuang Autonomous Region, Nanning, Guangxi, 530021, People’s Republic of China
*These authors contributed equally to this work
Correspondence: Wensheng Lu, Email [email protected]
Purpose: The triglyceride glucose (TyG) index serves as an indicator of insulin resistance (IR), which is also associated with bone metabolism. However, research on the relationship between the TyG index and a fragility fracture in individuals with type 2 diabetes mellitus (T2DM) or osteoporosis (OP) remains sparse. This study aims to explore the association between the TyG index and fragility fracture risk in postmenopausal elderly females with T2DM combined with OP based on an ambispective cohort study.
Patients and Methods: A total of 220 postmenopausal women hospitalized with T2DM combined with OP between January 2015 and December 2020 were eligible for inclusion in this study. All participants were followed up every 6 months for 6 years with a median of 42 months. According to the tertiles of the TyG index, participants were divided into three groups: low-level (≤ 8.79, n =73), moderate-level (8.80– 9.32, n=73), and high-level (≥ 9.33, n=74). The association between the TyG index and fragility fracture risk was then assessed.
Results: Out of 220 patients, 46 experienced fragility fracture events (20.9%). Multivariate Cox regression analysis showed that the TyG index was positively associated with a fragility fracture in postmenopausal women with T2DM combined with OP. Furthermore, compared to the low-level group, with the TyG index level increase by 1.0, the risk for fragility fracture increased 1.293-fold in the high-level group (HR=2.293, 95% CI=1.007– 5.221, P < 0.05). Kaplan-Meier survival analysis indicated that fragility fractures were more likely to occur in patients with high levels of TyG index (log-rank, all P < 0.05).
Conclusion: Our study showed that the TyG index was strongly associated with a fragility fracture in postmenopausal women with T2DM combined with OP. Therefore, special attention should be paid to postmenopausal elderly females with T2DM combined with OP in routine clinical practice.
Keywords: type 2 diabetes mellitus, osteoporosis, triglyceride glucose index, fragility fracture
Introduction
Globally, the quickly climbing prevalence of diabetes has brought stern challenges, of which 96% are from T2DM.1 In China, the prevalence of T2DM is as high as 12.8%.2 OP is a systemic metabolic bone disease characterized by decreased bone mass and destruction of bone microstructure, causing increased bone fragility and susceptibility to fracture.3 OP has been regarded as one of the metabolic disorder outcomes of T2DM. The prevalence of OP was 10.6% in the general population and 16.9% in diabetic patients, according to a large-scale cross-sectional population survey conducted in China.4 Several studies indicated that compared to non-diabetic individuals, patients with T2DM had a 66% greater risk of fracture.5 Fragility fracture, characterized by increased morbidity, disability, and mortality, is a severe clinical adverse event in patients with T2DM accompanying OP,6 which gravely impaired the quality of life and put a heavy financial and mental burden on sufferers, especially in the elderly. Therefore, the topic discussed in this study is crucial for early identification and timely intervention of high-risk fracture populations to reduce fragility fracture events.
The gold standard for identifying insulin resistance is the hyperinsulinaemic-euglycaemic clamp (HIEC). This strategy is inappropriate for routine clinical practices due to its complexity and cost.7 The most frequently used alternative IR indicator is the homeostasis model assessment of IR (HOMA-IR). However, it is of limited use to those who are insulin-treated or whose beta-cells are dysfunctional. Latterly, it has been shown that the triglyceride glucose (TyG) index formulated by Ln [fasting triglycerides (mg/dL) × fasting blood glucose (mg/dL)/2] can accurately assess IR as an alternative indicator to HOMA-IR, a typical predictor of this condition.8,9 Previous studies showed that TyG index is associated with adverse cardiovascular outcomes, such as major adverse cardiovascular events (MACE), all-cause mortality,10 non-alcoholic fatty liver disease (MAFLD),11 subclinical left ventricular systolic dysfunction,12 and metabolic syndrome.13 Significant IR situations in patients with T2DM may impair bone mineral density (BMD).14 The risk of OP increases with the level of IR in female T2DM patients.15 TyG index measurements of the IR in postmenopausal female elderly and older non-diabetic men aged ≥ 50 showed a negative correlation with femoral neck BMD.16
However, rather than focusing on specific fracture risk populations, past research has typically found that the TyG index and bone metabolism are related to general and non-diabetes people. To date, no study has been found on the association of the TyG index with fragility fracture. This study aimed to explore the association between the TyG index and fragility fracture risk in the postmenopausal female elderly with T2DM combined with OP based on an ambispective cohort study for the first time.
Materials and Methods
Subjects
A total of 220 postmenopausal women hospitalized with T2DM combined with OP between January 2015 and December 2020 were eligible for inclusion in this study. All participants were followed up every 6 months for 6 years with a median of 42 months. According to the tertiles of the TyG index, participants were divided into three groups: low-level (≤ 8.79, n=73), moderate-level (8.80–9.32, n=73), and high-level (≥ 9.33, n=74). The inclusion criteria were as follows: (1) diabetes was diagnosed according to the 1999 World Health Organization (WHO) criteria;17 (2) OP was diagnosed according to the 2014 National Bone Health Alliance Working Group criteria.18,19 Exclusion criteria were as follows: (1) non-premenopausal women; (2) patients who have used oral hormone treatment or anti-OP medications for a long time (more than 6 months), both of which may impact bone metabolism; (3) individuals with chronic conditions that influence bone metabolism, such as aberrant thyroid function, rheumatoid arthritis, systemic lupus erythematosus, dry syndrome, malignant tumors, and other conditions that affect BMD; (4) patients with bedridden conditions, severe infections, severe heart failure, lung disease, and hepatorenal insufficiency; (5) lost to follow-up, missing hospitalization data, and a follow-up time of less than a year. All patients agreed to participate in this study and signed written informed consent. The Declaration of Helsinki’s principles were followed. The Guangxi Academy of Medical Sciences and Guangxi People’s Hospital’s Ethics Committee approved this trial’s conduct.
Data Collection
The data, which included demographic, anthropometric, laboratory biochemical indicators, and BMD based on hospitalization medical records, were collected and analyzed anonymously. Only data from the initial hospitalization were included for individuals with multiple hospital admissions over the study period. According to the tertiles of the TyG index, subjects were placed into three groups: low-level (≤ 8.79), moderate-level (8.80–9.32), and high-level (≥ 9.33). Information about a fragility fracture endpoint event was acquired through outpatient services, a review of hospitalization records, the WeChat app, and telephone interviews. Every six months for six years with a median of 42 months, all individuals were followed up.
Related Definitions
The relevant definitions in this study were as follows: (1) the endpoint event referred to a fragility fracture acquired through outpatient services, the WeChat app, and telephone interviews; (2) TyG index=Ln [fasting triglycerides (mg/dL) × fasting blood glucose (mg/dL)/2] was classified by low-level (≤ 8.79, n=73), moderate-level (8.80–9.32, n=73), and high-level (≥ 9.33, n=74); (3) BMD of lumbar vertebrae L1-4 and left femoral neck was measured by dual-energy X-ray absorptiometry, with classified by T values <− 2.5, − 2.5≤T≤− 1.0, and ≥ − 1.0 defined as OP, osteopenia, and average bone mass, respectively; (4) aged ≥ 60 defined as an elderly individual; (5) Population attributable risk percentage (PAR%) was calculated following the formula: PAR% = Pe (RR-1) / [Pe (RR-1) + 1]. Pe represents the percentage of the population with a given level of TyG index.
Statistical Analyses
The mean (±SD) was used to express variables with normal distributions, and the median (interquartile ranges) was used to express variables with non-normal distributions. Discontinuous variables are represented as frequencies. Normal distribution test using Shapiro Wilk method. The normal distribution continuous variable group comparison was tested using analysis of variance. In contrast, a non-normal distribution was tested using Kruskal Wallis H. Categorical variables were compared between groups using the Chi-squared test. The univariate Cox regression analysis was initially used to identify the risk factors for a fragility fracture endpoint event. Then the factors with P < 0.1 in the univariate analysis were enrolled into the multivariate Cox regression analysis. We used tolerance and variance inflation factors to detect multicollinearity between variables. If the tolerance is less than 0.1 or the variance inflation factor is greater than 10, it indicates the existence of collinearity. In this study, the tolerance was greater than 0.1, the variance inflation factor was less than 10. So, there was no multicollinearity between variables. Then, three multivariate regression models were built and used to gradually adjust for potential confounding factors for a fragility fracture endpoint event. The model I was adjusted for none. Model II was additionally adjusted for age and duration of diabetes with Model I. Model III was further adjusted for hypertension, BMI, TC, and fracture history with Model II. Kaplan-Meier survival curve analysis and Log rank test were used to evaluate the fragility fracture risk in patients with T2DM combined with OP. The statistical package SPSS 26.0 was used to conduct the data analysis. P < 0.05 was adopted as the statistical significance level.
Results
Baseline Characteristics
The baseline characteristics are shown in Table 1. A total of 220 patients with T2DM combined with OP were enrolled in this study. The average age was 73 years old (67.25, 77.00). Among them, 73 individuals (33.18%) had a low-level TyG index (≤ 8.79), 73 (33.18%) with moderate-level TyG index (8.80–9.32), and 74 (33.64%) with high-level TyG index (≥ 9.33). There were no significant differences in age, gender, duration of diabetes, hypertension, fracture history, body mass index (BMI), serum albumin (ALB), creatinine (Cr), uric acid (UA), lumbar spine bone mineral density (LS BMD), femoral neck bone mineral density (FN BMD), total hip bone mineral density (TH BMD), fracture risk assessment for major fracture (FRAX MOF), and fracture risk assessment for hip fracture (FRAX HF) (all P > 0.05). However, the three groups had significant differences in fasting blood glucose (FPG), total cholesterol (TC), triglycerides (TG), high-density lipoprotein cholesterol (HDL-C), low-density lipoprotein cholesterol (LDL-C), TyG index, glycated haemoglobin (HbA1c), haemoglobin (Hb), calcium (Ca), and alkaline phosphatase (ALP) (all P < 0.05).
 |
Table 1 Baseline Characteristics of the Subjects |
Cox Proportional Hazard Models for Fragility Fracture Risk
The effects of the TyG index on the fragility fracture risk are shown in Table 2. According to the tertiles of the TyG index, participants were divided into three groups: low-level (≤ 8.79, n=73), moderate-level (8.80–9.32, n=73), and high-level (≥ 9.33, n=74). All participants were followed up every 6 months for 6 years with a median of 42 months. During the follow-up period, out of 220 patients, 46 experienced fragility fracture events (20.9%). A univariate Cox regression analysis was conducted to identify the factors influencing participant fragility fracture. Next, variables with P<0.1 in univariate Cox regression analysis were included in multivariate Cox regression. In model I (unadjusted), the TyG index was positively correlated with fragility fracture (HR=1.769, 95% CI=1.200–2.607, P=0.004). Model II (Model I with adjusted for age and duration of diabetes) (HR=1.999, 95% CI=1.312–3.045, P=0.001) and model III (Model II with adjusted for hypertension, BMI, TC, and fracture history) (HR=1.636, 95% CI=1.042–2.570, P=0.033) also demonstrated a positive correlation between the TyG index and fragility fracture, respectively. The TyG index was changed into a categorical variable according to the three quantiles, and sensitivity analysis and trend test were used to assess the risk of fragility fracture. Similarly, model I (HR=2.880; 95% CI=1.316–6.303; P=0.008), model II (HR=3.155; 95% CI=1.434–6.943; P=0.004), and model III (HR=2.293; 95% CI=1.007–5.221; P=0.048) showed that the higher the level of the TyG index, the higher the fragility fracture, respectively.
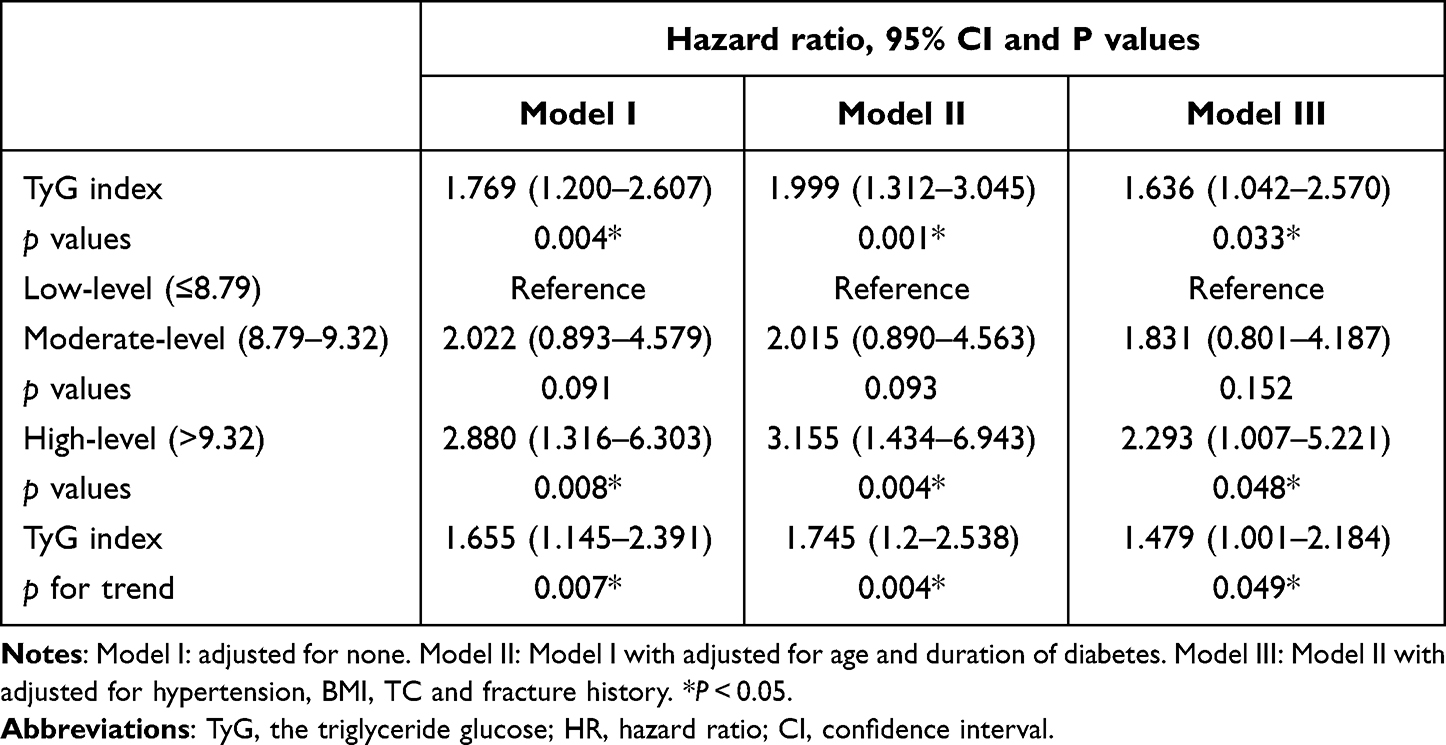 |
Table 2 Cox Regression Analysis Evaluating the Association of the TyG Index with the Fragility Fracture Risk in the Subjects |
TyG Index and Endpoint Events
The evaluation of the fragility fracture events in the three groups is shown in Figure 1. There was a dose-response relationship between the levels of TyG index and the incidence rates of fragility fracture (19.6%, 34.8%, and 45.6% for low-level TyG index, moderate-level TyG index, and high-level TyG index, respectively, all P for trend < 0.01). Additionally, the population-attributable risk percentage (PAR%) analysis indicated that 10.71% of the fragility fracture endpoint events could be attributed to the high-level TyG index (Table 3). The Kaplan-Meier survival curve analysis revealed that compared to the low-level TyG index, the moderate-level and high-level TyG indexes were associated positively with the high risk of fragility fracture in patients with T2DM combined with OP (log-rank, all P < 0.05) (Figure 2).
 |
Table 3 The Population Attributable Risk Percentage (PAR%) Analysis Evaluating TyG Index Contribution Rate to Fragility Fracture Endpoint Events |
 |
Figure 1 Comparison of the fragility fracture rate in the three groups. The incidence rates of fragility fracture were related to the levels of the TyG index in a dose-response fashion (fragility fracture: 19.6%, 34.8%, and 45.6% for low-level, moderate-level, and high-level of the TyG index, respectively; all P for trend < 0.01). |
 |
Figure 2 Cumulative incidence of fragility fracture by TyG index level. Kaplan-Meier analysis showed a significant positive association between the TyG index and the incidence rates of fragility fracture (log-rank, all P < 0.05). |
Discussion
With the aging of the social population, T2DM combined with OP has snowballed in prevalence year by year. Fragility fractures are more common in patients with T2DM combined with OP than in other general populations.20 Fragility fracture, characterized by increased morbidity, disability, and mortality, is a severe clinical adverse event in patients with T2DM accompanying OP,6 which gravely impaired the quality of life and put a heavy financial and mental burden on sufferers, especially in the elderly. To date, research on the relationship between the TyG index and a fragility fracture in individuals with T2DM or OP remains sparse. This study aimed to explore the association between the TyG index and fragility fracture risk in postmenopausal elderly females with T2DM combined with OP for the first time based on an ambispective cohort study. Our study found that the higher the TyG index, the greater the risk of fragility fractures in postmenopausal elderly females with T2DM combined with OP.
T2DM is the most prevalent endocrine disease in clinical practice, with IR as its key pathological feature. Internal environmental problems and abnormalities in synthesizing and secretion of a wide range of cytokines also accompany it. These affect bone metabolism and cause bone loss and bone microstructure destruction.21 Numerous populations have been investigated to explore the association between IR and BMD, but the findings could have been more consistent overall. In a cross-sectional investigation of postmenopausal Tunisian women, HOMA-IR correlated positively with total hip and left femur BMD.22 According to a study, an increase in HOMA-IR levels was linked to an increase in BMD, including 7170 people from the United States.23 Nicola et al.24 Showed that more significant IR is associated with higher BMD in non-diabetic older adults.
In contrast to the relationship between T2DM and fragility fracture risk, they did not find consistent evidence that more significant IR is associated with increased fracture risk after adjustment for BMI and BMD. Independent of body composition considerations, the increase in IR during the pubertal years may be a significant detrimental impact on the accretion of LS BMD.25 Additionally, the study discovered that the TyG index has a more significant impact on determining IR related to bone metabolism than HOMA-IR.16 According to a cross-sectional study conducted in China, women with Type 2 diabetes who have higher levels of insulin resistance have a higher chance of developing OP. The two, however, do not necessarily go together.15 These contradictory findings could result from various study populations and IR measurement techniques.
Recent research has demonstrated that chronic subclinical inflammation underlies IR.26 Along with playing a role in the development and progression of diabetes, chronic inflammation plays a vital role in the pathogenesis of osteoporosis. By influencing the remodeling cycle, boosting bone resorption, and reducing bone production, inflammation causes bone loss.27 Hip fracture risk was higher in older women with elevated levels of inflammatory markers.28 Evidence shows reduced skeletal muscle mass and strength29,30 are fall risk factors for IR. IR raises the risk of fracture by raising the likelihood of falling. Gao Y et al’s study31 of 80 elderly T2DM patients also revealed a negative connection between serum vitamin D and HOMA-IR. Serum vitamin D stimulates osteoblasts to promote bone formation, inhibiting osteoclast apoptosis and promoting osteoclast precursor cell differentiation. These actions contribute to stable blood calcium and phosphorus concentrations and bone mineralization.
Additionally, skeletal fragility should be included in the list of type 2 diabetic complications according to a substantial body of research. Despite having normal bone mineral density (BMD), type 2 diabetes patients have an increased risk of fractures. Although the exact causes of skeletal fragility in diabetes are unknown, they are likely multifaceted and involve impacts of obesity, hyperglycemia, oxidative stress, and amassing of advanced glycation end products, which affect bone metabolism, structure, and strength. Clinicians should be aware that BMD assessments significantly underestimate the risk of fracture in individuals with type 2 diabetes. Although there is a lack of information regarding the best care of osteoporosis in individuals with type 2 diabetes, doctors should nevertheless adhere to the standards for postmenopausal osteoporosis in the absence of contrary evidence.32 In other words, there is an urgent clinical need for an indicator that can be combined with BMD to early warn postmenopausal women with type 2 diabetes fracture risk.
Given this, the relationship between HOMA-IR and BMD remains unclear. Anyway, in view of the cheapness and convenience of the TyG index, it is a general trend for the TyG index to replace HOMA-IR to evaluate the IR of diabetes patients. This study showed that during the follow-up period, out of 220 patients, 46 experienced fragility fracture events (20.9%). After adjusting for multiple variables, the TyG index was positively associated with a fragility fracture (HR=2.293;95% CI=1.007–5.221; P < 0.05) in postmenopausal women with T2DM combined with OP. Furthermore, compared to the low-level group, with the TyG index level increase by 1.0, the risk for fragility fracture increased 1.293-fold in the high-level group (HR=2.293, 95% CI=1.007–5.221, P =0.048) while the moderate-level group did not. We analyzed why the association between moderate-level TyG index and fragility fracture was insignificant in the current study. It may be that the high-level TyG index plays a crucial role in a fragility fracture event. The Kaplan-Meier survival analysis indicated that fragility fractures were more likely to occur in patients with high levels of TyG index (log-rank, all P < 0.05). Obviously, the TyG index is an ideal predictor of fragile fracture endpoint events in postmenopausal elderly females with T2DM combined with OP due to its convenience and affordability, even in grassroots hospitals. This result redemonstrated in full that the TyG index is a valuable biochemical indicator with potential predictive value for the fragility fracture prognosis of patients with T2DM combined with OP and has popularization and application value in clinical practice.
Limitations
There are still some limitations to this study. Firstly, the sample size is limited, and the follow-up time may not be adequate. Secondly, this study solely evaluated baseline TyG index values and ignored their variations over time. Thirdly, we did not account for additional confounding variables, including daily nutrition and physical exercise. Therefore, the conclusion of this study still needs to be confirmed by randomized, double-blind, multicenter, prospective longitudinal cohort studies; as we did before, the current ambispective longitudinal cohort study can continue to improve the conclusions of this study through long-term continuous follow-up.
Conclusion
The study showed that the TyG index was strongly associated with a fragility fracture in postmenopausal women with T2DM combined with OP. For the TyG index level to increase by 1.0, the risk for fragility fracture endpoint event increased 1.293-fold in the high-level TyG index situation. Therefore, special attention should be paid to postmenopausal elderly females with T2DM combined with OP because they have a higher TyG index level and risk of a fragility fracture than other general populations in routine clinical practice.
Ethics Statement
All patients agreed to participate in this study and signed written informed consent. The principles set forth in the Declaration of Helsinki were followed. The study design and data collection were approved by the Ethics Committee of the Guangxi Academy of Medical Sciences and Guangxi People’s Hospital.
Acknowledgments
We thank all participants for their contribution to the study. We thank the Bone Density Room of Endocrine Metabolism Department, Information Network Center, and Medical Record Department of Guangxi People’s Hospital for cooperating as partners.
Author Contributions
All authors made a significant contribution to the work reported, whether that is in the conception, study design, execution, acquisition of data, analysis and interpretation, or in all these areas; took part in drafting, revising or critically reviewing the article; gave final approval of the version to be published; have agreed on the journal to which the article has been submitted; and agree to be accountable for all aspects of the work.
Funding
The study was funded by the National Natural Science Foundation of China (82160052, 81560044, 30860113).
Disclosure
The authors report no conflicts of interest in this work.
References
1. GBD 2021 Diabetes Collaborators. Global, regional, and national burden of diabetes from 1990 to 2021, with projections of prevalence to 2050: a systematic analysis for the global burden of disease study 2021. Lancet. 2023;402(10397):203–234. doi:10.1016/S0140-6736(23)01301-6
2. Li Y, Teng D, Shi X, et al. Prevalence of diabetes recorded in mainland China using 2018 diagnostic criteria from the American Diabetes Association: national cross sectional study. BMJ. 2020;369:m997. doi:10.1136/bmj.m997
3. Compston JE, McClung MR, Leslie WD. Osteoporosis. Lancet. 2019;393(10169):364–376. doi:10.1016/S0140-6736(18)32112-3
4. Li Y, Zhao Z, Wang L, Fu Z, Ji L, Wu X. The prevalence of osteoporosis tested by quantitative computed tomography in patients with different glucose tolerances. J Clin Endocrinol Metab. 2020;105(1):dgz036. doi:10.1210/clinem/dgz036
5. Liao CC, Lin CS, Shih CC, et al. Increased risk of fracture and postfracture adverse events in patients with diabetes: two nationwide population-based retrospective cohort studies. Diabetes Care. 2014;37(8):2246–2252. doi:10.2337/dc17-er08c
6. Fukui T, Takahashi Y. Bone fragility in type 1 diabetes and type 2 diabetes. Clin Calcium. 2019;29(1):51–56.
7. Cersosimo E, Solis-Herrera C, Trautmann ME, Malloy J, Triplitt CL. Assessment of pancreatic β-cell function: review of methods and clinical applications. Curr Diabetes Rev. 2014;10(1):2–42. doi:10.2174/1573399810666140214093600
8. Simental-Mendía LE, Rodríguez-Morán M, Guerrero-Romero F. The product of fasting glucose and triglycerides as surrogate for identifying insulin resistance in apparently healthy subjects. Metab Syndr Relat Disord. 2008;6(4):299–304. doi:10.1089/met.2008.0034
9. Guerrero-Romero F, Simental-Mendía LE, González-Ortiz M, et al. The product of triglycerides and glucose, a simple measure of insulin sensitivity. Comparison with the euglycemic-hyperinsulinemic clamp. J Clin Endocrinol Metab. 2010;95(7):3347–3351. doi:10.1210/jc.2010-0288
10. Ma X, Dong L, Shao Q, et al. Triglyceride glucose index for predicting cardiovascular outcomes after percutaneous coronary intervention in patients with type 2 diabetes mellitus and acute coronary syndrome. Cardiovasc Diabetol. 2020;19(1):31. doi:10.1186/s12933-020-01006-7
11. Kitae A, Hashimoto Y, Hamaguchi M, Obora A, Kojima T, Fukui M. The triglyceride and glucose index is a predictor of incident nonalcoholic fatty liver disease: a population-based cohort study. Can J Gastroenterol Hepatol. 2019;2019:5121574. doi:10.1155/2019/5121574
12. Sun QC, Liu J, Meng R, et al. Association of the triglyceride-glucose index with subclinical left ventricular dysfunction in type 2 diabetes mellitus patients: a retrospective cross-sectional study. J Diabetes Investig. 2023;14(8):953–960. doi:10.1111/jdi.14026
13. Nabipoorashrafi SA, Seyedi SA, Rabizadeh S, et al. The accuracy of triglyceride-glucose (TyG) index for the screening of metabolic syndrome in adults: a systematic review and meta-analysis. Nutr Metab Cardiovasc Dis. 2022;32(12):2677–2688. doi:10.1016/j.numecd.2022.07.024
14. Arikan S, Tuzcu A, Bahceci M, Ozmen S, Gokalp D. Insulin resistance in type 2 diabetes mellitus may be related to bone mineral density. J Clin Densitom. 2012;15(2):186–190. doi:10.1016/j.jocd.2011.11.005
15. Wang X, Jiang L, Shao X. Association analysis of insulin resistance and osteoporosis risk in Chinese patients with T2DM. Ther Clin Risk Manag. 2021;17:909–916. doi:10.2147/TCRM.S328510
16. Yoon JH, Hong AR, Choi W, Park JY, Kim HK, Kang HC. Association of triglyceride-glucose index with bone mineral density in non-diabetic Koreans: KNHANES 2008–2011. Calcif Tissue Int. 2021;108(2):176–187. doi:10.1007/s00223-020-00761-9
17. Alberti KG, Zimmet PZ. Definition, diagnosis and classification of diabetes mellitus and its complications. Part 1: diagnosis and classification of diabetes mellitus provisional report of a WHO consultation. Diabet Med. 1998;15(7):539–553. doi:10.1002/(SICI)1096-9136(199807)15:7
18. Siris ES, Adler R, Bilezikian J, et al. The clinical diagnosis of osteoporosis: a position statement from the national bone health alliance working group. Osteoporos Int. 2014;25(5):1439–1443. doi:10.1007/s00198-014-2655-z
19. Kanis JA, Melton LJ, Christiansen C, Johnston CC, Khaltaev N. The diagnosis of osteoporosis. J Bone Miner Res. 1994;9(8):1137–1141. doi:10.1002/jbmr.5650090802
20. Rogmark C, Fedorowski A, Hamrefors V. Physical activity and psychosocial factors associated with risk of future fractures in middle-aged men and women. J Bone Miner Res. 2021;36(5):852–860. doi:10.1002/jbmr.4249
21. Heilmeier U, Patsch JM. Diabetes and Bone. Semin Musculoskelet Radiol. 2016;20(3):300–304. doi:10.1055/s-0036-1592366
22. Cherif R, Mahjoub F, Sahli H, et al. Positive association of obesity and insulin resistance with bone mineral density in tunisian postmenopausal women. J Clin Densitom. 2018;21(2):163–171. doi:10.1016/j.jocd.2017.05.015
23. Zhou H, Li C, Song W, et al. Increasing fasting glucose and fasting insulin associated with elevated bone mineral density-evidence from cross-sectional and MR studies. Osteoporos Int. 2021;32(6):1153–1164. doi:10.1007/s00198-020-05762-w
24. Napoli N, Conte C, Pedone C, et al. Effect of insulin resistance on BMD and fracture risk in older adults. J Clin Endocrinol Metab. 2019;104(8):3303–3310. doi:10.1210/jc.2018-02539
25. Mengel E, Tamme R, Remmel L, et al. Pubertal increment in insulin resistance is negatively related to lumbar bone mineral density in 18-year-old males. Osteoporos Int. 2023;34(1):161–170. doi:10.1007/s00198-022-06591-9
26. Matulewicz N, Karczewska-Kupczewska M. Insulin resistance and chronic inflammation. Postepy Hig Med Dosw. 2016;70(1):1245–1258.
27. Hardy R, Cooper MS. Bone loss in inflammatory disorders. J Endocrinol. 2009;201(3):309–320. doi:10.1677/JOE-08-0568
28. Barbour KE, Boudreau R, Danielson ME, et al. Inflammatory markers and the risk of hip fracture: the women’s health initiative. J Bone Miner Res. 2012;27(5):1167–1176. doi:10.1002/jbmr.1559
29. Lee SW, Youm Y, Lee WJ, et al. Appendicular skeletal muscle mass and insulin resistance in an elderly Korean population: the Korean social life, health and aging project-health examination cohort. Diabetes Metab J. 2015;39(1):37–45. doi:10.4093/dmj.2015.39.1.37
30. Barzilay JI, Cotsonis GA, Walston J, et al. Insulin resistance is associated with decreased quadriceps muscle strength in nondiabetic adults aged >or=70 years. Diabetes Care. 2009;32(4):736–738. doi:10.2337/dc08-1781
31. Gao Y, Chen Z, Ma Z. Vitamin D is positively associated with bone mineral density muscle mass and negatively with insulin resistance in senile diabetes mellitus. Dis Markers. 2022;2022:9231408. doi:10.1155/2022/9231408
32. Shanbhogue VV, Mitchell DM, Rosen CJ, Bouxsein ML. Type 2 diabetes and the skeleton: new insights into sweet bones. Lancet Diabetes Endocrinol. 2016;4(2):159–173. doi:10.1016/S2213-8587(15)00283-1
 © 2023 The Author(s). This work is published and licensed by Dove Medical Press Limited. The full terms of this license are available at https://www.dovepress.com/terms.php and incorporate the Creative Commons Attribution - Non Commercial (unported, v3.0) License.
By accessing the work you hereby accept the Terms. Non-commercial uses of the work are permitted without any further permission from Dove Medical Press Limited, provided the work is properly attributed. For permission for commercial use of this work, please see paragraphs 4.2 and 5 of our Terms.
© 2023 The Author(s). This work is published and licensed by Dove Medical Press Limited. The full terms of this license are available at https://www.dovepress.com/terms.php and incorporate the Creative Commons Attribution - Non Commercial (unported, v3.0) License.
By accessing the work you hereby accept the Terms. Non-commercial uses of the work are permitted without any further permission from Dove Medical Press Limited, provided the work is properly attributed. For permission for commercial use of this work, please see paragraphs 4.2 and 5 of our Terms.