")
Back to Journals » Veterinary Medicine: Research and Reports » Volume 7
Two-dimensional speckle-tracking echocardiographic assessment of left ventricular mechanical synchrony in clinically normal cats
Received 4 October 2015
Accepted for publication 19 January 2016
Published 23 March 2016 Volume 2016:7 Pages 33—40
DOI https://doi.org/10.2147/VMRR.S97634
Checked for plagiarism Yes
Review by Single anonymous peer review
Peer reviewer comments 2
Editor who approved publication: Professor Young Lyoo
Video abstract presented by Yueh-Lun Hsu
Views: 1865
Yueh-Lun Hsu, Hui-Pi Huang
Institute of Veterinary Clinical Science, Veterinary School, National Taiwan University, Taipei, Taiwan
Abstract: Ventricular heterogeneity and synchrony are associated with hypertrophic cardiomyopathy in humans. Hypertrophic cardiomyopathy is commonly observed in cats. The aim of this study was to determine the presence and normal range of left ventricular mechanical heterogeneity and synchrony in clinically healthy cats using two-dimensional speckle-tracking echocardiography. Thirty-four clinically healthy cats were included in this prospective study. Two-dimensional echocardiography and two-dimensional speckle-tracking echocardiography were performed on all cats. Echocardiographic parameters, including circumferential, radial, and longitudinal strain and strain rate, heterogeneity, and synchrony, were measured. Segmental heterogeneity values in the circumferential, radial, and longitudinal directions were 13.1%±5.9%, 19.1%±10.3%, and 15.4%±6.8%, respectively. Transmural heterogeneity was -14.3%±4.6% in the circumferential direction. Left ventricular synchrony values in the circumferential, radial, and longitudinal directions were 11.7±4.2, 16.5±13.4, and 19.4±8.5 ms, respectively. Interventricular synchrony was -3.9±13.2 ms. Left ventricular heterogeneity and synchrony were noted in clinically healthy cats; segmental heterogeneity, which is characterized as longitudinal, progressively increased from the apical to the basal segments, while transmural heterogeneity, which is characterized as circumferential, progressively decreased from the endocardium to the epicardium.
Keywords: feline, ventricular heterogeneity, synchrony
Introduction
Ventricular contraction normally occurs in a highly coordinated process. This nonuniform electromechanical activation in different areas of the myocardium is known as mechanical synchrony. Electromechanical activity typically spreads from the endocardium to the epicardium and from the apex to the base of the heart. In humans, electromechanical activity occurs simultaneously in all regions of the left ventricle (LV).1
A poorly synchronized LV exhibits regional differences in the amount of work that each cardiac muscle fiber performs.2 Fibers in early-activated regions contract against a lower pressure, whereas those in late-activated regions contract against a higher pressure. This condition ultimately leads to hypertrophy in late-activated regions, which exacerbates LV dysfunction and worsens the synchrony.3 In a recent study of human patients with hypertrophic cardiomyopathy (HCM), heterogeneity of LV myocardial properties resulted in delayed relaxation and significant regional heterogeneity in systolic synchronicity.4 Individuals with LV dyssynchrony-associated HCM may have an increased risk of sudden cardiac death. In fact, LV dyssynchrony is a powerful predictor of sudden cardiac death, and noninvasive assessment of such synchrony has gained increasing importance.4
HCM is the most common heart disease in cats.5 Studies regarding parameters of heterogeneity and inter-/intra-ventricular synchrony in cats are very limited. Lack of normal ranges of LV mechanical synchrony and segmental heterogeneity in cats has hindered investigations regarding the presence and significance of inter-/intra-ventricular mechanical synchrony in cat cardiovascular disease. Thus, an essential step in the assessment of these properties in cats with cardiomyopathy involves generating normal ranges for ventricular mechanical heterogeneity and synchrony.
Two-dimensional speckle-tracking echocardiography (2D-STE) is a noninvasive method for evaluating regional mechanical strain in the LV. This technique enables the investigator to quantify the parameters of LV heterogeneity and synchrony. We hypothesized that mechanical heterogeneity and synchrony may also be present in the LV of clinically healthy cats. The aim of this study was to determine the presence and normal ranges of LV mechanical heterogeneity and synchrony in clinically healthy cats using 2D-STE.
Materials and methods
Animals
Thirty-four client-owned cats admitted to the National Taiwan University Veterinary Hospital were included in this prospective study. All the cats were assessed as clinically healthy based on the history, physical examination, auscultation, blood pressure (BP) measurements, routine blood work (complete blood counts and biochemical profiles), chest radiographs, and 2D and M-mode echocardiography. Cats presenting with a history or clinical signs of respiratory, cardiac, or any systemic disease were excluded from the study. Cats presenting with cardiac murmurs during physical examination or exhibiting any abnormalities on chest radiography or conventional echocardiography were also excluded. All the clients provided oral informed consent, and the study was performed in accordance with the code of the Research Ethics Office of the National Taiwan University, following the best practice of veterinary care.
Systolic BP measurement
Systemic BP was measured by a Doppler flow detector (Model 811-B, Parks Medical Electronics Inc., Aloha, Oregon, USA) and a sphygmomanometer attached to an inflatable cuff (2.5–4 cm). The sphygmomanometer was wrapped around the middle part of the antebrachium and a Doppler probe coated with ultrasonic transmission gel was positioned over the palmar area to detect blood flow in the digitalis palmaris communis artery. To minimize procedural stress, all the cats were allowed to assume a comfortable position, with only gentle restraint by their owners. Each cat remained in the same position throughout the systemic BP measurement, and a series of five readings was obtained. These five readings were averaged to obtain a mean systemic BP value.
Conventional echocardiography
The ultrasound examinations were performed without sedation on gently restrained, laterally recumbent cats using an ultrasound unit equipped with a 5.5–7.5 MHz phased-array transducer (MyLabTM50 XVision, Esaote, Genova, Italy). General parameters derived from B-mode echocardiographic examinations included the LV diastolic dimension (LVDd), LV systolic dimension (LVSd), left atrium-to-aortic diameter ratio (LA/Ao), inter-ventricular septal thickness in diastole, and LV free wall thickness in diastole, which were obtained from the right parasternal short-axis view.6
The LV systolic function parameters derived from M-mode imaging from the right parasternal short-axis view included end-posterior E point to septal separation, percentage thickening of the inter-ventricular septum and LV free wall, and fractional shortening.6 Parameters of LV diastolic function derived from pulsed-wave Doppler imaging included mitral peak velocity of early (E) and late (A) diastolic inflow (MEVp, and MAVp, respectively), tricuspid peak velocity of early and late diastolic inflow (TEVp and TAVp, respectively), MEVp to MAVp ratio, TEVp to TAVp ratio, and isovolumic relaxation time. The myocardial performance index (or Tei index) was quantified by pulsed-wave Doppler in the left parasternal apical four chamber.7,8
Measurement of ventricular strain using 2D-STE
Next, a 2D-STE was performed using the same ultrasonographic unit as described in the above section “Conventional echocardiography”. The 2D-STE parameters included circumferential/radial/longitudinal peak systolic strain (CS/RS/LS), circumferential/radial/longitudinal peak systolic strain rate (CSR/RSR/LSR), circumferential/radial/longitudinal peak early diastolic strain rate (CSR−E/RSR−E/LSR−E), and circumferential/radial/longitudinal peak late diastolic strain rate (CSR−A/RSR−A/LSR−A).
Measurements of LV longitudinal strain and strain rate were obtained from the left parasternal apical view. Measurements of circumferential/radial strain and strain rate were obtained from the right parasternal short-axis view at the level of the papillary muscle. All the images were acquired in cine loops of three cardiac cycles recorded at a frame rate of 60–111 frames per second, saved in the digital format, and analyzed by offline software (XStrain™ software for MyLabTM50 XVision, Esaote SPA, Genoa, Italy). All the echocardiographic studies and off-line analyses described above were performed by the same investigator.
For quantification of the circumferential and radial strains and strain rates, six segments (anteroseptal, anterior, lateral, posterior, inferior, and septal; Figure 1) of the endocardium were semiautomatically selected by aided heart segmentation (AHS, MyLabTM50 XVision) for analysis. For quantification of the LV longitudinal strain and strain rate, six segments (basal septal, mid septal, apical septal, apical lateral, mid lateral, and basal lateral; Figure 2) of the endocardium were semiautomatically selected by the AHS tool for analysis. Global circumferential/radial/longitudinal peak systolic strain (CSg/RSg/LSg), systolic strain rate (CSRg/RSRg/LSRg), early diastolic strain rate (CSR−Eg/RSR−Eg/LSR−Eg), and late diastolic strain rate (CSR−Ag/RSR−Ag/LSR−Ag) were calculated by obtaining the average strain or strain rate of all the six segments in the circumferential, radial, and longitudinal directions, respectively. Images not providing adequate visualization of one or more segments of the endocardium were excluded.
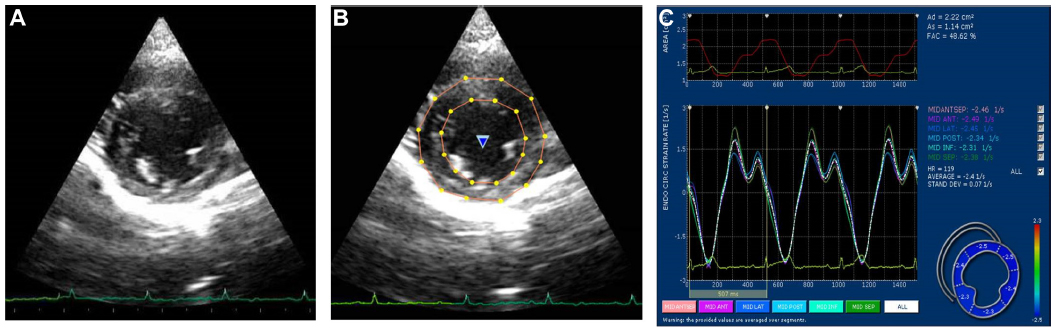 | Figure 1 Measurement of circumferential and radial strain and strain rate. |
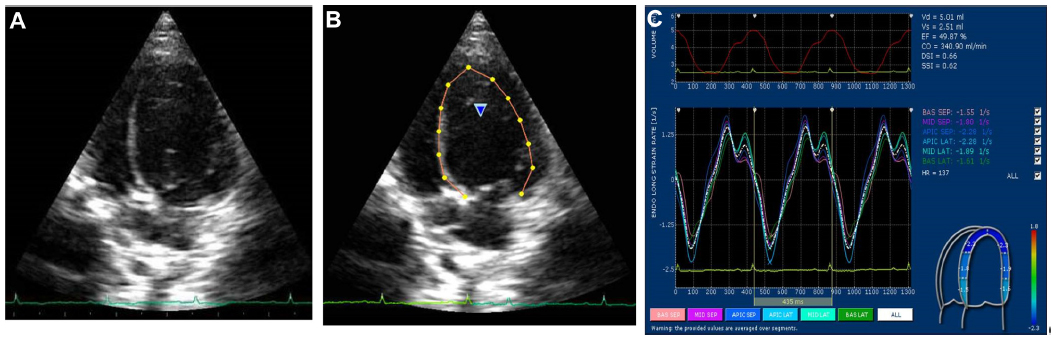 | Figure 2 Measurement of longitudinal strain and strain rate. |
Measurement of left ventricular heterogeneity and mechanical synchrony
Segmental heterogeneity (SH-ε), defined as the range of the peak strain of the six segments in the longitudinal (SH-lε), radial (SH-rε), and circumferential (SH-cε) directions (Figure 3), and transmural heterogeneity (TH-cε), defined as the difference in peak circumferential strain between the endocardium and epicardium, were calculated.9
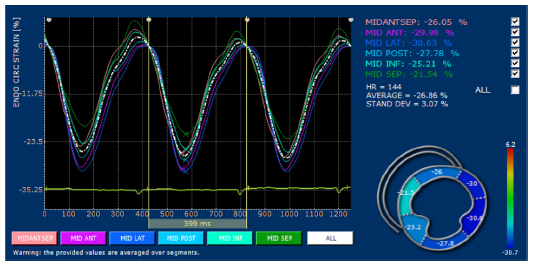 | Figure 3 An example of six segments of the left ventricle for measurement of segmental heterogeneity in the circumferential direction using two-dimensional speckle-tracking echocardiography obtained from the right parasternal short-axis view at the level of the papillary muscle. |
Inter-ventricular mechanical synchrony, defined as the time difference between the mean pulmonary and aortic pre-ejection time (QP-Ao), was calculated from conventional pulsed-wave Doppler data obtained from the right parasternal short-axis view (for measuring the pre-ejection time of pulmonary artery blood flow) and the left parasternal four-chamber view (for measuring the pre-ejection time of aortic blood flow).10 Intra-ventricular mechanical synchrony, defined as the range (RT-ε) and standard deviation of time required to reach peak strain (SDT-ε) in the longitudinal (RT-lε and SDT-lε), circumferential (RT-cε and SDT-cε), and radial (RT-rε and SDT-rε) directions (Figure 4).4,10
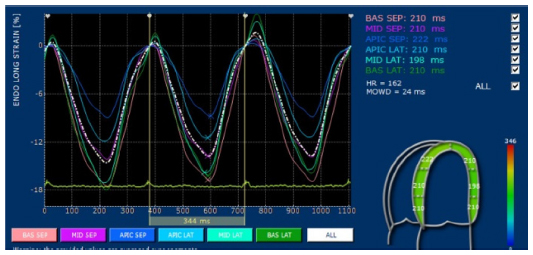 | Figure 4 An example of six segments of the left ventricle for measurement of intra-ventricular mechanical synchrony in the longitudinal direction using two-dimensional speckle-tracking echocardiography obtained from the left parasternal apical four-chamber view. |
Statistical analysis
All statistical analyses were performed with commercial statistics software SPSS version 16.0 (SPSS Inc., Chicago, IL, USA). Data are expressed as the mean ± standard deviation (SD). Comparisons of the systolic and diastolic strain and strain rate among the six segments were performed by one-way analysis of variance. The pairwise comparisons were made using the Scheffe’s method for post hoc analysis (if testing of homogeneity revealed equality of variances) or the Brown–Forsythe and Robust tests and the Games–Howell method for post hoc analysis (if testing of homogeneity did not reveal equality of variances). Spearman’s correlation was used to examine the linear association between continuous variables, and a two-tailed P-value ≤0.05 was considered statistically significant.
Measurement reliability
All the echocardiographic studies were performed by the same investigator. The intra-observer coefficient of variation (CV) was calculated from data obtained from three different examinations of each cat in one day by the same investigator. Five clinical healthy cats were included to assess the repeatability of the measurements in this study.
Results
Animals
The mean age of the 34 cats (18 males, 16 females) included in this study was 3.1±2.2 years (range: 16 months to 8 years), and the mean body weight was 4.3±1.3 kg. The represented breeds included 19 Domestic Shorthair, seven Persian, six American Shorthair, one Bengal, and one British Blue. The mean systemic BP was 119.5±15.5 mmHg. The mean systemic BP of each included cat was within the normal range of 90–130 mmHg.11 As presented in Table 1, the values of the 2D and M-mode echocardiographic parameters were within respective reference ranges.12,13
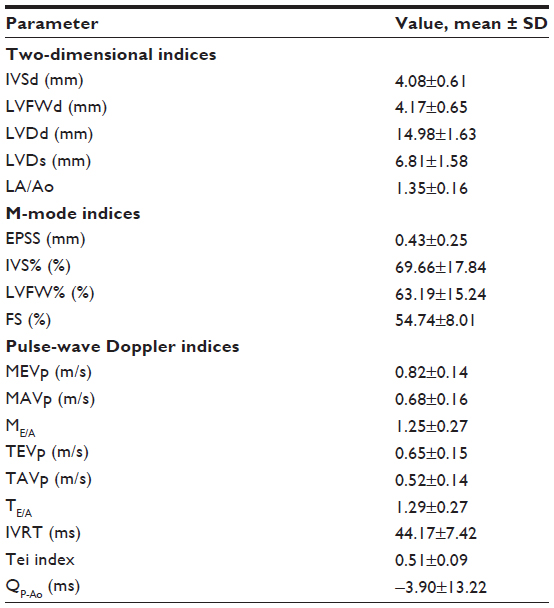 | Table 1 The descriptive statistics of two-dimensional and M-mode echocardiographic parameters of 34 clinically healthy cats |
Left ventricular strain and strain rate
Based on the myocardial motion vector, the circumferential and longitudinal systolic strain and strain rate values were negative, and the radial systolic strain and strain rate values were positive for all the cats (Table 2). In general, the circumferential, radial, and longitudinal strain and strain rate values were not affected by age, body weight, heart rate, or BP, except LSR−Eg, which was negatively correlated with heart rate (Spearman’s P=−0.591, P=0.020). CSg and RSg were reduced in males compared with females (P=0.015 and P=0.018, respectively).
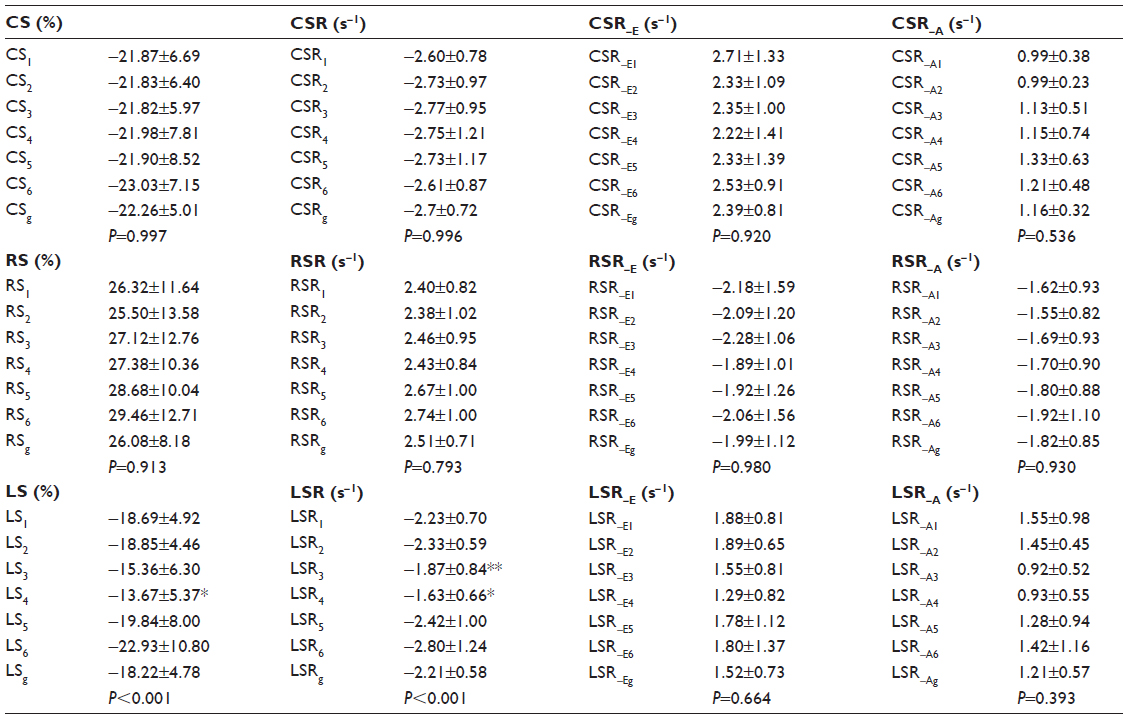 | Table 2 Segmental and global circumferential, radial, and longitudinal strain and strain rate values determined using two-dimensional speckle-tracking echocardiography of the left ventricle in 34 clinically healthy cats |
Description of ventricular heterogeneity and mechanical synchrony
LV heterogeneity was observed in this cohort of cats. SH-cε, SH-rε, and SH-lε were 13.1%±5.9%, 19.1%±10.3%, and 15.4%±6.8%, respectively (Table 3). SH-lε progressively increased from the apical to the basal segments. Transmural heterogeneity (TH-cε) was −14.3%±4.6% and progressively decreased from the endocardium to the epicardium. TH-cε was negatively correlated with body weight (P=−0.471, P=0.027). TH-cε was positively correlated with CSg (r=−0.817, P<0.001) and CSRg (r=−0.816, P<0.001).
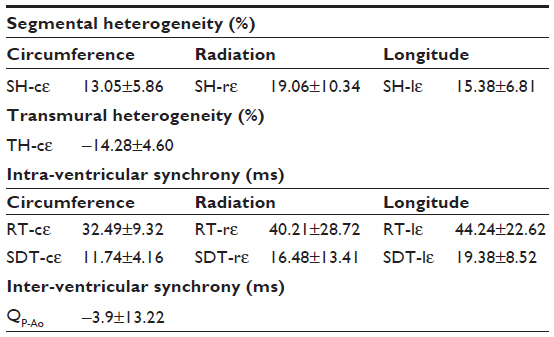 | Table 3 Echocardiographic parameters of left ventricular heterogeneity and synchrony in 34 clinically healthy cats |
In addition, LV mechanical synchrony was observed in all the three directions in this cohort of cats. As presented in Table 3, RT-cε, RT-rε, and RT-lε were 32.5±9.3, 40.2±28.7, and 44.2±22.6 ms, respectively. SDT-cε, SDT-rε, and SDT-lε were 11.7±4.2, 16.5±13.4, and 19.4±8.5 ms, respectively. These parameters of LV mechanical synchrony occurred independently of age, body weight, heart rate, or systemic BP, except SDT-lε, which was negatively correlated with heart rate (r=−0.433, P=0.044). QP-Ao was −3.9±13.2 ms.
Measurement reliability
The intra-observer CV values for the 2D-STE variables were all less than 20%, except RSR-Ag, for which the intra-observer CV value was 25.39% (Table 4).
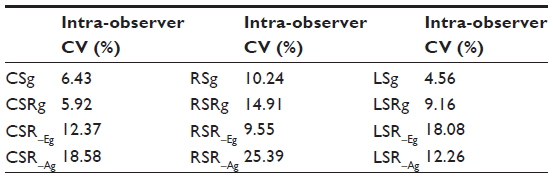 | Table 4 The intra-observer CV values derived from the parameters measured using two-dimensional speckle-tracking echocardiography |
Discussion
In this study, we found segmental and transmural heterogeneity in the LV of clinically healthy cats. Segmental heterogeneity was most prominent with respect to longitudinal strain, which progressively increased from the apical to the basal segment. This pattern of segmental heterogeneity in the longitudinal direction was similar to that observed in human subjects during systole.14 Clinically, human patients with HCM exhibit significantly reduced regional and global peak longitudinal systolic strain compared with controls and other forms of HCM, such as hypertensive HCM. While segmental heterogeneity in the longitudinal direction was increased in HCM compared with controls as well as those with hypertensive HCM.15 Differentiating various causes of HCM using conventional echocardiography can be challenging in cats. Evaluation of longitudinal segmental heterogeneity using 2D-STE can be a valuable tool for differentiating HCM of various etiologies in cats.
The circumferential strain, which is related to transmural heterogeneity, progressively decreased from the endocardium to the epicardium. The characteristics of transmural heterogeneity in cats are similar to those observed in human subjects.16 The difference of TH-cε between the endocardium and epicardium in this cohort was ~64% (TH-cε/CSg ×100%) in contrast to 36% in human subjects.14,16 In this study, TH-cε was positively correlated with global circumferential strain and strain rate. Circumferential strain is reduced in human patients with HCM.17,18 Even with apparently normal left ventricular systolic function in the early stage of the disease, circumferential strain is significantly reduced in HCM.1 A marked variation in segmental heterogeneity reflects a regional variation in the myocardial disarray and fibrosis that is characteristic of human HCM.17,19 A marked variation in transmural heterogeneity is also an indicator of increased left ventricular end-diastolic pressure in human patients with HCM. This phenomenon has not been observed in human patients with HCM associated with aortic stenosis.19 Application of circumferential strain and transmural heterogeneity is clinically important in differentiating HCM of different etiologies in human patients.17–19 The disarrangement of muscle fibers has also been reported in cats with HCM. A disruption of the myocardial macrostructure may result in reduced cardiac pumping efficacy.20 Collectively, decreased global circumferential strain along with increased variation of transmural or segmental heterogeneity can be anticipated in cats with HCM. The evaluation of transmural or segmental heterogeneity may play an important role in determining the timing of medication. Further studies of transmural and segmental heterogeneity in cats with asymptomatic HCM are warranted.
In this study, the range of intra-ventricular mechanical synchrony in clinically normal cats was similar to that observed in studies of healthy dogs and human subjects.9,21–24 Longitudinal mechanical synchrony was more prominent compared with the other two directions. With the exception of longitudinal intra-ventricular synchrony, parameters of ventricular mechanical synchrony were not affected by confounding factors, such as age, body weight, or systemic BP. These findings are consistent with the results of a study in dogs, in which no effect of age or body weight was observed on the parameters of intra-/inter-ventricular mechanical synchrony.22 Clinically, the impairment of intra-ventricular systolic synchrony is strongly related to increased septal thickness and LV outflow-tract gradient in human patients with HCM.25 Asymmetric HCM accounts for a significant proportion of the HCM pattern in cats.26 Further investigations are warranted to establish the association between intra-ventricular synchrony and septal thickness in cats with HCM.
The findings from this study must be interpreted in light of a few limitations. The currently available frame rate of 2D-STE imaging remains low. This low frame rate potentially affected the overall accuracy of the measurements of time to peak strain. Inadequate border recognition is another factor that potentially limits the assessment of strain. These limitations may be improved with the use of the recently introduced three-dimensional speckle-tracking method.26
Conclusion
This study demonstrated the presence of LV mechanical heterogeneity and synchrony in clinically normal cats using 2D-STE. Normal ranges of echocardiographic parameters used to assess ventricular heterogeneity and synchrony were determined in this cohort. Further investigation is warranted to establish the clinical relevance of these two physiological properties in cats with cardiomyopathies. In addition, echocardiographic evaluations of LV mechanical heterogeneity and synchrony in cats with HCM are necessary to assess the clinical utility of the normal ranges generated in this study.
Acknowledgment
The authors thank the Consulting Center for Statistics and Bioinformatics, College of Bio-Resources and Agriculture, National Taiwan University for assistance with the statistical analyses.
Disclosure
The authors report no conflicts of interest in this work.
References
Spragg DD, Kass DA. Pathobiology of left ventricular dyssynchrony and resynchronization. Prog Cardiovasc Dis. 2006;49:26–41. | |
Prinzen FW, Hunter WC, Wyman BT, et al. Mapping of regional myocardial strain and work during ventricular pacing: experimental study using magnetic resonance imaging tagging. J Am Coll Cardiol. 1999;33:1735–1742. | |
Van Oosterhout MF, Prinzen FW, Arts T, et al. Asynchronous electrical activation induces asymmetrical hypertrophy of the left ventricular wall. Circulation. 1998;98:588–595. | |
Sadeghpour A, Kyavar M, Behzadnia N, et al. Left ventricular systolic dyssynchrony in patients with hypertrophic cardiomyopathy: The prevalence and its relation to syncope. Int Cardiovasc Res J. 2010;4:152–158. | |
Wess G, Sarkar R, Hartmann K. Assessment of left ventricular systolic function by strain imaging echocardiography in various stages of feline hypertrophic cardiomyopathy. J Vet Intern Med. 2010;24:1375–1382. | |
Thomas WP, Gaber CE, Jacobs GJ, et al. Recommendations for standards in transthoracic two-dimensional echocardiography in the dog and cat. Echocardiography Committee of the Specialty of Cardiology, American College of Veterinary Internal Medicine. J Vet Intern Med. 1993;7:247–52. | |
Tei C, Nishimura RA, Seward JB, Tajik AJ. Noninvasive Doppler-derived myocardial performance index: correlation with simultaneous measurements of cardiac catheterization measurements. J Am Soc Echocardiogr. 1997;10:169–178. | |
Santilli RA, Bussadori C. Doppler echocardiographic study of left ventricular diastole in non-anaesthetized healthy cats. Vet J. 1998;156:203–215. | |
De Boeck BWL, Kirn B, Teske AJ, et al. Three-dimensional mapping of mechanical activation patterns, contractile dyssynchrony and dyscoordination by two-dimensional strain echocardiography: Rationale and design of a novel software toolbox. Cardiovasc Ultrasound. 2008;6:22. | |
López-Alvarez J, Fonfara S, Pedro B, Stephenson H, Cripps PJ, Dukes-McEwan J. Assessment of mechanical ventricular synchrony in Doberman Pinscher with dilated cardiomyopathy. J Vet Cardiol. 2011;13:183–195. | |
Brown S, Atkins C, Bagley R, et al. Guidelines for the identification, evaluation, and management of systemic hypertension in dogs and cats. J Vet Intern Med. 2007;21:542–558. | |
Boon JA. Appendix four: feline. In: Boon JA, editor, Veterinary Echocardiography. 2nd ed. Iowa: Wiley-Blackwell; 2011:569–580. | |
Disatian S, Bright JM, Boon J. Association of age and heart rate with pulsed-wave Doppler measurements in healthy, nonsedated cats. J Vet Intern Med. 2008;22:351–356. | |
Leitman M, Lysiansky M, Lysyansky P, et al. Circumferential and longitudinal strain in 3 myocardial layers in normal subjects and in patients with regional left ventricular dysfunction. J Am Soc Echocardiogr. 2010;23:64–70. | |
Afonso L, Kondur A, Simegn M, et al. Two dimensional strain profiles in patients with physiological and pathological hypertrophy and preserved left ventricular systolic function: a comparative analyses. BMJ Open. 2012;2:e001390. | |
Adamu U, Schmitz F, Becker M, Kelm M, Hoffmann R. Advanced speckle tracking echocardiography allowing a three-myocardial layer-specific analysis of deformation parameters. Eur J Echocardiogr. 2009;10:303–308. | |
Kramer CM, Reichek N, Ferrari VA, Theobald T, Dawson J, Axel L. Regional heterogeneity of function in hypertrophic cardiomyopathy. Circulation. 1994;90:186–194. | |
Serri K, Reant P, Lafitte M, et al. Global and regional myocardial function quantification by two-dimensional strain: application in hypertrophic cardiomyopathy. J Am Coll Cardiol. 2006;47:1175–1181. | |
Koiwa Y, Kamada H, Ikeda J, et al. Magnitude of transmural heterogeneity as a dominant factor for LVEDP elevation in HCM. IEEE. In: Ultrasonics symposium. 2001;2;1245–1248. | |
Liu SK, Maron BJ, Tilley LP. Feline hypertrophic cardiomyopathy: gross anatomic and quantitative histologic features. Am J Pathol. 1981;102:388–395. | |
Chetboul V, Serres F, Gouni V, Tissier R, Pouchelon JL. Radial strain and strain rate by two-dimensional speckle tracking echocardiography and the tissue velocity based technique in the dog. J Vet Cardiol. 2007;9:69–81. | |
Griffiths LG, Fransioli JR, Chigerwe M. Echocardiographic assessment of interventricular and intraventricular mechanical synchrony in normal dogs. J Vet Cardiol. 2011;13:115–126. | |
Ng AC, Tran DT, Newman M, et al. Left ventricular longitudinal and radial synchrony and their determinants in healthy subjects. J Am Soc Echocardiogr. 2008;21:1042–1048. | |
Takano H, Fujii Y, Ishikaw R, Aoki T, Wakao Y. Comparison of left ventricular contraction profiles among small, medium, and large dogs by use of two-dimensional speckle-tracking echocardiography. Am J Vet Res. 2010;71:421–427. | |
D’Andrea AM, Caso P, Severino S, et al. Association between intraventricular myocardial systolic dyssynchrony and ventricular arrhythmias in patients with hypertrophic cardiomyopathy. Echocardiography. 2005;22:571–578. | |
Spalla I, Locatelli C, Riscazzi G, Santagostino S, Cremaschi E, Brambilla P. Survival in cats with primary and secondary cardiomyopathies. J Feline Med Surg. 2015;doi:10.1177/1098612X15588797. |
 © 2016 The Author(s). This work is published and licensed by Dove Medical Press Limited. The full terms of this license are available at https://www.dovepress.com/terms.php and incorporate the Creative Commons Attribution - Non Commercial (unported, v3.0) License.
By accessing the work you hereby accept the Terms. Non-commercial uses of the work are permitted without any further permission from Dove Medical Press Limited, provided the work is properly attributed. For permission for commercial use of this work, please see paragraphs 4.2 and 5 of our Terms.
© 2016 The Author(s). This work is published and licensed by Dove Medical Press Limited. The full terms of this license are available at https://www.dovepress.com/terms.php and incorporate the Creative Commons Attribution - Non Commercial (unported, v3.0) License.
By accessing the work you hereby accept the Terms. Non-commercial uses of the work are permitted without any further permission from Dove Medical Press Limited, provided the work is properly attributed. For permission for commercial use of this work, please see paragraphs 4.2 and 5 of our Terms.