")
Back to Journals » International Journal of Nanomedicine » Volume 19
2-Monoacylglycerol Mimetic Liposomes to Promote Intestinal Lymphatic Transport for Improving Oral Bioavailability of Dihydroartemisinin
Authors Zheng B, Pan F, Shi M, He C, He B, Wang R, Ren G , Yang S , Zhang S
Received 8 March 2024
Accepted for publication 23 May 2024
Published 6 June 2024 Volume 2024:19 Pages 5273—5295
DOI https://doi.org/10.2147/IJN.S462374
Checked for plagiarism Yes
Review by Single anonymous peer review
Peer reviewer comments 2
Editor who approved publication: Dr Kamakhya Misra
Bin Zheng,1– 3,* Fei Pan,1– 3,* Minfei Shi,1– 3 Cuiping He,1– 3 Beibei He,1– 3 Rongrong Wang,1– 3 Guolian Ren,1– 3 Shuang Yang,4 Shuqiu Zhang1– 3
1School of Pharmacy, Shanxi Medical University, Taiyuan, 030001, People’s Republic of China; 2Medicinal Basic Research Innovation Center of Chronic Kidney Disease, Ministry of Education, Shanxi Medical University, Taiyuan, 030001, People’s Republic of China; 3Shanxi Provincial Key Laboratory of Drug Synthesis and Novel Pharmaceutical Preparation Technology, Shanxi Medical University, Taiyuan, 030001, People’s Republic of China; 4School of Basic Medical Sciences, Shanxi Medical University, Taiyuan, 030001, People’s Republic of China
*These authors contributed equally to this work
Correspondence: Shuang Yang, School of Basic Medical Sciences, Shanxi Medical University, No. 56, Xinjian South Road, Taiyuan, 030001, People’s Republic of China, Email [email protected] Shuqiu Zhang, School of Pharmacy, Shanxi Medical University, No. 56, Xinjian South Road, Taiyuan, 030001, People’s Republic of China, Email [email protected]
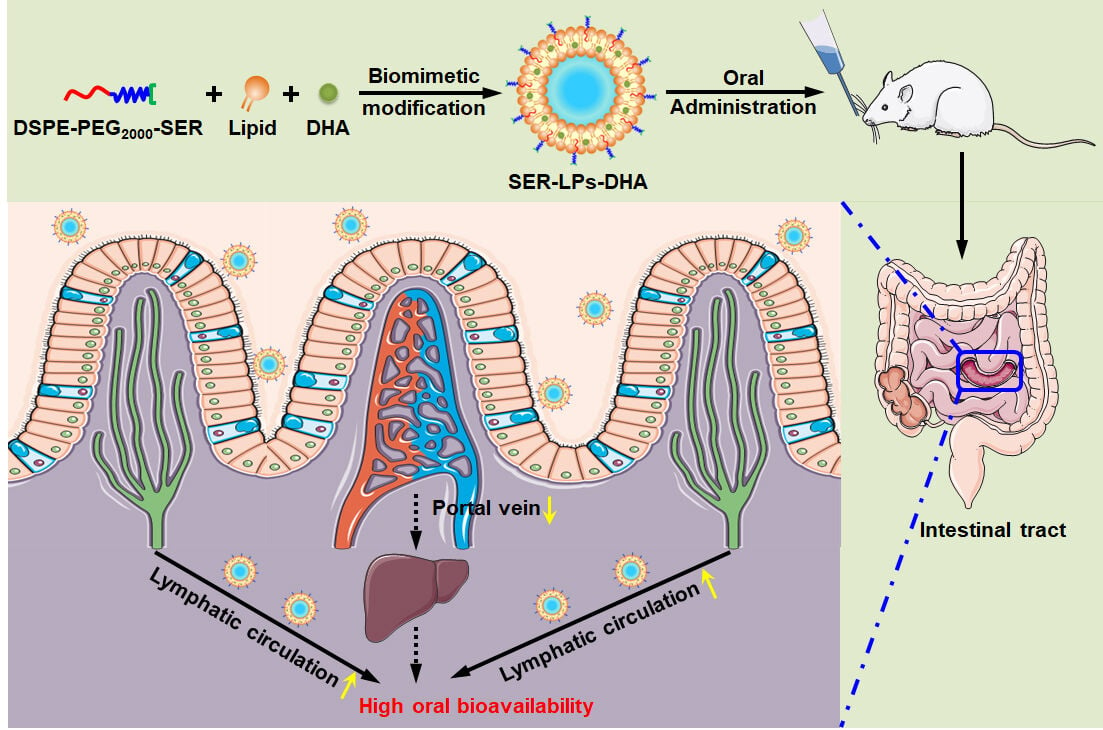
Purpose: Reducing the first-pass hepatic effect via intestinal lymphatic transport is an effective way to increase the oral absorption of drugs. 2-Monoacylglycerol (2-MAG) as a primary digestive product of dietary lipids triglyceride, can be assembled in chylomicrons and then transported from the intestine into the lymphatic system. Herein, we propose a biomimetic strategy and report a 2-MAG mimetic nanocarrier to target the intestinal lymphatic system via the lipid absorption pathway and improve oral bioavailability.
Methods: The 2-MAG mimetic liposomes were designed by covalently bonding serinol (SER) on the surface of liposomes named SER-LPs to simulate the structure of 2-MAG. Dihydroartemisinin (DHA) was chosen as the model drug because of its disadvantages such as poor solubility and high first-pass effect. The endocytosis and exocytosis mechanisms were investigated in Caco-2 cells and Caco-2 cell monolayers. The capacity of intestinal lymphatic transport was evaluated by ex vivo biodistribution and in vivo pharmacokinetic experiments.
Results: DHA loaded SER-LPs (SER-LPs-DHA) had a particle size of 70 nm and a desirable entrapment efficiency of 93%. SER-LPs showed sustained release for DHA in the simulated gastrointestinal environment. In vitro cell studies demonstrated that the cellular uptake of SER-LPs primarily relied on the caveolae- rather than clathrin-mediated endocytosis pathway and preferred to integrate into the chylomicron assembly process through the endoplasmic reticulum/Golgi apparatus route. After oral administration, SER-LPs efficiently promoted drug accumulation in mesenteric lymphatic nodes. The oral bioavailability of DHA from SER-LPs was 10.40-fold and 1.17-fold larger than that of free DHA and unmodified liposomes at the same dose, respectively.
Conclusion: SER-LPs improved oral bioavailability through efficient intestinal lymphatic transport. These findings of the current study provide a good alternative strategy for oral delivery of drugs with high first-pass hepatic metabolism.
Keywords: intestinal lymphatic transport, biomimetic liposomes, first-pass hepatic metabolism, oral delivery, dihydroartemisinin
Graphical Abstract:
Introduction
Oral delivery is the most common and acceptable administration for patients and thus has a high market share.1–3 However, a majority of oral drugs show low bioavailability due to their low solubility in gastrointestinal (GI) fluids, degradation by strong acids and enzymes in the GI tract, poor absorption by intestinal epithelial cells, and first-pass hepatic metabolism.4–7 A typical example is dihydroartemisinin (DHA), the first-line drug used for the treatment of malaria in the clinic.8 Recently, numerous literature reports have emerged that DHA possesses the potential to become a new generation of drugs for treating systemic lupus erythematosus.9–11 In addition to its prominent antimalarial and immunoregulatory effects, DHA has been reported to have effective anticancer activity.12–16 However, concerning the oral administration of DHA, there remains a critical challenge in the low oral bioavailability due to the reasons of poor water solubility and extremely high first-pass effect.17–19
It is widely known that oral drugs can be transported in systemic circulation by either the portal vein or the intestinal lymphatic system. After transport across the enterocyte, the majority of drugs (including DHA) prefer to enter the liver via the hepatic portal vein pathway and are then metabolized and inactivated by hepatic microsomal enzymes.20,21 Such a serious first-pass hepatic metabolism is certain to lower drug concentrations in the systemic circulation. Some highly lipophilic drugs are known to be transported to the bloodstream via the intestinal lymphatic pathway, which can completely bypass the liver.22–25 Thus, enhancing the intestinal lymphatic transport of DHA is undoubtedly an effective way to reduce its first-pass hepatic metabolism.
In the daily diet, dietary lipids such as triglyceride (TG) are primarily transported into the intestinal lymphatic system.26 In the GI tract, dietary TG is emulsified into droplets and then hydrolyzed by lipase to 2-monoacylglycerol (2-MAG) and fatty acids.27,28 After being absorbed into intestinal cells, 2-MAG and fatty acids re-esterify into TG, bond with apolipoprotein B-48 (Apo B-48) to assemble in chylomicrons (CM), and then secret into the intestinal lymphatic vessels and circulate throughout the body.29,30 This means that it is feasible for drugs to utilize lipid absorption pathways by participating in the assembly process of CM to target the lymphatic system. To increase intestinal lymphatic transport, the coadministration of drugs with lipid-based formulations including liposomes,31 self-micro emulsifying drug delivery systems,32–34 solid lipid nanoparticles,35,36 nanostructured lipid carriers,37 and micro/nano emulsions,38,39 is perhaps the most studied and successful approach. In recent years, researchers have found that harnessing biomimetic nanocarriers to simulate the structure of key components (such as TG and CM) in lipid absorption pathways could be effectively transported into the intestinal lymphatic system.21,40 Compared with conventional lipid-based formulations, biomimetic nanocarriers not only promote the oral bioavailability of the encapsulated drugs by avoiding first-pass hepatic metabolism, but also accumulate drugs in lymph and mesenteric lymphatic nodes (MLNs) for the treatment of lymphatic system-related diseases.41,42
Notably, it is difficult for TG to be directly absorbed in the GI tract after oral administration. TG is first digested into 2-MAG and fatty acids, and then the obtained products, together with bile salts and phospholipids, are efficiently taken up by enterocytes.23,43 Therefore, compared to TG, utilizing 2-MAG as a targeted mimetic molecule for lipid absorption pathways is more promising. In this study, 2-MAG mimetic liposomes are designed to promote intestinal lymphatic transport of DHA for high oral bioavailability. To seek a similar structure with 2-MAG, serinol (SER) is covalently bonded on the surface of liposomes. As shown in Figure 1, the 2-MAG mimetic superficially modified liposomes named as SER-LPs will show distinct advantages for oral delivery of DHA: (i) liposomal encapsulation can improve the stability and solubility of DHA in the GI tract before absorption by enterocytes; (ii) SER-LPs are expected to perform similarly to 2-MAG, participating in the synthesis process of CM, and successively assembling into TG-LPs and CM-LPs. Subsequently, CM-LPs are secreted out of cells, transported into the lymphatic system, and directly to the systemic circulation, avoiding the first-pass effect in the liver and improving the oral bioavailability of DHA.
 |
Figure 1 Schematic illustration of the construction process of CM-LPs-DHA and the lymphatic transport process of SER-LPs-DHA in enterocytes. |
Materials and Methods
Materials
Lipoid E80 (egg yolk phospholipids with 80% phosphatidylcholine) was purchased from Lipoid GmbH (Ludwigshafen, Germany). Cholesterol was purchased from Avanti Polar Lipids, Inc. (Shanghai, China). 1,2-Dioleoyl-sn-glycero-3-phosphoethanolamine-N-[methoxy poly(ethylene glycol)2000](DSPE-mPEG2000) and 1,2-Dioleoyl-sn-glycero-3-phosphoethanolamine-N-[poly(ethylene glycol)2000]- hydroxy succinimide (DSPE-PEG2000-NHS) were purchased from Ponsure Biological Co., Ltd. (Shanghai, China). Dihydroartemisinin (DHA) was purchased from Huali Wulingshan Pharmaceutical Co., Ltd. (Chongqing, China). Cycloheximide (CHX, 95%) and 1,1’-dioctadecyl-3,3,3’,3’-tetramethylindotricarbocyaine iodide (DiR) were purchased from Aladdin (Shanghai, China). Methyl-β-cyclodextrin (M-β-CD) and chlorpromazine hydrochloride (CPZ) were purchased from Macklin (Shanghai, China). Fetal bovine serum (FBS) was purchased from Cellmax (Beijing, China). Phosphate buffer saline (PBS), 4% paraformaldehyde, lomitapide, and penicillin/streptomycin solution were obtained from Meilun Bio Company (Dalian, China). 4’,6-Diamidino-2-phenylindole dihydrochloride (DAPI), Hanks’ balanced salt solution (with Ca2+ & Mg2+, HBSS) and Dulbecco’s modified Eagle’s medium (DMEM) were acquired from Boster Bio Company (Wuhan, China). Trypsin-EDTA (0.25%), pure methanol, and acetonitrile for chromatography were obtained from Thermo Fisher Scientific (Waltham, MA, USA). 1,1’-Dioctadecyl-3,3,3’,3’-tetramethylindocarbocyanine perchlorate (Dil), ER-Tracker Green, Lyso-Tracker-Green, Golgi-Tracker-Green were acquired from Beyotime Biotechnology (Shanghai, China). Bafilomycin A1, ethylisopropylamiloride (EIPA), brefeldin A, monensin sodium salt, dynasore, and Cell Counting Kit-8 (CCK-8) were acquired from MedChemExpress (New Jersey, USA). All other analytical reagents were commercially obtained in analytical grade or better.
Cells
Human colon carcinoma cells (Caco-2 cells) were purchased from the American Type Culture Collection (ATCC). Caco-2 cells were grown in complete high-glucose Dulbecco’s Modified Eagle’s Medium (DMEM) containing 20% (v/v) fetal bovine serum (FBS), 1% (v/v) nonessential amino acids (NEAA), 1% (v/v) L-glutamine, 1% penicillin, and streptomycin (P/S). The cells were cultured at 37°C in a humidified 5% CO2 incubator.
Animals
Institute for Cancer Research (ICR) male mice (20 ± 2 g) and Sprague-Dawley (SD) male rats (200 ± 20 g) were provided by the Experimental Animal Center of Shanxi Medical University (Taiyuan, China). All mice and rats were housed at a temperature of 25 ± 2°C under a 12 h light/dark cycle with free access to water and food for 1 week before the experiment. The experimental protocol was approved by the Institutional Animal Care and Use Committee of Shanxi Medical University (license No. SCXK (Jin) 2019–0007) and performed under the Guidelines for Ethical Review of Laboratory Animal Welfare of China (GB/T 35892–2018). Before the experiments, the ICR mice and SD rats were fasted for over 12 h and had free access to water.
Synthesis of DSPE-PEG2000-SER
DSPE-PEG2000-SER was synthesized by the amide reaction between the succinimidyl ester of DSPE-PEG2000-NHS and the amino of SER. Briefly, 580.0 mg of DSPE-PEG2000-NHS (0.2 mmol) was dissolved in 10 mL of chloroform. SER (20.0 mg, 0.22 mmol) was dissolved in 1 mL dimethyl sulfoxide. Then, the SER solution and 56 µL triethylamine (0.4 mmol) were added dropwise into the DSPE-PEG2000-NHS solution at 40°C under magnetic stirring and nitrogen protection for 6 h. After the reaction, the reaction solution was washed thrice with distilled water and evaporated by reducing the pressure for solvent removal. Finally, the product was precipitated with cold ether, filtered, collected, and dried under vacuum to obtain purified DSPE-PEG2000-SER. The structure of DSPE-PEG2000-SER was confirmed by 1H NMR and FT-IR.
Preparation of DHA-Loaded Liposomes
DHA-loaded liposomes (LPs-DHA) were manufactured by using the ethanol injection method. In brief, to prepare SER-modified LPs-DHA (SER-LPs-DHA), 10 mg of Lipoid E80, 2 mg of cholesterol, 2 mg of DSPE-PEG2000-SER, and 3 mg of DHA were dissolved in 0.5 mL of anhydrous ethanol and ultrasonicated for 10 min to obtain lipid solution; then, the resulting lipid solution was added dropwise into 5 mL of distilled water under stirring (1000 rpm). The mixture was continuously stirred at 55°C for 1 h and then evaporated by reducing the pressure to remove the residual ethanol. To prepare PEG-modified LPs-DHA (PEG-LPs-DHA), 2 mg of DSPE-PEG2000-SER was replaced by 1.9 mg of DSPE-mPEG2000 under the same conditions.
In addition, SER-LPs and PEG-LPs were also prepared as described above without adding DHA. For the preparation of fluorescence-labeled LPs (Dil-LPs and DiR-LPs) used in animal experiments, the hydrophobic fluorescent dye Dil or DiR (8% w/w) was blended with Lipoid E80 and cholesterol in lipid solution. In cell experiments, Dil (1% w/w) was added to the lipid solution. The prepared liposomes mentioned above were stored at 4°C.
Characterization
The particle size and zeta potential of LPs-DHA were determined by a dynamic light scattering analyzer (Zetasizer Nano ZS, Malvern, UK). The morphological features of LPs-DHA were investigated by transmission electron microscopy (TEM) (JEM-1200EX, JEOL, Japan). The samples were pretreated with negative staining using uranyl acetate on a copper grid. The low-speed centrifugation method (10,000 rpm, 10 min) was used to separate LPs-DHA and non-entrapped DHA. 50 μL of supernatant were taken and dissolved in 800 μL of anhydrous ethanol. The concentration of DHA in the supernatant was measured by the UV‒Vis spectrophotometric method. The entrapment efficiency (EE) and the drug loading capacity (DL) of LPs-DHA were calculated using equations (1) and (2), respectively:

where WT was the weight of DHA added in the preparation process, and WE was the weight of DHA entrapped in LPs-DHA, which was derived from the supernatant of LPs-DHA after centrifugation at 10,000 rpm for 10 min.44

where WE was the weight of DHA entrapped in LPs-DHA, and WL was the total weight of LPs-DHA.
Storage and Medium Stability Study
The storage stability of LPs-DHA was evaluated by measuring the changes in EE and particle size for up to 28 days at 4°C. To test the stability of LPs in the gastrointestinal tract in vitro, freshly prepared LPs-DHA were dispersed in simulated gastric fluid (SGF, pH 1.2), simulated intestinal fluid (SIF, pH 6.8), or phosphate buffer saline (PBS, pH 7.4). These suspensions were incubated at 37 ± 0.5°C and shaken at 150 rpm. At predetermined time points (0, 1, 2, and 4 h), the particle size of LPs-DHA in SGF and PBS was measured as described above. For the stability of LPs-DHA in SIF, the particle size was measured at 0, 8, 16, and 24 h.
In vitro Release Assay
An in vitro release assay was carried out by a dynamic dialysis method in a gas bath constant temperature oscillator (SHA-BA, Jintan Ronghua Instrument Manufacture Co., Ltd., Jiangsu, China) to evaluate the release behavior of DHA from LPs. Two milliliters of LPs-DHA or control drug solution (DHA highly dispersed in 0.5% w/v carboxymethyl cellulose sodium aqueous solution) were placed in a dialysis bag (MW cut-off 8–14 kDa).45 To mimic the situation of LPs-DHA in the gastrointestinal environment, LPs-DHA were first incubated in 20 mL of SGF for 2 h, and then incubated in 20 mL of SIF for another 22 h at 37 ± 0.5°C and shaken at 150 rpm. An aliquot of 0.3 mL release medium was withdrawn at fixed time points (0.5, 1, 2, 3, 4, 6, 8, 12, and 24 h), and an equal volume of fresh release medium was replenished.46 The concentration of DHA in the release medium was measured by the UV‒Vis spectrophotometric method.
Cytotoxicity Study
The cytotoxicity of LPs was evaluated by a cell counting kit-8 (CCK-8) assay. Caco-2 cells were seeded at a density of 1.0 × 10⁴ cells/well into a 96-well plate. After 72 h of culture, cells were incubated with PEG-LPs or SER-LPs at various concentrations of Lipoid E80 (0.01, 0.04, 0.08, 0.12, 0.16, and 0.20 mg/mL) at 37°C for 24 h. Then, 10 μL CCK-8 solutions were added and incubated for 2 h. The absorbance values were measured at 450 nm by a plate reader (Varioskan Flash, Thermo Scientific, USA). All the experiments were performed in sextuplicate. Cell viability was calculated using the following equation (3):

where AT, AU, and AB were the absorbance of the incubated groups, the unincubated cells, and the blank medium, respectively.
Cellular Uptake Study
The cellular uptake of LPs was quantitatively and qualitatively examined by flow cytometry (FCM) and confocal laser scanning microscopy (CLSM), respectively. For FCM, Caco-2 cells were seeded at a density of 1.0 × 10⁵ cells/well into 24-well plates. After 72 h of culture, the cells were incubated with Dil-PEG-LPs or Dil-SER-LPs (corresponding to 0.20 mg/mL Lipoid E80) at 37°C for 1, 2, 4, and 6 h. Cells treated with only high-glucose DMEM were used as a negative control. At the end of the incubation period, the cells were washed thrice with cold phosphate buffer saline (PBS) (pH 7.4), trypsinized, collected, and fixed with 4% paraformaldehyde. The fluorescence intensity in the cells was analyzed by FCM (FACSCelesta, BD Biosciences, San Jose, CA, USA).
To investigate the effect of energy on the internalization of LPs in Caco-2 cells, the cells were maintained at 4°C for 1 h or pretreated with 0.6 mg/mL sodium azide at 37°C for 1 h. Then, the cells were incubated with Dil-PEG-LPs or Dil-SER-LPs for another 4 h under the original conditions. After incubation, the fluorescence intensity in the cells was analyzed by FCM as described above.
For CLSM, Caco-2 cells were seeded at a density of 2.0 × 10⁵ cells/well into glass-bottomed 20-mm cell culture dishes. After 72 h of culture, the cells were incubated with Dil-PEG-LPs or Dil-SER-LPs (corresponding to 0.20 mg/mL Lipoid E80) at 37°C for 4 h. Then, the cells were washed thrice with cold PBS (pH 7.4) and fixed with 4% paraformaldehyde. The cell nuclei were stained with 4’,6-diamidino-2-phenylindole dihydrochloride (DAPI). The cells were washed with PBS (pH 7.4) and observed by CLSM (FV3000, Olympus, Japan).
Endocytosis and Exocytosis Pathways in Caco-2 Cells
To explore the endocytosis pathway of LPs, Caco-2 cells were preincubated with different endocytosis inhibitors, including chlorpromazine hydrochloride (CPZ) (30 μM), sucrose (200 mM), methyl-β-cyclodextrin (MβCD) (10 mM), dynasore (80 μM), and ethylisopropylamiloride (EIPA) (100 μM) at 37°C for 1 h. Then, the cells were incubated with Dil-PEG-LPs or Dil-SER-LPs for another 4 h. During the incubation period of LPs, the concentrations of endocytosis inhibitors were maintained constant. After co-incubation, the cells were washed thrice with cold PBS (pH 7.4), trypsinized, collected, and fixed with 4% paraformaldehyde. The fluorescence intensity in the cells was analyzed by FCM.
For the transport pathway of LPs, Caco-2 cells were incubated with Dil-PEG-LPs or Dil-SER-LPs at 37°C for 3 h. Then, the cells were washed thrice with cold PBS (pH 7.4) and incubated with different transport inhibitors, including bafilomycin A1 (150 nM), brefeldin A (25 μg/mL), monensin (32.5 μg/mL), and lomitapide (10 μM) for another 6 h. After incubation, the fluorescence intensity in the cells was analyzed by FCM as described above.
Transport Across the Caco-2 Cell Monolayers
Caco-2 cells were seeded at a density of 1.0 × 10⁵ cells/well on the 12-well transwell plate (membrane material: PET; pore size: 0.4 μm; growth area: 1.12 cm2) and cultured for 21 days. The culture medium was replaced every 2 days in the first week and every day since the second week. During 21 days of culture, the transepithelial electrical resistance (TEER) value was measured using a cell resistance meter (RE1600, Kingtech, Beijing, China) to monitor the integrity of cell monolayers. The Caco-2 cell monolayers could be used for the subsequent transcellular transport study when the TEER value was over 500 Ω·cm2. Before the experiments, the medium in the apical side (AP) and basolateral side (BL) were replaced with pre-warmed Hanks’ balanced salt solution (with Ca2+ and Mg2+, HBSS).
After incubation at 37°C for 30 min, 0.5 mL of DHA solution (1% ethanol, v/v), PEG-LPs-DHA, or SER-LPs-DHA (corresponding to 40 μg/mL DHA) were added to the AP. At predetermined time points (0.5, 1, 2, and 4 h), an aliquot of 0.3 mL transport sample was withdrawn from the BL, and an equal volume of fresh HBSS was replenished. Meanwhile, the transport sample from the BL at the point of 4 h was collected and then dialyzed against Pluronic F127 solution (0.1%, w/v) to remove the salts in the transport medium. After 24 h of dialysis, the sample was then prepared for TEM observation. To validate the integrality of the Caco-2 cell monolayers during the incubation, the TEER values at different time points were also measured. The concentration of DHA in the transport sample was determined by high-performance liquid chromatography-tandem mass spectrometry (HPLC‒MS/MS). The apparent permeability coefficient (Papp) was using the following equation (4):

where Q was the accumulative amount of DHA in the BL, A was the membrane growth area, C0 was the initial concentration of DHA in the AP and t was the duration time.
To further explore the transport mechanism of LPs, Caco-2 cell monolayers were first incubated with Dil-PEG-LPs or Dil-SER-LPs (corresponding to 0.20 mg/mL Lipoid E80) for 4 h. Then, the cell monolayers were washed thrice with HBSS and both the apical and basolateral sides were added fresh HBSS containing different transport inhibitors, including bafilomycin A1 (150 nM), brefeldin A (25 μg/mL), monensin (32.5 μg/mL), and lomitapide (10 μM). After 4 h of incubation at 37°C, the fluorescence intensity in the BL side was analyzed by spectral scanning multimode reader (Varioskan Flash, Thermo Scientific, USA).
Intracellular Colocalization in Caco-2 Cells
Caco-2 cells were seeded at a density of 2.0 × 10⁵ cells/well into glass-bottomed 20-mm cell culture dishes. After 72 h of culture, cells were incubated with Dil-PEG-LPs or Dil-SER-LPs at 37°C for 4 h. After incubation, the cells were washed thrice with cold PBS (pH 7.4) and stained with cell trackers (Lyso-Tracker, ER-Tracker, and Golgi-Tracker) according to the manufacturer’s protocol. Then, the cells were observed by CLSM.
Biodistribution in the Intestinal Tracts and Mesenteric Lymph Nodes
To determine the oral biodistribution of LPs in the intestinal tracts and mesenteric lymph (MLNs), a single dose of 4 mg/kg DiR solution, DiR-PEG-LPs, and DiR-SER-LPs were orally administered to mice. At predetermined time points (1, 2, 4, and 6 h), the mice were sacrificed, and the intestinal tracts and MLNs were collected. Then, fluorescence images of the intestinal tracts and MLNs were taken by an In-Vivo Imaging System (Xtreme, Bruker, Karlsruhe, Germany).
To evaluate the uptake of LPs in the intestinal tracts and MLNs, Dil solution, Dil-PEG-LPs, and Dil-SER-LPs were orally administered to mice at a dose of 4 mg/kg. After 4 h, the mice were sacrificed, and intestinal segments (including the duodenum, jejunum, ileum, and colon, approximately 1 cm each), and MLNs were collected. Then, the intestinal segments were fixed with 4% paraformaldehyde, stained with DAPI, and observed by CLSM (FV3000, Olympus, Japan). As for MLNs, Anti-ZO-1/FITC and DAPI were used to stain the intercellular tight junction and cell nuclei, respectively.
To further investigate the intestinal lymphatic transport of LPs in vivo, mice were intraperitoneally administered 3.0 mg/kg cycloheximide (CHX) to block lymphatic transport.33 One hour post injection, Dil-PEG-LPs and Dil-SER-LPs were orally administered to mice at a dose of 4.3 mg/kg. After 4 h, MLNs were collected and examined by CLSM as described above.
Pharmacokinetic Study
The oral absorption of SER-LPs-DHA was systematically evaluated by comparing the pharmacokinetic profile with the DHA suspension and PEG-LPs-DHA. Fifteen rats were randomly partitioned into three groups. One group received 10 mg/kg DHA suspension dispersed in 0.5% w/v carboxymethyl cellulose sodium aqueous solution by oral administration, and the other two groups received oral administration of PEG-LPs-DHA and SER-LPs-DHA at a dose equivalent to 10 mg/kg DHA. Blood samples of approximately 0.5 mL were collected into 1.5 mL heparinized centrifuge tubes from the fossa orbitalis vein before drug administration and at 0.167, 0.333, 0.5, 0.75, 1, 2, 4, 6, 8, 12, and 24 h postdosing, and were centrifuged at 7000 rpm for 10 min to separate the plasma. All plasma samples were stored at −80°C until HPLC‒MS/MS analysis.
The pharmacokinetic parameters for DHA, including maximum plasma concentration (Cmax), time of the maximum concentration (Tmax), area under the plasma level-time curve (AUC), mean residence time (MRT), and relative bioavailability (RBA) were calculated using the Drug and Statistics 2.0 program.
Intestinal Lymphatic Transport Inhibition Study
To investigate the intestinal lymphatic transport of LPs-DHA in vivo, an oral pharmacokinetic study was further performed in the presence of the chylomicron flow blocker, CHX. The rats were pretreated with 3.0 mg/kg CHX intraperitoneally.33 After 1 h, DHA suspension, PEG-LPs-DHA, and SER-LPs-DHA were orally administered to rats at a dose equivalent to 10 mg/kg DHA. Then, at 0.167, 0.333, 0.5, 0.75, 1, 2, 4, 6, and 8 h, approximately 0.5 mL of blood samples were collected and processed as described above.
In vivo Safety Evaluation
To evaluate the in vivo safety of LPs, eighteen mice were randomly divided into three groups (normal saline, SER-LPs, and SER-LPs-DHA, n = 6 per group). The mice were orally administered once every other day for a total of 15 days (dose of 15 mg/kg DHA). The weight of the mice was measured every other day during administration. After the last administration, all mice were sacrificed, and the heart, liver, spleen, lung, kidney, stomach, duodenum, and colon tissues were collected, weighed, and preserved in 4% paraformaldehyde for hematoxylin and eosin (H&E) staining. Additionally, the effect of SER-LPs on hepatic and renal functions was evaluated by the levels of alanine aminotransferase (ALT), aspartate aminotransferase (AST), serum alkaline phosphatase (AKP), creatinine (CRE), and blood urea nitrogen (BUN) in mice. Blood was collected after the last treatment, and serum was separated by centrifugation (4°C, 5000 rpm, 10 min). Serum ALT, AST, AKP, CRE, and BUN were determined according to the requirements of the instructions provided in reagent kits. The values were expressed as U/L, μmol/L, or mmol/L of serum.
Assay Analysis
A UV‒Vis spectrophotometric method was used for the determination of DHA content in the in vitro experiments. In brief, the DHA samples were dissolved in an assay solution composed of 2% NaOH and ethanol (4:1, v/v), and incubated in a water bath at 60°C for 30 min. Then the absorbance was measured at 238 nm by a UV‒Vis spectrophotometer (UV-1200, NAPADA, Shanghai, China).47
Since the low content in biological studies and the presence of protein in the samples interfered with quantification, the concentration of DHA in samples obtained from the cell monolayers transport and pharmacokinetic studies was measured with a validated HPLC‒MS/MS method using artemisinin (ART) as an internal standard after extraction with ether.18 The chromatographic separation of prepared samples was performed using an HPLC system (Agilent 1200, Agilent Technologies Inc., California, USA) equipped with an Agilent SB-C18 column (4.6 mm × 50 mm, 1.8 μm) and Dikma C18 precolumn (4.0 mm × 3.0 mm, 5.0 μm). The mobile phase was composed of acetonitrile and 10 mM ammonium acetate (90:10, v/v) and was run at 0.3 mL/min. The injection volume was 10 μL, and the column temperature was maintained at 30°C. The mass spectrometer (API 3000, AB SCIEX LLC., California, USA) was equipped with electrospray ionization (ESI) and operated in positive mode. Multiple-reaction monitoring (MRM) transitions for DHA and ART (internal standard) were m/z 302.5→163.3 and m/z 300.3→209.2, respectively. The instrument was operated with an ion spray voltage of 5500 V, curtain gas pressure of 10 psi, nebulizer gas pressure of 65 psi, and heater gas pressure of 30 psi. The heater gas temperature was set at 300°C. The declustering potentials used for the analysis of DHA and ART were 24 V and 25 V, respectively. The collision energies for DHA and ART were 21 V and 20 V, respectively.
Statistical Analysis
All the data are expressed as the mean ± standard deviation (SD). The identification of significant differences between different groups was carried out with Student’s t-test. P < 0.05 was considered statistically significant.
Results and Discussion
Synthesis and characterization of DSPE-PEG2000-SER
In this study, to structure a nanocarrier containing a 2-MAG mimetic group on the surface, serinol (SER) was conjugated to DSPE-PEG2000-NHS via a simple amide bond to obtain a novel material which is named DSPE-PEG2000-SER (Figure 2A). To characterize the outcome of the synthesis, the chemical structure of DSPE-PEG2000-SER was verified and compared with DSPE-PEG2000-NHS and DSPE-mPEG2000 by 1H NMR and FT-IR spectroscopy (Figure 2B and C). As shown in Figure 2B, the characteristic peak corresponding to the NHS group of DSPE-PEG2000-NHS at 2.67 ppm was nondetectable from the 1H NMR spectrum of DSPE-PEG2000-SER, indicating that the NHS group was substituted by the SER. Compared with the 1H NMR spectra of DSPE-PEG2000-NHS and DSPE-mPEG2000, a new peak at 5.7–5.8 ppm was observed in the 1H NMR spectrum of DSPE-PEG2000-SER, which was contributed by the resonance of the newly generated -CONH- group. Additionally, the narrow peak at 2.61 ppm and the broad peak at 3.14 ppm observed in the 1H NMR spectrum of DSPE-PEG2000-SER, were speculated to be the characteristic peaks of the -N-CH-R2 group and -OH group, which were donated by SER.
 |
Figure 2 Synthesis and characterization of DSPE-PEG2000-SER. Notes: (A) The synthetic route of DSEP-PEG2000-SER. (B and C) 1H NMR and FT-IR spectra of DSPE-PEG2000-NHS, DSPE-PEG2000-SER, and DSPE-mPEG2000. |
FT-IR analysis was further carried out to verify the synthesis of DSPE-PEG2000-SER. Compared with DSPE-PEG2000 and DSPE-PEG2000-NHS, the peak of DSPE-PEG2000-SER at 3330 cm−1 broadened and increased in strength, attributed to the stretching vibration of the terminal O-H bonds (Figure 2C). The peak at 1540 cm−1 was mainly attributed to the coupling of the C-N stretching vibration with N-H bending in the secondary amide bond.48 DSPE-PEG2000-SER had a narrower and stronger peak at the same position due to the formation of a new secondary amide bond. The C=O stretching vibration at 1740 cm−1 in DSPE-PEG2000 became obscured by the appearance of a stronger absorption at 1715 cm−1 in DSPE-PEG2000-SER and DSPE-PEG2000-NHS. For DSPE-PEG2000-NHS, the five-membered ring provided tertiary amide bonds. For DSPE-PEG2000-SER, this might be attributed to the formation of a new secondary amide bond.
Preparation and Characterization of SER-LPs-DHA
The SER-modified LPs-DHA (SER-LPs-DHA) were prepared successfully by the ethanol injection method which is a simple, economical, and reproducible technology. Briefly, the major lipid components, including Lipoid E80 and cholesterol, tended to self-assemble into nanoscale vesicles with lipid bilayer structures similar to those of cell membranes. DHA was embedded in the lipid bilayer through hydrophobic interaction. As a hydrophilic small-molecule compound, SER was modified on the surface of liposomes by conjugation with DSPE-PEG2000 to form 2-MAG mimetic liposomes. The PEG-modified LPs-DHA (PEG-LPs-DHA) were also prepared as a comparison. As shown in Figure 3A, the prepared SER-LPs-DHA and PEG-LPs-DHA were both slightly blue opalescent under the light. Dynamic light scattering (DLS) results showed that PEG-LPs-DHA was 63.23 ± 0.27 nm in particle size with a zeta potential of −22.7 ± 0.55 mV. After DSPE-PEG2000 was replaced by DSPE-PEG2000-SER, the average size of SER-LPs-DHA slightly increased to 71.54 ± 0.49 nm and the zeta potential became −24.9 ± 1.11 mV, which further confirmed the surface modification of SER (Figure 3C). The polydispersity indexes (PDIs) of PEG-LPs-DHA and SER-LPs-DHA were both ~0.2, demonstrating relatively uniform size distribution of the liposome droplets. The transmission electron microscopy (TEM) images showed that PEG-LPs-DHA and SER-LPs-DHA presented spherical shapes with nano diameter (40~80 nm), consistent with the DLS particle size result (Figure 3B). Additionally, the two kinds of LPs-DHA both displayed distinct core-shell (LP core and PEG chain) structures which further proved that the PEG structure was successfully covered on the surface of liposomes. The entrapment efficiencies (EEs) of DHA were determined to be 92.87% ± 1.82% and 93.13% ± 2.40%, and the drug loading capacities (DLs) were 16.60% ± 0.27% and 16.63% ± 0.36% for PEG-LPs-DHA and SER-LPs-DHA, respectively (Figure 3C). It is worth noting that there were no significant differences in EE and DL between the two types of LPs, suggesting that the surface modification of SER did not impair the EE and DL of PEG-LPs. Moreover, the high EEs (>90%) of DHA in the two kinds of LPs indicated that the high hydrophobicity of DHA strongly interacted with the lipid bilayer, resulting in an efficient entrapment.
 |
Figure 3 Characterization of PEG-LPs-DHA and SER-LPs-DHA. Notes: (A) Particle size distribution and appearance of PEG-LPs-DHA and SER-LPs-DHA. (B) Transmission electron microscopy (TEM) images of PEG-LPs-DHA and SER-LPs-DHA. (C) Particle size, low polydispersity index (PDI), zeta potential, entrapment efficiency, and drug loading capacity of PEG-LPs-DHA and SER-LPs-DHA. (D) Storage stability of PEG-LPs-DHA and SER-LPs-DHA after 28 days of storage at 4°C. The results are expressed as a percentage of the entrapment efficiency and particle size of initial LPs. (E) Medium stability of PEG-LPs-DHA and SER-LPs-DHA after incubation in simulated gastric fluid (SGF, pH 1.2), simulated intestinal fluid (SIF, pH 6.8), or phosphate buffer saline (PBS, pH 7.4). The results are expressed as a percentage of the particle size of initial LPs. (F) In vitro release profiles of DHA from free DHA, PEG-LPs-DHA, and SER-LPs-DHA in SGF (pH 1.2) and SIF (pH 6.8) for 24 h. All data are means ± SDs (n = 3). |
Storage and Medium Stability of SER-LPs-DHA
To test storage stability, the physical stability of PEG-LPs-DHA and SER-LPs-DHA was evaluated by measuring EE and particle size at 1, 7, 14, and 28 days at 4°C. As shown in Figure 3D, after 28 days of storage, the changes in EE and particle size for the two kinds of LPs were both less than 6%, indicating that PEG-LPs-DHA and SER-LPs-DHA were stable for 28 days at 4°C. LPs by oral administration experience a complex gastrointestinal environment including low pH and various digestive enzymes before absorption. Thus, gastrointestinal stability is essential for oral LPs to maintain their efficacy. First, the stability of PEG-LPs-DHA and SER-LPs-DHA was investigated in simulated gastric fluid (SGF, pH 1.2) or simulated intestinal fluid (SIF, pH 6.8), respectively. As shown in Figure 3E, both LPs exhibited no significant changes in particle size after incubation in SGF for 4 h or SIF for 24 h at 37°C (P > 0.05). Second, the stability of the two LPs in PBS (pH 7.4) was also tested because the subsequent cell studies require the use of PBS to maintain the normal morphology and function of cells. After incubation in PBS for 4 h at 37°C, the particle sizes of the two LPs were both insignificantly different from that of the initial LPs. Based on the above results, PEG-LPs-DHA and SER-LPs-DHA could maintain a relatively complete structure in the gastrointestinal environment, ensuring intestinal uptake of intact nanocarriers.
In vitro Release Assay
The in vitro release profiles of DHA from free DHA, PEG-LPs-DHA, and SER-LPs-DHA in a continuous alternative release medium are displayed in Figure 3F. Free DHA was rapidly released in SGF (pH 1.2) and SIF (pH 6.8) and almost completely released at 12 h, with a cumulative release rate of 94.29%. After DHA was encapsulated, PEG-LPs-DHA and SER-LPs-DHA exhibited similar sustained drug release behavior after incubation with SGF for 2 h and SIF for another 22 h at 37°C. During the first 2 h in SGF, more than 65% of DHA was released from free DHA, while only 18.22% and 12.02% of DHA were released from PEG-LPs-DHA and SER-LPs-DHA, respectively. After changing the release medium to SIF and incubation for another 22 h, the cumulative release rates of DHA from PEG-LPs-DHA and SER-LPs-DHA reached 54.68% and 48.71%, respectively, which were significantly less than that of free DHA. Consequently, both PEG-LPs-DHA and SER-LPs-DHA could inhibit the burst release of DHA under acidic conditions and thus keep DHA stable before intestinal absorption.
Cytotoxicity and Cellular Uptake Efficiency of SER-LPs
Many currently available data appear to confirm that oral liposomes have excellent biocompatibility and cell affinity for cells and tissues. However, a toxicity study on intestinal epithelial cells is necessary for such a novel biochemical mimetic liposome formulation. In this study, the cytotoxicity of PEG-LPs and SER-LPs in Caco-2 cells was investigated using a cell counting kit-8 (CCK-8) assay. As shown in Figure S1, the cell viability after 24 h of incubation with the two blank LPs at Lipoid E80 concentrations of 0.01–0.20 mg/mL was near 100%. The results demonstrated that PEG-LPs and SER-LPs at predetermined concentrations and incubation times did not significantly affect the biological activity of Caco-2 cells.
To assess the cellular uptake efficiency of SER-LPs in Caco-2 cells, the fluorescent dye Dil, flow cytometry (FCM), and confocal laser scanning microscopy (CLSM) were applied. Dil-PEG-LPs, as unmodified liposomes, were used as a comparison. As shown in Figure 4A and B, the cellular uptake of Dil-PEG-LPs and Dil-SER-LPs increased significantly with prolonged incubation time, reaching a plateau after 4 h of incubation. Quantitative results showed that the fluorescence intensity of the Dil-SER-LPs group was 1.25-fold as compared with that of the Dil-PEG-LPs group after incubation for 4 h. In addition, Caco-2 cells were cultured at 4°C or treated with sodium azide (an ATPase inhibitor) to study whether the cellular uptake of the two LPs was an energy-dependent process. As shown in Figure S2, the fluorescence intensities of the Dil-PEG-LPs group and Dil-SER-LPs group treated with the two incubation conditions mentioned above were dramatically lower than those of the control group. These results indicated that the internalization processes of both Dil-PEG-LPs and Dil-SER-LPs in Caco-2 cells depend on time- and energy-dependent endocytic pathways. In addition, the intracellular distribution of Dil-PEG-LPs and Dil-SER-LPs in Caco-2 cells was observed by CLSM. Compared with the Dil-PEG-LPs group, the Dil-SER-LPs group showed a stronger red fluorescence signal around the nucleus of Caco-2 cells (Figure 4C), which was consistent with the FCM results. Based on these results, the improvement of cellular internalization efficiency from Dil-SER-LPs could be attributed to the modification of SER on the surface of liposomes.
 |
Figure 4 Cellular uptake profiles of PEG-LPs and SER-LPs. Notes: (A and B) Flow cytometric profiles and fluorescence intensity of Dil-PEG-LPs and Dil-SER-LPs in Caco-2 cells after incubation for various time intervals at 37°C. Data are means ± SDs (n = 3). (C) CLSM images of the cellular uptake of Dil-PEG-LPs and Dil-SER-LPs (red signal) in Caco-2 cells at 37°C after incubation for 4 h. Cell nuclei were stained with DAPI (blue signal). |
Endocytosis and Exocytosis Pathways of SER-LPs
To better clarify the endocytosis mechanism of SER-LPs, clathrin-mediated endocytosis inhibitors (chlorpromazine hydrochloride, CPZ), caveolae-mediated endocytosis inhibitor (methyl-β-cyclodextrin, MβCD), dynamin inhibitor (dynasore), and macropinocytosis inhibitor (ethylisopropylamiloride, EIPA) were added separately to the Caco-2 cells before treatment with Dil-PEG-LPs or Dil-SER-LPs. As shown in Figure 5A, compared with control, CPZ, MβCD, and EIPA dramatically inhibited the cellular uptake of Dil-PEG-LPs to 72.3%, 72.4%, and 65.0%, respectively, proving that clathrin-mediated, caveolae-mediated, and macropinocytosis endocytosis were all involved for the internalization of Dil-PEG-LPs in Caco-2 cells. For Dil-SER-LPs, endocytosis was inhibited by MβCD and EIPA to different extents (34.5% and 75.0% compared with the control), suggesting that macropinocytosis endocytosis is a minor pathway in the internalization of Dil-SER-LPs compared to caveolae-mediated endocytosis. Notably, the internalization of Dil-PEG-LPs obviously decreased in the presence of CPZ, while no effect was observed on the cellular uptake of Dil-SER-LPs. In addition, the distinct difference between Dil-PEG-LPs and Dil-SER-LPs uptake was further confirmed by treatment with sucrose, another inhibitor of clathrin-mediated endocytosis. These results demonstrated that the surface modification of SER altered the endocytosis process of PEG-LPs away from the clathrin-mediated pathway. It is reasonable that a prominent decrease in the cellular uptake of both Dil-PEG-LPs and Dil-SER-LPs (43.5% and 41.3% compared with control) was observed with the addition of dynasore because dynasore can effectively inhibit the function of dynamin, which is essential for both clathrin- and caveolae-mediated endocytosis. In summary, these results demonstrated that the internalization of Dil-SER-LPs into Caco-2 cells primarily relies on the caveolae-mediated endocytosis pathway.
 |
Figure 5 Endocytosis and exocytosis pathways of SER-LPs. Abbreviation: ns, no significant difference. Notes: (A) Impacts of various endocytosis inhibitors on the internalization of Dil-PEG-LPs and Dil-SER-LPs in Caco-2 cells. Data are means ± SDs (n = 3). *P < 0.05, **P < 0.01, ***P < 0.001, compared with the control. (B) Impacts of various transport inhibitors on the exocytosis of Dil-PEG-LPs and Dil-SER-LPs in Caco-2 cells. Data are means ± SDs (n = 3). *P < 0.05, **P < 0.01, ***P < 0.001, compared with the control. (C) Impacts of various transport inhibitors on the transportation of Dil-PEG-LPs and Dil-SER-LPs across Caco-2 cell monolayers via the apical or the basolateral membrane. Data are means ± SDs (n = 3). *P < 0.05, **P < 0.01, ***P < 0.001, compared with the control. (D) Papp values of DHA from free DHA, Dil-PEG-LPs, and Dil-SER-LPs at predetermined time points in Caco-2 cell monolayers. Data are means ± SDs (n = 3). **P < 0.01, ***P < 0.001, compared with SER-LPs-DHA. (E) CLSM images of the colocalization of Dil-PEG-LPs and Dil-SER-LPs (red signal) with different organelles (green signal) in Caco-2 cells. The yellow dots in the merged images indicate the colocalization of Dil-PEG-LPs and Dil-SER-LPs with the different organelles. (F) Schematic illustration of the internalization and transport pathway regulation effect of SER surface modification in Caco-2 cells. |
After internalization into the cytoplasm via the vesicle-mediated pathway, nanocarriers such as liposomes and nanoparticles usually fuse with early endosomes, and then they are transported out of the cells through a series of organelles.49,50 One possible transport route is that nanocarriers are delivered to lysosomes from early endosomes for degradation because lysosomes are digestive organelles containing various hydrolytic enzymes. Bafilomycin A1, a specific vacuolar-type H(+)-ATPase inhibitor that hinders the maturation process of early endosomes to lysosomes,51 was applied to confirm the role of lysosomes in the exocytosis of SER-LPs. As shown in Figure 5B, the number of Dil-PEG-LPs and Dil-SER-LPs remaining in the Caco-2 cells exhibited a significant 0.70-fold and 0.44-fold increase compared with the control with the addition of bafilomycin A1, indicating that the maturation process of early endosomes to lysosomes had an obvious effect on the exocytosis process of Dil-SER-LPs and especially, Dil-PEG-LPs. The different inhibitory extent of exocytosis caused by bafilomycin A1 between Dil-PEG-LPs and Dil-SER-LPs might be attributed to the difference in endocytosis pathways. Dil-PEG-LPs internalized into Caco-2 cells through clathrin-mediated endocytosis preferred lysosomes.21,49,50,52 In addition to lysosomal degradation, another intracellular transport fate for nanocarriers is exocytosis, which usually involves both the endoplasmic reticulum (ER) and Golgi apparatus. Brefeldin A, an inhibitor of intracellular vesicle-dependent secretory transport, is used to block the pathway from the ER to the Golgi apparatus. Monensin has been reported to disrupt the function of the Golgi apparatus and then inhibit intracellular transport from the Golgi apparatus to the cell membrane. Compared with the control group, brefeldin A and monensin dramatically increased the intracellular number of Dil-PEG-LPs and Dil-SER-LPs, revealing that both the ER and Golgi apparatus played a critical role in the intracellular transport of both Dil-PEG-LPs and Dil-SER-LPs. Lomitapide, a microsomal triglyceride transfer protein (MTP) inhibitor that blocks the MTP-mediated synthesis of intestinal chylomicrons,53 was selected in this study to elucidate the relationship between SER-LPs and the chylomicron pathway in Caco-2 cells. Surprisingly, the intracellular retention of Dil-PEG-LPs and Dil-SER-LPs in Caco-2 cells was enhanced remarkably (1.85-fold and 2.56-fold compared with the control, respectively) with the addition of lomitapide, indicating that the chylomicron pathway was also utilized by both Dil-LPs, especially Dil-SER-LPs.
During nanocarriers transport across the intestinal epithelial cells, the internalized nanocarriers were discharged via the apical or basolateral membrane. For further illustrating the intracellular transport pathways of Dil-PEG-LPs and Dil-SER-LPs, the Caco-2 cell monolayers model was established and the impact of various transport inhibitors (including bafilomycin A1, brefeldin A, monensin, and lomitapide) on the discharge via both membrane sides was investigated in accordance with the exocytosis pathway studies (Figure 5C). It was observed that bafilomycin A1 had a significant impact on the discharge of Dil-PEG-LPs to both apical and basolateral sides, but a minor impact on the discharge of Dil-SER-LPs. Brefeldin A and monensin obviously inhibited the discharge of the two Dil-LPs via both membrane sides. These results were in accordance with the exocytosis results of the two Dil-LPs in Caco-2 cells, which provided further confirmation that the ER and Golgi apparatus were vital organelles in the discharge process of the two Dil-LPs from the Caco-2 cell monolayers. Following lomitapide’s suppression of the chylomicron assembly process, there was a notable decrease in the amount of the two Dil-LPs on the apical or basolateral sides, confirming that the chylomicron pathway had a vital effect on the exocytosis in the Caco-2 cell monolayers. As demonstrated in the results of exocytosis pathways, the intracellular trafficking of Dil-PEG-LPs and Dil-SER-LPs in Caco-2 cells and Caco-2 cell monolayers was intricate and mediated by several pathways. The lysosomal, ER, and Golgi apparatus all played crucial regulatory roles in controlling how the two Dil-LPs were exocytosed. It has been reported that the ER/Golgi apparatus route participates in the assembly and secretion of chylomicron. Therefore, the intracellular transport of Dil-PEG-LPs and Dil-SER-LPs both shared the chylomicron pathway.
To explore the potential of PEG-LPs and SER-LPs to improve trans-epithelial efficiency, the Caco-2 cell monolayers were incubated with free DHA, PEG-LPs-DHA, and SER-LPs-DHA for 4 h, and the concentration of DHA in the basolateral side was determined by HPLC‒MS/MS. The results of Figure 5D indicate that at all sampling points, the apparent permeability coefficient (Papp) value of the SER-LPs-DHA group was considerably higher than that of the free DHA group (P < 0.001) and the PEG-LPs-DHA group (P < 0.01). At 2 h, the Papp value of the SER-LPs-DHA group was 4.08- and 1.57-fold as compared with the free DHA group and the Dil-PEG-LPs group, respectively. Moreover, the transport ratio of DHA in the three groups all showed time-dependent behavior (Figure S3). After 4 h of incubation, the transport ratio of the SER-LPs-DHA group reached approximately 25.1%, which was 4.29- and 1.65-fold higher than that of the free DHA group and the Dil-PEG-LPs group, respectively. During the entire process of transport experiment, the TEER value of the Caco-2 cell monolayers was measured and exhibited unchanged, which indicated that the two LPs had no effects on the integrity of the Caco-2 cell monolayers (Figure S4).54 The transportation of SER-LPs-DHA to the basolateral side was clearly confirmed by the TEM image shown in Figure S5. SER-LPs-DHA still displayed a spherical shape (~70 nm) and maintained the core-shell structure which proved that SER-LPs transported crossing the Caco-2 cell monolayers remained intact. The Papp and transport ratio results of PEG-LPs-DHA and SER-LPs-DHA were consistent with the cellular uptake efficiency results presented in Figure 4B, where SER-LPs could remarkably enhance the trans-epithelial efficiency of DHA compared with PEG-LPs.
To further test the intracellular pathway results of Dil-PEG-LPs and Dil-SER-LPs above, the intracellular destinations including lysosomal, ER, and Golgi apparatus in Caco-2 cells were stained, and the colocalization between these organelles and LPs was observed by CLSM. Figure 5E displays fluorescence-labeled structures in Caco-2 cells, where the green color represents organelles, and the red color represents the two Dil-LPs. The yellow dots in the merged CLSM images are the colocalization of fluorescence-labeled organelles and Dil-LPs. The clear distribution of Dil-PEG-LPs and Dil-SER-LPs within the ER and Golgi apparatus is shown in Figure 5E, thus confirming the actual transport of both Dil-PEG-LPs and Dil-SER-LPs to the ER and Golgi apparatus. In addition, rare colocalization of Dil-SER-LPs with lysosomes was observed, while a large number of Dil-PEG-LPs were observed on lysosomes, revealing that lysosomes are a specific destination for Dil-PEG-LPs. The CLSM images qualitatively support the results of the endocytosis and exocytosis pathways mentioned above.
Taken together, the uptake and transport pathways of PEG-LPs and SER-LPs in Caco-2 cells are shown in Figure 5F. The cellular uptake of PEG-LPs and SER-LPs both depended on time- and energy-dependent endocytosis. Similar to conventional nanocarriers, the internalization of PEG-LPs involves multiple endocytic pathways including clathrin-mediated, caveolae-mediated, and macropinocytosis endocytosis. With the surface modification of SER, SER-LPs are transported primarily through the caveolae-mediated endocytosis pathway but do not rely on the clathrin-mediated endocytosis pathway. After uptake and fusion with early endosomes, PEG-LPs and SER-LPs were further transported to distinct subsequent destinations. PEG-LPs were preferred in lysosomes through clathrin-mediated endocytosis. These early endosomes containing SER-LPs were usually transported to the ER and then onward to the Golgi apparatus. Within the ER/Golgi apparatus route, SER-LPs integrate in the chylomicron assembly process and participate into the excretion of chylomicrons from cells.
Biodistribution of SER-LPs in the Intestinal Tract and MLNs
The in vivo biodistribution of LPs in the intestinal tract was investigated after the oral administration of DiR solution, DiR-PEG-LPs, and DiR-SER-LPs, and the entire intestinal tract was removed at predetermined time points (1, 2, 4, and 6 h) to obtain ex vivo fluorescence images by an In-Vivo Imaging System. As shown in Figure 6A, the fluorescence signals of all groups could be observed in all segments of the intestine tract after oral administration for 1 h. At 4 h, both the DiR-PEG-LPs group and DiR-SER-LPs group exhibited stronger fluorescence signals, while the fluorescence signal of the free DiR group quickly faded without protection from LPs. Until 6 h, the fluorescence signals of the free DiR group and DiR-PEG-LPs group almost completely disappeared, but there was still an intense fluorescence signal of the DiR-SER-LPs group in the middle part of the intestinal tract. The quantification evaluation of the fluorescence signals in the intestinal tract further revealed that the fluorescence intensity was highest at 1 h for all groups and gradually decreased over time (Figure 6B). In addition, the fluorescence intensity of DiR-SER-LPs was significantly higher than that of free DiR and DiR-PEG-LPs at all time points observed. The above results demonstrated that SER-LPs could notably enhance the retention and adhesion in the intestinal tract.55
 |
Figure 6 Biodistribution of SER-LPs in the intestinal tract. Abbreviation: ns, no significant difference. Notes: (A) Ex vivo fluorescence images of the distribution of DiR, DiR-PEG-LPs, and DiR-SER-LPs in the intestinal tract after oral administration at predetermined time points. (B) The quality of DiR, DiR-PEG-LPs, and DiR-SER-LPs remained in the intestinal tract. Data are means ± SDs (n = 3). *P < 0.05, **P < 0.01, compared with DiR-SER-LPs. (C) CLSM images of Dil, Dil-PEG-LPs, and Dil-SER-LPs (red signal) in duodenum, jejunum, ileum, and colon sections after oral administration for 4 h. Cell nuclei were stained with DAPI (blue signal). |
To further investigate the permeation of LPs in various segments of the intestinal tract, sections of intestinal segments (duodenum, jejunum, ileum, and colon) were stained with DAPI and observed by CLSM. The Dil solution was chosen as a negative control and the time point was set to 4 h after oral administration. As shown in Figure 6C, the blue signal is the nucleus, while the red signal represents the free Dil or Dil-LPs. Red fluorescence signals could be observed on the surface of the intestinal mucosa in the entire intestinal tract for all groups. Consistent with the results of ex vivo fluorescence images, the fluorescence signals from the Dil-PEG-LPs group and Dil-SER-LPs group were much higher than those from the free Dil group in every segment. Importantly, compared with free Dil and Dil-PEG-LPs, much more intense fluorescence signals were observed in the inner intestinal villi of the duodenum and jejunum segment treated by Dil-SER-LPs. The villi lacteals located at the center of the intestinal villi are part of the lymphatic system and collect chylomicrons secreted from the intestinal epithelial cells.56–58 The results revealed that SER-LPs, as a 2-MAG mimetic, might be involved in the assembly process of chylomicrons, and then transported into the intestinal lymphatic vessels.
Lymphatic transport was further validated by the MLNs distribution. As shown in Figure 7A and B, large amounts of DiR-PEG-LPs and DiR-SER-LPs accumulated in the MLNs, while a rare fluorescence signal was observed in the free DiR group. The fluorescence intensity in the MLNs from the DiR-SER-LPs group was higher than that in MLNs from the DiR-PEG-LPs group at all time points observed. For both DiR-LPs groups, the fluorescence intensity in the MLNs showed a trend of first increasing and then decreasing gradually, and the maximum value was obtained at 2 h. After oral administration of DiR-PEG-LPs for 4 h, the fluorescence signal in the MLNs was obviously reduced, while that in MLNs from the DiR-SER-LPs group was still maintained at a high level. The quantification evaluation of the fluorescence signals in the MLNs showed that SER-LPs exhibited a significantly increased accumulation in the MLNs by 0.94-fold compared with PEG-LPs at 4 h. The fluorescence distribution of orally administered free Dil, Dil-PEG-LPs, and Dil-SER-LPs for 4 h in the MLNs was also evaluated by CLSM (Figure 7C). The red fluorescence signal in the MLNs from the Dil-PEG-LPs group was weaker than that in the MLNs from the Dil-SER-LPs group, and the red fluorescence signal in the MLNs from the free Dil group was negligible. After pretreatment with cycloheximide (CHX), the red fluorescence signal in the MLNs from the Dil-SER-LPs group obviously weakened, which might be attributed to interference with the secretion process of chylomicrons by CHX.59 Interestingly, no significant change in the red fluorescence signal in the MLNs was observed for the Dil-PEG-LPs group. This result could be explained by the fact that PEG-LPs were mainly ferried by M cells, absorbed at Payer’s patches, and finally carried to MLNs.59–61 Taken together, these results suggested that SER-LPs could enhance drug permeation through the intestinal epithelial cells, promote drug accumulation within the lymphatic system via the chylomicrons transport pathway, and deliver drugs directly into the systemic circulation bypass the liver.
 |
Figure 7 Biodistribution of SER-LPs in MLNs. Abbreviation: ns, no significant difference. Notes: (A) Ex vivo fluorescence images of the distribution of DiR, DiR-PEG-LPs, and DiR-SER-LPs in MLNs after oral administration at predetermined time points. (B) The quality of DiR, DiR-PEG-LPs, and DiR-SER-LPs accumulated in MLNs. Data are means ± SDs (n = 3). *P < 0.05, **P < 0.01, ***P < 0.001, compared with DiR-SER-LPs. (C) CLSM images of Dil, Dil-PEG-LPs, and Dil-SER-LPs (red signal) in MLNs after oral administration for 4 h. To block intestinal lymphatic transport, rats were intraperitoneally pretreated with a dose of 3.0 mg/kg CHX 1 h prior to drug administration. Cell nuclei and intercellular tight junction were stained with DAPI (blue signal) and Anti-ZO-1/FITC (green signal). |
Pharmacokinetic Study and Intestinal Lymphatic Transport Inhibition Study of SER-LPs
A comparative pharmacokinetic study was carried out on DHA suspension, PEG-LPs-DHA, and SER-LPs-DHA in SD rats. Concentrations of DHA were analyzed in rat plasma after a single oral administration. The main pharmacokinetic parameters of the three groups are presented in Table 1, and the mean plasma concentration-time curves of DHA are shown in Figure 8A. As reported in our previous study, DHA suspension (free DHA) exhibited poor AUC0~24 (196.87 ± 27.09 ng/mL*h) and Cmax (226.77 ± 38.18 ng/mL) after oral administration. PEG-LPs-DHA showed increased AUC0~24 and Cmax by 4.25-fold and 0.27-fold, respectively, compared with free DHA. These results indicated that the PEG-modified liposome formulation could markedly enhance the oral absorption of DHA. The reasonable explanation for the improvement was that the liposome formulation was able to enhance the poor solubility of DHA in the GI fluid and improve the transcellular permeability in the intestine.60,62 More importantly, the AUC0~24 and Cmax of DHA in the SER-LPs-DHA group exhibited a significant 1.17-fold and 1.08-fold increase compared with those in the PEG-LPs-DHA group, respectively, which demonstrated that the 2-MAG mimetic liposomes (SER-LPs) construction by modifying SER on the surface of PEG-LPs could further improve the oral bioavailability of DHA by promoting intestinal lymphatic transport. In addition, the orally administered DHA suspension group exhibited rapid absorption with a Tmax of 0.45 h, whereas the PEG-LPs-DHA group and SER-LPs-DHA group exhibited a similar pharmacokinetic behavior but prolonged Tmax of 0.95 h and 1.15 h. The prolonged action time of DHA in the PEG-LPs-DHA group and SER-LPs-DHA group could be derived from the delayed release from the liposomes, as one might predict based on findings of the same in the above in vitro release study.63 Similarly, the MRT0-24 (5.60 h and 6.44 h) of the PEG-LPs-DHA group and SER-LPs-DHA group were delayed to a large extent compared with that of the DHA suspension group (2.93 h), which suggested that the liposome formulation could decrease the elimination rates of DHA.64,65
 |
Table 1 Pharmacokinetic Parameters of DHA in Rats After Oral Administration of DHA Suspension or LPs-DHA (Means ± SDs, n = 5) |
 |
Figure 8 Pharmacokinetic study and intestinal lymphatic transport inhibition study of SER-LPs. Notes: (A) Plasma concentrations of DHA in rats after a single oral administration of DHA, PEG-LPs-DHA, and SER-LPs-DHA at a dose of 10 mg/kg DHA. Data are means ± SDs (n = 5). (B) Intestinal lymphatic transport inhibition study of SER-LPs-DHA. To block intestinal lymphatic transport, rats were intraperitoneally pretreated with 3.0 mg/kg CHX 1 h prior to drug administration. Data are means ± SDs (n = 4). *P < 0.05, ***P < 0.001. |
2-MAG is the hydrolysis product of TG in the intestinal tract and is mainly absorbed by the intestinal lymphatic transport pathway. To further validate the transport mechanism of 2-MAG mimetic liposomes (SER-LPs), CHX (3.0 mg/kg), an inhibitor of lymphatic transport through blocking the secretion process of chylomicrons in enterocytes, was pretreated in rats before oral administration of DHA suspension, PEG-LPs-DHA, and SER-LPs-DHA. As shown in Figure 8B, the AUC0~8 and Cmax of DHA in CHX pretreated rats were significantly decreased by 70.49% and 50.33%, respectively, after oral administration of SER-LPs-DHA. The AUC of DHA in the PEG-LPs-DHA group was reduced by 27.40% because PEG-LPs, as a lipid-based formulation, could partly increase intestinal lymphatic transport. In contrast, there was little influence on the AUC0~8 and Cmax of DHA after oral administration of the DHA suspension by CHX pretreatment. These results indicated that SER-LPs preferred the chylomicron assembly process in enterocytes and then tended to be transported through the intestinal lymphatic pathway. Due to the lack of SER for superficial modification, the ability of PEG-LPs to target the intestinal lymphatic transport pathway was obviously reduced, while free DHA was absorbed into systemic circulation via the portal vein transport pathway.
Based on the results of the pharmacokinetic study and transport mechanism study, we could summarize the following three factors to explain the improved bioavailability of SER-LPs. (1) Encapsulating hydrophobic drugs into the liposome formulation could improve the solubility of drugs and protect drugs against possible degradation from the harsh physiological pH of the stomach as well as gastrointestinal digestive enzymes.66 (2) 2-MAG mimetic superficial modification combined with a lipid-based formulation such as liposomes could markedly promote intestinal lymphatic transport by assembling into chylomicron and then delivering drugs directly into the systemic circulation, thus avoiding first-pass hepatic metabolism. (3) SER-LPs with small particle size (<100 nm) could be absorbed by M cells in Peyer’s patches in the intestinal tract and then enter into the lymphatics surrounding Peyer’s patches,67,68 thus the M cell-to-lymphatics pathway also played an important role in the lymphatic transport.69
In vivo Safety Evaluation of SER-LPs
The in vivo safety evaluation of nanocarriers is necessary for their future clinical applications. In this work, we systematically investigated the toxicity of SER-LPs in healthy ICR mice under repeated oral administration. No death or unusual behaviors of the mice were observed during the 15 days of oral administration. The body weights of mice in both the SER-LPs and SER-LPs-DHA groups increased slightly over time, similar to the normal saline group (Figure 9A). Histopathological and hematological examinations in the main organs were then carried out to ensure that SER-LPs were safe. The gastrointestinal tract is the main site for the body to absorb oral DDS; thus, gastrointestinal safety is primarily considered. The H&E staining results (Figure 9B) showed that no obvious histopathological lesions or hyperemia were observed in the stomach, duodenum, or colon after oral administration of SER-LPs and SER-LPs-DHA. Similarly, both the SER-LPs and SER-LPs-DHA groups showed no histopathological changes in other organs, including the heart, liver, spleen, lung, and kidney, compared with the normal saline group (Figure 9C). Additionally, the levels of serum ALT, AST, AKP, CRE, and BUN in the three groups were all in the normal range and were not significantly different, indicating that SER-LPs did not cause damage to the liver and kidney (Figure S6). Overall, these results demonstrated that this novel 2-MAG mimetic liposomes (SER-LPs) exhibited no systemic toxicity in vivo and could be used for oral administration.
 |
Figure 9 In vivo safety evaluation of SER-LPs and SER-LPs-DHA. Notes: (A) The body weight changes of mice in 15 days after the oral administration of normal saline, SER-LPs, and SER-LPs-DHA at a dose of 15 mg/kg DHA. Data are means ± SDs (n = 6). (B and C) Hematoxylin and eosin (H&E) staining images (40×) of tissue sections from stomach, duodenum, colon, heart, liver, spleen, lung, and kidney after the oral administration of normal saline, SER-LPs, and SER-LPs-DHA at a dose of 15 mg/kg DHA. |
Conclusion
In summary, an innovative and convenient biomimetic liposome formulation named SER-LPs was successfully developed as a 2-MAG mimetic nanocarrier, which markedly promoted DHA intestinal lymphatic transport and enhanced the oral bioavailability of DHA. SER-LPs with high DHA encapsulation efficiency exhibited excellent stability under the simulated GI environment before intestinal absorption and prevented the premature release of DHA in the GI tract. In addition, 2-MAG mimetic superficial modification combined with lipid-based liposomes facilitated the improvement of intestinal lymphatic transport via the lipid absorption pathway and then delivered DHA directly into the systemic circulation, thus avoiding the first-pass effect. Moreover, SER-LPs exhibited good tissue compatibility and could be used for oral administration. These findings suggested that the 2-MAG mimetic strategy applied in this study is an effective approach for other active substances with high hepatic metabolism or lymphatic system-targeting needs.
Acknowledgments
This work was supported by grants from the National Natural Science Foundation of China (82003698) and Applied Basic Research Project of Shanxi Province (202203021221190).
Disclosure
The authors report no conflicts of interest in this work.
References
1. Vishwakarma N, Jain A, Sharma R, et al. Lipid-based nanocarriers for lymphatic transportation. AAPS Pharm Sci Tech. 2019;20(2):83. doi:10.1208/s12249-019-1293-3
2. Qi J, Zhuang J, Lv Y, Lu Y, Wu W. Exploiting or overcoming the dome trap for enhanced oral immunization and drug delivery. J Control Release. 2018;275:92–106. doi:10.1016/j.jconrel.2018.02.021
3. Cheng H, Cui Z, Guo S, et al. Mucoadhesive versus mucopenetrating nanoparticles for oral delivery of insulin. Acta Biomater. 2021;135:506–519. doi:10.1016/j.actbio.2021.08.046
4. Zhang Z, Lu Y, Qi J, Wu W. An update on oral drug delivery via intestinal lymphatic transport. Acta pharmaceutica Sinica B. 2021;11(8):2449–2468. doi:10.1016/j.apsb.2020.12.022
5. Alderfer L, Hall E, Hanjaya-Putra D. Harnessing biomaterials for lymphatic system modulation. Acta Biomater. 2021;133:34–45. doi:10.1016/j.actbio.2021.06.006
6. Xia F, Fan W, Jiang S, et al. Size-dependent translocation of nanoemulsions via oral delivery. ACS Appl Mater Interfaces. 2017;9(26):21660–21672. doi:10.1021/acsami.7b04916
7. Yang X, Ma C, Chen Z, et al. Single small molecule-assembled nanoparticles mediate efficient oral drug delivery. Nano Res. 2019;12(10):2468–2476. doi:10.1007/s12274-019-2470-0
8. Wong KH, Yang D, Chen S, He C, Chen M. Development of nanoscale drug delivery systems of dihydroartemisinin for cancer therapy: a review. Asian J Pharm Sci. 2022;17(4):475–490. doi:10.1016/j.ajps.2022.04.005
9. Chen Y, Tao T, Wang W, Yang B, Cha X. Dihydroartemisinin attenuated the symptoms of mice model of systemic lupus erythematosus by restoring the Treg/Th17 balance. Clin Exp Pharmacol Physiol. 2021;48(4):626–633. doi:10.1111/1440-1681.13461
10. Zhang T, Zhang Y, Jiang N, et al. Dihydroartemisinin regulates the immune system by promotion of CD8(+) T lymphocytes and suppression of B cell responses. Sci China Life Sci. 2020;63(5):737–749. doi:10.1007/s11427-019-9550-4
11. Diao L, Tao J, Wang Y, Hu Y, He W. Co-delivery of dihydroartemisinin and HMGB1 siRNA By TAT-modified cationic liposomes through The TLR4 signaling pathway for treatment of lupus nephritis. Int J Nanomed. 2019;14:8627–8645. doi:10.2147/ijn.S220754
12. Bai B, Wu F, Ying K, et al. Therapeutic effects of dihydroartemisinin in multiple stages of colitis-associated colorectal cancer. Theranostics. 2021;11(13):6225–6239. doi:10.7150/thno.55939
13. Li Y, Pei Q, Cui B, et al. A redox-responsive dihydroartemisinin dimeric nanoprodrug for enhanced antitumor activity. J Nanobiotechnology. 2021;19(1):441. doi:10.1186/s12951-021-01200-z
14. Xu Y, Xiao L, Chen J, et al. α-Fe(2)O(3) based nanotherapeutics for near-infrared/dihydroartemisinin dual-augmented chemodynamic antibacterial therapy. Acta Biomater. 2022;150:367–379. doi:10.1016/j.actbio.2022.07.047
15. Liu G, Liu M, Li X, et al. Peroxide-simulating and GSH-depleting nanozyme for enhanced chemodynamic/photodynamic therapy via induction of multisource ROS. ACS Appl Mater Interfaces. 2023;15(41):47955–47968. doi:10.1021/acsami.3c09873
16. Su G, Xu H, Zhou F, et al. Boosting reactive oxygen species generation with a dual-catalytic nanomedicine for enhanced tumor nanocatalytic therapy. ACS Appl Mater Interfaces. 2023;15(51):59175–59188. doi:10.1021/acsami.3c13882
17. Dai X, Zhang X, Chen W, et al. Dihydroartemisinin: a potential natural anticancer drug. Int J Biol Sci. 2021;17(2):603–622. doi:10.7150/ijbs.50364
18. Chai L, Wang R, Wang Y, et al. Auto-induction of intestinal first-pass effect related time-dependent pharmacokinetics of artemisinin rather than dihydroartemisinin. J Pharm Sci. 2021;110(1):458–466. doi:10.1016/j.xphs.2020.09.023
19. Yan Y, Yang X, Han N, et al. Metal-organic framework-encapsulated dihydroartemisinin nanoparticles induces apoptotic cell death in ovarian cancer by blocking ROMO1-mediated ROS production. J Nanobiotechnology. 2023;21(1):204. doi:10.1186/s12951-023-01959-3
20. Managuli RS, Raut SY, Reddy MS, Mutalik S. Targeting the intestinal lymphatic system: a versatile path for enhanced oral bioavailability of drugs. Expert Opin Drug Deliv. 2018;15(8):787–804. doi:10.1080/17425247.2018.1503249
21. Mao Y, Feng S, Li S, et al. Chylomicron-pretended nano-bio self-assembling vehicle to promote lymphatic transport and GALTs target of oral drugs. Biomaterials. 2019;188:173–186. doi:10.1016/j.biomaterials.2018.10.012
22. Yáñez JA, Wang SW, Knemeyer IW, Wirth MA, Alton KB. Intestinal lymphatic transport for drug delivery. Adv Drug Deliv Rev. 2011;63(10–11):923–942. doi:10.1016/j.addr.2011.05.019
23. Elz AS, Trevaskis NL, Porter CJH, Bowen JM, Prestidge CA. Smart design approaches for orally administered lipophilic prodrugs to promote lymphatic transport. J Control Release. 2022;341:676–701. doi:10.1016/j.jconrel.2021.12.003
24. Lee JB, Zgair A, Malec J, et al. Lipophilic activated ester prodrug approach for drug delivery to the intestinal lymphatic system. J Control Release. 2018;286:10–19. doi:10.1016/j.jconrel.2018.07.022
25. Qin C, Chu Y, Feng W, et al. Targeted delivery of lopinavir to HIV reservoirs in the mesenteric lymphatic system by lipophilic ester prodrug approach. J Control Release. 2021;329:1077–1089. doi:10.1016/j.jconrel.2020.10.036
26. Mu H, Høy CE. The digestion of dietary triacylglycerols. Prog Lipid Res. 2004;43(2):105–133. doi:10.1016/s0163-7827(03)00050-x
27. Trevaskis NL, Kaminskas LM, Porter CJ. From sewer to saviour - targeting the lymphatic system to promote drug exposure and activity. Nat Rev Drug Discov. 2015;14(11):781–803. doi:10.1038/nrd4608
28. Huang L, Yang J, Wang T, Gao J, Xu D. Engineering of small-molecule lipidic prodrugs as novel nanomedicines for enhanced drug delivery. J Nanobiotechnology. 2022;20(1):49. doi:10.1186/s12951-022-01257-4
29. Hokkanen K, Tirronen A, Ylä-Herttuala S. Intestinal lymphatic vessels and their role in chylomicron absorption and lipid homeostasis. Curr Opin Lipidol. 2019;30(5):370–376. doi:10.1097/mol.0000000000000626
30. Julve J, Martín-Campos JM, Escolà-Gil JC, Blanco-Vaca F. Chylomicrons: advances in biology, pathology, laboratory testing, and therapeutics. Clin Chim Acta. 2016;455:134–148. doi:10.1016/j.cca.2016.02.004
31. Ahammed V, Narayan R, Paul J, et al. Development and in vivo evaluation of functionalized ritonavir proliposomes for lymphatic targeting. Life Sci. 2017;183:11–20. doi:10.1016/j.lfs.2017.06.022
32. Xia F, Chen Z, Zhu Q, et al. Gastrointestinal lipolysis and trans-epithelial transport of SMEDDS via oral route. Acta pharmaceutica Sinica B. 2021;11(4):1010–1020. doi:10.1016/j.apsb.2021.03.006
33. Ye J, Gao Y, Ji M, et al. Oral SMEDDS promotes lymphatic transport and mesenteric lymph nodes target of chlorogenic acid for effective T-cell antitumor immunity. J Immunother Cancer. 2021;9(7). doi:10.1136/jitc-2021-002753
34. Liao H, Gao Y, Lian C, et al. Oral absorption and lymphatic transport of baicalein following drug-phospholipid complex incorporation in self-microemulsifying drug delivery systems. Int J Nanomed. 2019;14:7291–7306. doi:10.2147/ijn.S214883
35. Cho HJ, Park JW, Yoon IS, Kim DD. Surface-modified solid lipid nanoparticles for oral delivery of docetaxel: enhanced intestinal absorption and lymphatic uptake. Int J Nanomed. 2014;9:495–504. doi:10.2147/ijn.S56648
36. Mirchandani Y, Patravale VB. Solid lipid nanoparticles for hydrophilic drugs. J Control Release. 2021;335:457–464. doi:10.1016/j.jconrel.2021.05.032
37. Khan S, Sharma A, Jain V. An overview of nanostructured lipid carriers and its application in drug delivery through different routes. Adv Pharm Bull. 2023;13(3):446–460. doi:10.34172/apb.2023.056
38. Yao M, Li Z, Julian mcclements D, Tang Z, Xiao H. Design of nanoemulsion-based delivery systems to enhance intestinal lymphatic transport of lipophilic food bioactives: influence of oil type. Food Chem. 2020;317:126229. doi:10.1016/j.foodchem.2020.126229
39. Singh Y, Meher JG, Raval K, et al. Nanoemulsion: concepts, development and applications in drug delivery. J Control Release. 2017;252:28–49. doi:10.1016/j.jconrel.2017.03.008
40. Wang X, Zhang C, Han N, et al. Triglyceride-mimetic prodrugs of scutellarin enhance oral bioavailability by promoting intestinal lymphatic transport and avoiding first-pass metabolism. Drug Deliv. 2021;28(1):1664–1672. doi:10.1080/10717544.2021.1960928
41. Miao YB, Xu T, Gong Y, et al. Cracking the intestinal lymphatic system window utilizing oral delivery vehicles for precise therapy. J Nanobiotechnology. 2023;21(1):263. doi:10.1186/s12951-023-01991-3
42. Lan HR, Zhang YN, Han YJ, et al. Multifunctional nanocarriers for targeted drug delivery and diagnostic applications of lymph nodes metastasis: a review of recent trends and future perspectives. J Nanobiotechnology. 2023;21(1):247. doi:10.1186/s12951-023-01990-4
43. Xiao C, Stahel P, Carreiro AL, Buhman KK, Lewis GF. Recent Advances in Triacylglycerol Mobilization by the Gut. Trends Endocrinol Metab. 2018;29(3):151–163. doi:10.1016/j.tem.2017.12.001
44. Ren G, Duan D, Wang G, et al. Construction of reduction-sensitive heterodimer prodrugs of doxorubicin and dihydroartemisinin self-assembled nanoparticles with antitumor activity. Colloids Surf B Biointerfaces. 2022;217:112614. doi:10.1016/j.colsurfb.2022.112614
45. Cai X, Miao J, Sun R, et al. Dihydroartemisinin overcomes the resistance to osimertinib in EGFR-mutant non-small-cell lung cancer. Pharmacol Res. 2021;170:105701. doi:10.1016/j.phrs.2021.105701
46. Guo XH, Ding F, Lian X, et al. The efficiency and mechanism of a new absorption enhancer, malic acid, for enhancing the oral bioavailability of docetaxel. Pharm Dev Technol. 2021;26(5):592–598. doi:10.1080/10837450.2021.1904259
47. Kang XJ, Wang HY, Peng HG, et al. Codelivery of dihydroartemisinin and doxorubicin in mannosylated liposomes for drug-resistant colon cancer therapy. Acta Pharmacol Sin. 2017;38(6):885–896. doi:10.1038/aps.2017.10
48. Stankovich S, Piner RD, Nguyen SBT, Ruoff RSJEL. Synthesis and exfoliation of isocyanate-treated graphene oxide nanoplatelets. Carbon. 2006;15. doi:10.1016/J.carbon.2006.06.004
49. Thottacherry JJ, Sathe M, Prabhakara C, Mayor S. Spoiled for choice: diverse endocytic pathways function at the cell surface. Annu Rev Cell Dev Biol. 2019;35:55–84. doi:10.1146/annurev-cellbio-100617-062710
50. Un K, Sakai-Kato K, Oshima Y, Kawanishi T, Okuda H. Intracellular trafficking mechanism, from intracellular uptake to extracellular efflux, for phospholipid/cholesterol liposomes. Biomaterials. 2012;33(32):8131–8141. doi:10.1016/j.biomaterials.2012.07.030
51. Zou Y, Gao W, Jin H, et al. Cellular uptake and transport mechanism of 6-mercaptopurine nanomedicines for enhanced oral bioavailability. Int J Nanomed. 2023;18:79–94. doi:10.2147/ijn.S394819
52. Li X, Jafari SM, Zhou F, et al. The intracellular fate and transport mechanism of shape, size and rigidity varied nanocarriers for understanding their oral delivery efficiency. Biomaterials. 2023;294:121995. doi:10.1016/j.biomaterials.2023.121995
53. Cefalù AB, D’Erasmo L, Iannuzzo G, et al. Efficacy and safety of lomitapide in familial chylomicronaemia syndrome. Atherosclerosis. 2022;359:13–19. doi:10.1016/j.atherosclerosis.2022.08.017
54. Bao X, Qian K, Xu M, et al. Intestinal epithelium penetration of liraglutide via cholic acid pre-complexation and zein/rhamnolipids nanocomposite delivery. J Nanobiotechnology. 2023;21(1):16. doi:10.1186/s12951-022-01743-9
55. Liu W, Han Y, Xin X, et al. Biomimetic and temporal-controlled nanocarriers with ileum transporter targeting for achieving oral administration of chemotherapeutic drugs. J Nanobiotechnology. 2022;20(1):281. doi:10.1186/s12951-022-01460-3
56. Bernier-Latmani J, Petrova TV. Intestinal lymphatic vasculature: structure, mechanisms and functions. Nat Rev Gastroenterol Hepatol. 2017;14(9):510–526. doi:10.1038/nrgastro.2017.79
57. Choe K, Jang JY, Park I, et al. Intravital imaging of intestinal lacteals unveils lipid drainage through contractility. J Clin Invest. 2015;125(11):4042–4052. doi:10.1172/jci76509
58. Johnson OW, Chick JF, Chauhan NR, et al. The thoracic duct: clinical importance, anatomic variation, imaging, and embolization. Eur Radiol. 2016;26(8):2482–2493. doi:10.1007/s00330-015-4112-6
59. Al Nebaihi HM, Davies NM, Brocks DR. Pharmacokinetics of cycloheximide in rats and evaluation of its effect as a blocker of intestinal lymph formation. Eur J Pharm Biopharm. 2023;193:89–95. doi:10.1016/j.ejpb.2023.10.016
60. Zhou A, Lu T, Wang L, et al. Lymphatic transport of puerarin occurs after oral administration of different lipid-based formulations to unconscious lymph duct-cannulated rats. Pharm Dev Technol. 2014;19(6):743–747. doi:10.3109/10837450.2013.829093
61. Zhou X, Ling K, Liu M, et al. Targeted delivery of cisplatin-derived nanoprecursors via a biomimetic yeast microcapsule for tumor therapy by the oral route. Theranostics. 2019;9(22):6568–6586. doi:10.7150/thno.35353
62. Yamazoe E, Fang JY, Tahara K. Oral mucus-penetrating PEGylated liposomes to improve drug absorption: differences in the interaction mechanisms of a mucoadhesive liposome. Int J Pharm. 2021;593:120148. doi:10.1016/j.ijpharm.2020.120148
63. Dhiman N, Sarvaiya J, Mohindroo P. A drift on liposomes to proliposomes: recent advances and promising approaches. J Liposome Res. 2022;32(4):317–331. doi:10.1080/08982104.2021.2019762
64. Righeschi C, Coronnello M, Mastrantoni A, et al. Strategy to provide a useful solution to effective delivery of dihydroartemisinin: development, characterization and in vitro studies of liposomal formulations. Colloids Surf B Biointerfaces. 2014;116:121–127. doi:10.1016/j.colsurfb.2013.12.019
65. Malik JA, Ansari JA, Ahmed S, et al. Nano-drug delivery system: a promising approach against breast cancer. Ther Deliv. 2023;14(5):357–381. doi:10.4155/tde-2023-0020
66. Nguyen TX, Huang L, Gauthier M, Yang G, Wang Q. Recent advances in liposome surface modification for oral drug delivery. Nanomedicine. 2016;11(9):1169–1185. doi:10.2217/nnm.16.9
67. He H, Xie Y, Lv Y, et al. Bioimaging of intact polycaprolactone nanoparticles using aggregation-caused quenching probes: size-dependent translocation via oral delivery. Adv Healthc Mater. 2018;7(22):e1800711. doi:10.1002/adhm.201800711
68. McCright J, Skeen C, Yarmovsky J, Maisel K. Nanoparticles with dense poly(ethylene glycol) coatings with near neutral charge are maximally transported across lymphatics and to the lymph nodes. Acta Biomater. 2022;145:146–158. doi:10.1016/j.actbio.2022.03.054
69. Zhou X, Zhang X, Han S, et al. Yeast microcapsule-mediated targeted delivery of diverse nanoparticles for imaging and therapy via the oral route. Nano Lett. 2017;17(2):1056–1064. doi:10.1021/acs.nanolett.6b04523
 © 2024 The Author(s). This work is published and licensed by Dove Medical Press Limited. The
full terms of this license are available at https://www.dovepress.com/terms.php
and incorporate the Creative Commons Attribution
- Non Commercial (unported, v3.0) License.
By accessing the work you hereby accept the Terms. Non-commercial uses of the work are permitted
without any further permission from Dove Medical Press Limited, provided the work is properly
attributed. For permission for commercial use of this work, please see paragraphs 4.2 and 5 of our Terms.
© 2024 The Author(s). This work is published and licensed by Dove Medical Press Limited. The
full terms of this license are available at https://www.dovepress.com/terms.php
and incorporate the Creative Commons Attribution
- Non Commercial (unported, v3.0) License.
By accessing the work you hereby accept the Terms. Non-commercial uses of the work are permitted
without any further permission from Dove Medical Press Limited, provided the work is properly
attributed. For permission for commercial use of this work, please see paragraphs 4.2 and 5 of our Terms.