")
Back to Journals » International Journal of Nanomedicine » Volume 19
A Novel Multi-Effect Photosensitizer for Tumor Destruction via Multimodal Imaging Guided Synergistic Cancer Phototherapy
Authors Sun K, Wang B, Li M, Ge Y, An L, Zeng D, Shen Y, Wang P, Li M, Hu X, Yu XA
Received 29 January 2024
Accepted for publication 12 June 2024
Published 24 June 2024 Volume 2024:19 Pages 6377—6397
DOI https://doi.org/10.2147/IJN.S461843
Checked for plagiarism Yes
Review by Single anonymous peer review
Peer reviewer comments 3
Editor who approved publication: Prof. Dr. Dongwoo Khang
Kunhui Sun,1,2,* Bing Wang,2,* Mengnan Li,2 Yanli Ge,1 Lijun An,2 Duanna Zeng,2 Yuhan Shen,1 Ping Wang,2 Meifang Li,2 Xuelei Hu,1 Xie-An Yu1,2
1Key Laboratory for Green Chemical Engineering Process of Ministry of Education, Hubei Key Laboratory of Novel Reactor and Green Chemical Technology, School of Chemical Engineering and Pharmacy, Wuhan Institute of Technology, Wuhan, People’s Republic of China; 2NMPA Key Laboratory for Bioequivalence Research of Generic Drug Evaluation, Shenzhen Institute for Drug Control, Shenzhen, People’s Republic of China
*These authors contributed equally to this work
Correspondence: Yanli Ge; Xie-An Yu, Email [email protected]; [email protected]
Background: How to ingeniously design multi-effect photosensitizers (PSs), including multimodal imaging and multi-channel therapy, is of great significance for highly spatiotemporal controllable precise phototherapy of malignant tumors.
Methods: Herein, a novel multifunctional zinc(II) phthalocyanine-based planar micromolecule amphiphile (ZnPc 1) was successfully designed and synthesized, in which N atom with photoinduced electron transfer effect was introduced to enhance the near-infrared absorbance and nonradiative heat generation. After simple self-assembling into nanoparticles (NPs), ZnPc 1 NPs would exhibit enhanced multimodal imaging properties including fluorescence (FL) imaging (FLI) /photoacoustic (PA) imaging (PAI) /infrared (IR) thermal imaging, which was further used to guide the combined photodynamic therapy (PDT) and photothermal therapy (PTT).
Results: It was that under the self-guidance of the multimodal imaging, ZnPc 1 NPs could precisely pinpoint the tumor from the vertical and horizontal boundaries achieving highly efficient and accurate treatment of cancer.
Conclusion: Accordingly, the integration of FL/PA/IR multimodal imaging and PDT/PTT synergistic therapy pathway into one ZnPc 1 could provide a blueprint for the next generation of phototherapy, which offered a new paradigm for the integration of diagnosis and treatment in tumor and a promising prospect for precise cancer therapy.
Keywords: multimodality imaging guided synergistic cancer phototherapy, FL/PA/IR multimodal imaging, PDT/PTT dual synergistic therapy pathway, Zn phthalocyanine derivant
Graphical Abstract:
Introduction
Cancer phototherapy (PT) is a non-invasive strategy that relies on photosensitizer (PS) to eradicate tumors with high spatial and temporal accuracy.1,2 Especially, the emergence of multifunctional PS significantly causes multimodal imaging mediated multi-channel therapy to achieving precise treatment for malignant tumors. Among them, multi-channel PT, including photodynamic therapy (PDT) and photothermal therapy (PTT), corresponds to the two perspectives of oxidative stress strategy and physical hyperthermia to synergistically destroy tumor cells.3–5 It is worth noting that PTT can also compensate for the oxygen dependence in PDT to enhance the overall treatment effect.6 Then, multimodal imaging addresses the need for high spatial and temporal precision in non-invasive PT, enabling multidimensional accurate positioning of tumors.7–9 Fluorescence (FL) imaging (FLI) and photoacoustic (PA) imaging (PAI) would provide real-time images with high intensity from both horizontal and vertical sections, respectively, while infrared (IR) thermal imaging would complement them from the perspective of photothermal temperature.10–12 Multimodal light imaging, combined different information from different imaging, has thus integrated the advantages of each technology for offering the comprehensive mapping including high spatial resolution and contrast for resulting in a more accurate judgments.13–15 Furtherly, photothermal agents could also simultaneously be used as contrast agents for PAI,16 which greatly promoted the integration of diagnosis and treatment of cancer. More importantly, it had been reported in the literatures that the supramolecular design through self-assembly of small molecules probe could function as a nano-platform, endowing PS with enhanced performance to expand the therapeutic effect of PT.17,18 It is therefore, rational to deduce that only an integrating multi-effect PS containing multimodal imaging and dual-mode non-invasive therapy (PTT and PDT) would provide a new paradigm to construct novel diagnosis and treatment platform for improving therapeutic effects on cancer.
Phthalocyanine, being widely studied and never outdated, has broad potential for functionalization to be applied to problems in multi-effect PSs with high spatiotemporal precision therapy, serving as a classic and universal parent nuclears for multifunctional PSs.19,20 Notably, increased efforts have been devoted to the design and development of molecular or nanostructured phthalocyanines transitioning from PDT to PTT PSs,21 where remarkable results have been acquired in preclinical studies, laying the foundation for the development of multifunctional PSs based on phthalocyanines. Among them, when the central ion is Zn2+, phthalocyanines present higher singlet oxygen quantum yield;22–24 while phthalocyanines with central ion Fe2+ exhibit a decrease in photosensitivity, resulting in stronger photothermal conversion efficiency.25 Pertinently, diamagnetic closed-shell metal ions (such as Zn2+) generally accompany or even enhance fluorescence effects, while paramagnetic open-shell metal ions (such as Fe2+) frequently cause fluorescence quenching, appearing new photoacoustic properties.26–29 This thus points to the change in the central metal ion of phthalocyanine, determining its different photophysical and photochemical properties.30–33 On the other hand, Li and colleagues introduced amino groups in the peripheral direction of the PS, thereby increasing its photothermal effect.34 This inspires us that the peripheral substituents containing photo-induced electron transfer (PET) effect groups could effectively inhibit the fluorescence emission and reactive oxygen species (ROS) generation, so as to also promote the transition of phthalocyanine PSs from PDT to PTT activity.35,36 However, in order to enhance the prospects of phthalocyanine applications for “integration” in therapeutic and diagnostic functions, there is an urgent requirement for more reasonable structural design. Therefore, an ideal balance is desperately needed to endow phthalocyanine with excellent performance in dual-pathway therapy and multimodal imaging, whereby the new generation of multifunctional PS would achieve new breakthroughs in integrated diagnosis and treatment.
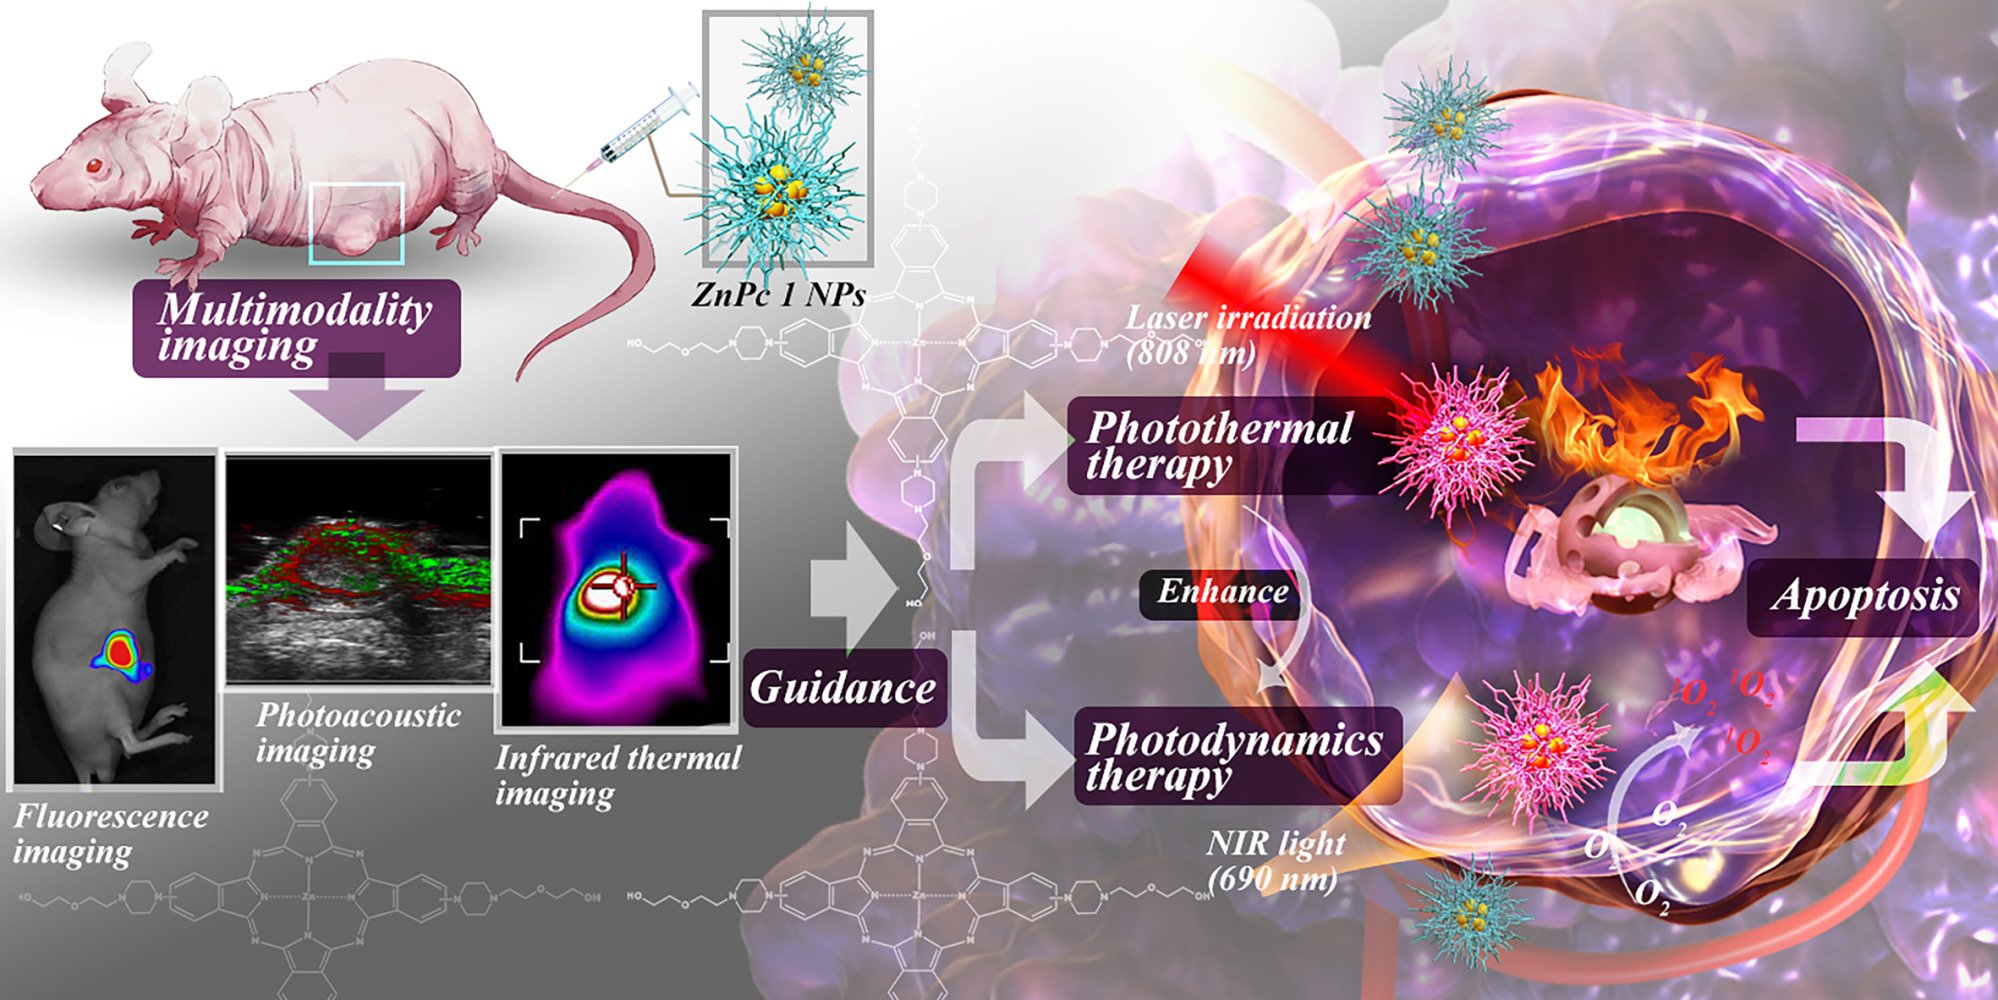
Following the scenario above, phthalocyanine was selected as the basic parent nucleus because of its high extinction coefficients and easy structural optimization to achieve various optical properties with simple chemical modification such as introducing the central metal and peripheral substituents. Based on these excellent features, a novel phthalocyanine-based planar micromolecule amphiphile (ZnPc 1) was successfully designed and synthesized with lipophilic zinc phthalocyanine (ZnPc) in the center and four piperazinyl side chains containing a PEG chain in the core periphery. Especially, the d10 closed-shell metal ion Zn2+ ensured PDT activity of ZnPc 1, which also enhanced fluorescence emission and reduced the energy required with the d-π transitions to prompt a red-shift of the absorption maximum (Q-Band).37 Indeed, due to the sp3 hybridization of the N atoms, N atoms were instead of the O atoms in most structures directly connected to ZnPc. This not only promoted an overall enhanced conjugation effect, causing the Q-band redshift, but also met the requirement of PET as an electron donor, improving PTT activity and further enhancing the PA performance of ZnPc.34,38 Additionally, the introduction of the PEG section promoted the hydrophilicity and biocompatibility of ZnPc,39,40 which further contributed to triggering the aggregation of phthalocyanine molecules, forming globular nanoparticles. In view of the amphiphilic character in its architecture, ZnPc 1 could spontaneously form as self-assembled ZnPc 1 NPs,41 which could not only enhance multimodal imaging for precisely pinpointing the tumor from the vertical and horizontal boundaries but also further amplify multi-channel therapy (PDT and PTT) effects to achieve highly efficient and accurate treatments of cancers (Scheme 1). Collectively, integrating a multi-effect PS with ZnPc as the core and connecting easily supramolecular side chains equipped with the PET effect (integrating one zinc atom, eight N atoms and four PEG chains) presented multimodal imaging (FLI, PAI and infrared (IR) thermal imaging) and multipathway treatment (PDT and PTT) for optical holographic stereoscopic diagnosis and treatment of tumors. Accordingly, a novel functional cancer phototherapy strategy was put forward for enhanced multifunctional therapy of tumors under the guidance of multimodality imaging via simple self-assembly of ZnPc 1, which provided a promising prospect for precise cancer phototherapy.
 |
Scheme 1 Schematic illustration an “integration” nano-formulation for PDT/PTT dual synergistic therapy pathway under the guidance of FL/PA/IR multimodal imaging. |
Materials and Methods
Materials and Agents
All chemical materials were reagent grade and the solvents were analytical grade, which could be used without further purification except for the special requirements for drying and degassing. 1-[2-(2-Hydroxyethoxy)ethyl]piperazine, 4-Nitrophthalonitrile, Zinc acetate (Zn(OAc)2), 1,8-Diazabicyclo[5.4.0]undec-7-ene (DBU), Zinc phthalocyanine (ZnPc) and 1.3-diphenylisobenzofuran (DPBF) were obtained from Aladdin Co. Ltd. (Shanghai, China). RPMI1640 media (Gibco), fetal bovine serum (FBS, Gibco), phosphate buffered saline (PBS, Gibco) and 0.25% Trypsin (Gibco) medium were used for cell culture. Cell Counting Kit-8 (CCK-8) was purchased from Shanghai Biyuntian Biotechnology Co., Ltd. CM-H2DCFDA, LysoTracker Red, MitoTracker Green, Hoechst 33,342 and LIVE/DEADTM viability/cytotoxicity kit (Green/Deep Red) were obtained from Invitrogen (ThermoFisher Scientific, USA). Ultrapure water was prepared using a Millipore Simplicity System (Millipore, Bedford, USA).1
Apparatus
H-NMR spectra were recorded with a Bruker AVANCE III 400 MHz spectrometer or a Bruker Ascend AVANCE III 600 MHz spectrometer. Mass spectra (MS) were performed using a Bruker Autoflex maX MALDI-TOF(TOF) Analyzer. The morphology of the ZnPc 1 NPs was examined with JEM-2100 transmission electron microscopy (TEM, Japan). A dynamic light scattering apparatus (ZS90; Malvern Instruments, Malvern, UK) was utilized to determine the size distribution and zeta potential. Fluorescence (FL) spectrum and ultraviolet spectrum were measured by an RF-5301PC spectrophotometer (Shimadzu, Japan) and a UV-2450 spectrophotometer (Shimadzu, Japan), respectively. Cell FL images were captured with a fluorescent microscope (Axio Observer 7; Zeiss, Germany). An infrared (IR) thermal imaging camera (FLIR E8, FLIR Systems) was applied to obtain the Real-time thermal imagings and Temperature data. The analysis of photoacoustic (PA) data were determined by the multimode small animal ultrasound/photoacoustic imaging system (Vevo LAZR-X; FujiFilm VisualSonics, Canada).
Synthesis
Synthesis of Intermediate 2
4-nitrophthalonitrile (1.7313 g, 0.010 mol) and Na2CO3 (1.0600 g, 0.010 mol) were added to the solution of 1-[2-(2-Hydroxyethoxy)ethyl]piperazine (2.0896 g, 0.012 mol) in anhydrous DMF (9.5 mL). The reaction mixture was stirred at 80°C for 72 h. Then, 50 mL of ice-cold saline was added under stirring, and the precipitates were filtered to give the yellow crude product. The crude product was purified by silica gel column chromatography using petroleum ether–dichloromethane (CH2Cl2)–Methanol (MeOH) (1: 0.01: 2, v/v/v) as the eluent and was dried under vacuum to obtain the desired compound as a pale-yellow solid in 67.63% yield (2.0300 g).1 H-NMR (400 MHz, Methanol-d4) δ 7.67 (d, J = 9.0 Hz, 1H, Ph-H), 7.40 (d, J = 2.7 Hz, 1H, Ph-H), 7.23 (dd, J = 9.3, 2.9 Hz, 1H, Ph-H), 3.67 (t, J = 5.5 Hz, 4H, -NCH2CH2OCH2CH2OH), 3.57–3.53 (m, 2H, -NCH2CH2O), 3.48–3.43 (m, 4H, PhN(CH2CH2)2N-), 2.67 (dt, J = 8.0, 5.4 Hz, 6H, PhN(CH2CH2)2NCH2CH2-). HRMS (ESI): m/z calcd. for C16H21N4O2 [M+H]+ 301.16645, found 301.16590.
Synthesis of ZnPc 1
A mixture of intermediate 2 (0.3002 g, 0.001 mol) and Zn(OAc)2 (0.055 g, 0.003 mol) in Anhydrous n-pentanol (8 mL) was heated to 100°C in an argon atmosphere. After the reactant was stirred for about 1 h until it was dissolved, DBU (0.1460 mL, 0.001 mol) was added dropwise to the reaction mixture, which was subsequently heated to 135°C and refluxed for 24 h. Then, the reaction mixture was cooled to room temperature in an argon atmosphere. Petroleum ether (50 mL) was added under stirring, and the precipitates were collected to give the dark green solid crude product. The crude product was washed with petroleum ether, different ratio of petroleum ether/ethyl acetate and methyl tert-butyl ether to remove low polarity impurities. The crude product was further purified by silica gel column chromatography using CH2Cl2-MeOH (60:1 to 25:1, v/v) as the eluent and was dried under vacuum to obtain a dark green solid powder in 8.97% yield (0.0280 g).1 H-NMR (600 MHz, DMSO-d6) δ 9.15 (d, J = 84.5 Hz, 1H, Pc), 8.81 (s, 1H, Pc), 7.71 (d, J = 36.1 Hz, 1H, Pc), 3.47 (d, J = 57.2 Hz, 10H, -PcN(CH2CH2)2NCH2CH2OCH2CH2OH), 2.61 (d, J = 71.9 Hz, 6H, -PcN (CH2CH2) 2NCH2CH2O-). MALDI-TOF MS: calcd for: 1264.564, found: 1264.794.
UV–Vis Absorption Spectra of ZnPc 1
Six test concentrations (5 μM, 4 μM, 3 μM, 2 μM, 1 μM, and 0.5 μM) were prepared by the stepwise dilution method with different solvents including DMSO, MeOH and water containing 0.1% DMSO. The UV–Vis absorption spectra of ZnPc 1 in corresponding solvents at room temperature were measured with a UV-2450 spectrophotometer by using corresponding solvents as blank reference.
FL Spectra of ZnPc 1
The test solutions of compounds ZnPc 1 at different concentrations (5 μM, 4 μM, 3 μM, 2 μM, 1 μM, and 0.5 μM) were prepared with different solvents including DMSO and MeOH by the stepwise dilution method, respectively. The FL emission spectra of ZnPc 1 at room temperature were collected at dual excitation wavelengths of 649 and 715 nm by using a Shimadzu RF 5301PC spectrofluorometer with the slit with setting as Ex = 5.0 and Em = 5.0, the emission wavelength was 733 nm. The FL quantum yield (φf) were determined in DMSO solution using ZnPc as the reference (φf = 0.20).42 The FL quantum yield (φf) of an unknown sample was calculated using Equation (1).18

where φf(ZnPc) was the FL quantum yield of ZnPc (φf(ZnPc) = 0.2 in DMSO), F(ZnPc1) and were the areas under the FL emission curves of the ZnPc 1 and ZnPc, respectively, where F(ZNPC1(EX=649nm))= 539.9515, F(ZNPC1(Ex=715nm))=1493.188, F(Znpc)= 8336.081.A(Znpc1) and A(Znpc) were the absorbances of the ZnPc 1 and ZnPc at the excitation wavelengths, respectively, where  = 0.01,
  = 0.0442, A(Znpc)= 0.0169. n(ZnPc1) and n(ZnPc) were the refractive indices of the solvents for ZnPc 1 and ZnPc, respectively. The FL quantum yield of ZnPc 1 (φf(ZnPc1)) was calculated to be φf(ZnPc1(Ex=649nm)) = 0.022, φf(ZnPc1(Ex=715nm)) = 0.014 following the obtained data and Equation (1).
In vitro Singlet Oxygen (1O2) Detection of ZnPc 1
DPBF was used as a capture agent of 1O2. ZnPc 1 (or ZnPc) was dissolved in DMSO to prepare a 3mL tested solution with a concentration of 0.2 μM, containing DPBF at a concentration of 40 μM. In the concurrent phase, ZnPc 1 (or ZnPc) free preparation only contains DPBF (40 μM) DMSO solution would be prepared to eliminate potential sequence error from DPBF. Finally, the tested solutions were irradiated with a 690 nm laser (0.2W/cm2) for 2 min, and the spectral changes of the solution would be recorded every 15s with a UV-2450 spectrophotometer in the range of 850–300 nm.
The 1O2 quantum yield of ZnPc 1 was calculated using Equation (2) with Zinc phthalocyanine (ZnPc) as a reference compound (ϕΔ(ZnPc)) = 0.67):42

where ϕΔ(ZnPc 1) and ϕΔ(ZnPc) denoted the 1O2 quantum yield of ZnPc 1 and ZnPc, respectively. K was a constant of photodegradation rate of DPBF in the presence of ZnPc 1 or ZnPc, respectively, where K(ZnPc1)= 0.0028, K(ZnPc)= 0.0015. And N was the absorption correction factor, which given by N=1-10−m, where N(ZnPc1)= 0.3034, N(ZnPc)= 0.1717. (m was the corresponding absorbance at irradiation wavelength (690 nm), where m(ZnPc1) = 0.157, m(ZnPc)= 0.0818.) The 1O2 quantum yield of ZnPc 1 (ϕ(ZnPc1)) was calculated to be (ϕ(ZnPc1)) = 0.71 following the obtained data and Equation (2).
In vitro Photothermal Performance of ZnPc 1
The aqueous solution of ZnPc 1 (2.0 mL) in a quartz cell with a series concentrations with the series proceeding from the lowest concentration to the highest (0, 50, 100, 200, 300 and 400 μg/mL) was irradiated via a 808 nm laser for 600 s at different power density values (0.75, 1.0, 1.25, 1.5, 1.75 W/cm2). Photothermal stability of ZnPc 1 was evaluated by exposing the ZnPc 1 (1.0 mL, 400 μg/mL) to a NIR laser (1.75 W/cm2) for five cycles. Also, DMSO without ZnPc 1 was used as a control sample to use in the calculation of photothermal conversion efficiency (PCE). During irradiation, the temperature and the thermal images at the 10th minute of the aqueous solutions were recorded every 30s by an IR thermal imaging camera (FLIR E8, FLIR Systems).
The PCE (η) was calculated according to Equation (3), according to a previously reported method:4

where TMax and Tsurr were the maximum temperature of the sample (48.0°C) and surrounding temperature (23.6°C), respectively, I was the laser power density value used (1.75 W/cm2), S A808 was the absorbance value of the sample at 808nm (0.1513), QDis was the heat change (Unit: W) of DMSO, h represented the heat transfer coefficient and s was the surface area of the container. The value of QDis could be determined separately by DMSO, while the value of hs could be calculated by formula (4):

where m was the mass of solution (1.1 g), CDMSO was the specific heat capacity of DMSO (1.95 J/g/°C), Ts(ZNPC1) was the time constant for heat transfer of the system. Ts(ZNPC1) could be calculated by formula (5):

Where, t was the time of the cooling process (Unit: s), θ was the thermal-driven constant, and T was the instant temperature at time t (Unit: °C). Therefore, Ts(ZNPC1)(213.01) could be obtained by linear fitting the cooling time and the negative value of Inθ.

Where TMax(DMSO) = 26.1°C, Tsurr = 21.0°C, Ts(DMSO) = 577.08, so QDis was calculated to be 0.019 W. According to the obtained data and Equation (3), the PCE (η) of the ZnPc 1 was determined to be 44.05%.
In vitro PA Performance of ZnPc 1
To detect the PA performance of ZnPc 1, ZnPc 1 was dissolved in MeOH and placed into the imaging tube for performing PA signal detection at the wavelength range of 680–970 nm through the multi-mode small animal ultrasound/PA imaging system (Vevo LAZR-X; FujiFilm VisualSonics, Canada). Thereafter, the PA stability of ZnPc 1 was measured in vitro by continuous exposure to the optimal wavelength focused light.
Preparation of ZnPc 1 NPs
ZnPc 1 NPs were prepared through the reprecipitation method. In a typical procedure, ZnPc 1 was dissolved in MeOH with a concentration of 2 mg/mL that to be mother liquor. Then, mother liquor (500 μL) was slowly injected into ultrapure water (5 mL) through liquid transfer gun during the period of 0.5 h and continued to use ultrasound for an additional 2 h. In the ultrasonic process, MeOH was removed with N2 bubbling above the water surface at a constant rate. Ultimately, the ZnPc 1 NPs was characterized through DLS and TEM.
UV–Vis Absorption Spectra of ZnPc 1 NPs
Six test concentrations of ZnPc 1 NPs (2.5, 5, 10, 15, 20, 25 μg/mL) were prepared by the stepwise dilution method. Using water as a blank reference, the UV–Vis absorption spectra of ZnPc 1 NPs at room temperature were measured with a UV-2450 spectrophotometer.
In vitro 1O2 Detection of ZnPc 1 NPs
The DPBF was used to evaluate the 1O2 generate capacity of ZnPc 1 NPs that DPBF absorption reduction of DPBF could reflect the 1O2 level generated by ZnPc 1 NPs. Due to the poor water solubility of DPBF, the air saturated aqueous solution containing 20% DMSO was selected as the detection solvent. The ZnPc 1 NPs solution containing DPBF was irradiated with 690 nm laser (0.2 W/cm2) for different periods of time at room temperature and away from light, and the absorbance at 424 nm was measured by UV–Vis absorption. For comparison, ZnPc and ZnPc 1 were tested as control samples under the same conditions.
In vitro Photothermal Performance of ZnPc 1 NPs
The aqueous solution of ZnPc 1 NPs (2.0 mL) in a quartz cell with a series concentrations with the series proceeding from the lowest concentration to the highest (0, 12.5, 25, 50, 75 and 100 μg/mL) was irradiated via a 808 nm laser for 600 s at different power density values (0.5, 0.75, 1.0, 1.25, 1.5 W/cm2). Photothermal stability of ZnPc 1 NPs was evaluated by exposing the ZnPc 1 NPs (1.5 mL, 50 μg/mL) to a NIR laser (1.0 W/cm2) for five cycles. Also, water without NPs was used as a control sample to use in the calculation of PCE. During irradiation, the temperature and the thermal images at the 10th minute of the aqueous solutions were recorded every 30s by an IR thermal imaging camera (FLIR E8, FLIR Systems).
The PCE (η) was calculated according to Equation (7) according to a previously reported method:

where Tmax and Tsurr were the maximum temperature of the sample (48.6°C) and surrounding temperature (23.5°C), respectively, I was the laser power density value used (1.0 W/cm2), A808 was the absorbance value of the sample at 808nm (0.7296), QDis was the heat change (Unit: W) of pure reagent, h represented the heat transfer coefficient and s was the surface area of the container. The value of QDis could be determined separately by pure reagent, while the value of hs could be calculated by formula (8):

where m was the mass of solution (1.5 g), Cwater was the specific heat capacity of water (4.2 J/g/°C), Ts(znpc1NPs) was the time constant for heat transfer of the system. Ts(znpc1NPs) could be calculated by formula (9):

where t was the time of the cooling process (Unit: s), ɵ was the thermal driven constant, and T was the instant temperature at time t (Unit: °C). Therefore,
Ts(ZNPC1NPS) (206.93) could be obtained by linear fitting the cooling time and the negative value of Inθ.

where TMax(water)= 24.1°C, Tsurr = 21.0°C, Ts(water)= 392.31, so QDis was calculated to be 0.0498 W. According to the obtained data and Equation (7), the PCE (η) of the ZnPc 1 NPs was determined to be 87.8%.
In vitro PA Imaging (PAI) of ZnPc 1 NPs
To determine the optimal imaging wavelength of ZnPc 1 NPs, NPs (200 μg/mL) was placed into imaging tubes and put into a phantom containing ultrasound coupling agent and scanned in the wavelength range of 680–970 nm with the multimode small animal ultrasound/PA imaging system (Vevo LAZR-X; FujiFilm VisualSonics, Canada). PA stability of NPs was measured in vitro under continuous exposure to focused light at the optimal wavelength. Next, the same volume of NPs with variable concentrations (from left to right: 0, 25, 50, 100, 150 and 200 μg/mL) were added into the imaging tube for PA imaging and linear evaluation of PA signal.
Cell Culture
The HepG2 cell lines were purchased from ATCC cell bank. HepG2 cell lines were cultured in RPMI Medium1640 containing 10% FBS, 100 μg•mL−1 streptomycin and 100 U•mL−1 penicillin at 37°C in a humidified incubator containing 5% CO2 and 95% air. Cell-culture medium was replaced daily, and the cells were sub-cultured after reaching confluence.
Cell Viability Assay
To investigate therapeutic efficacies of ZnPc 1 NPs in vitro, HepG2 cells were seeded at a density of 2×10⁴ cells per well in 96-well plates in 100 μL of complete medium and incubated at 37°C for 24 h. After rinsing with PBS, HepG2 cells were incubated with 100 μL culture media containing serial concentrations of ZnPc 1 NPs (0, 3.75, 7.5, 15, 30, 45 and 60 μg/mL) for another 24 h. Subsequently, the cancer cells were washed with fresh medium and then exposed separately to a 808 nm laser, a 690 nm laser and a combination of the two (808 nm and 690 nm). The power density of 808 nm laser for PTT was 1.0 W/cm2 and the exposure time was 5 min. The power density of 690 nm laser for PDT was 0.2 W/cm2 and the exposure time was 5 min. Ultimately, the HepG2 cells were incubated continued for an additional 24 h in dark and the cell viability was assessed with the CCK-8 assay. Meanwhile, the L02 cell line serves as a control.
Intracellular Reactive Oxygen Species (ROS) Generation
To detect intracellular ROS accumulation in live cells, CM-H2DCFDA (Molecular Probe), a chloromethyl derivative of H2DCFDA, was used as an indicator for ROS in cells. Based on this method, HepG2 cells (about 2×10⁴ cells) were first incubated with nanoparticles (10 μg/mL) in a confocal small dish and cultured in an incubator for 24 h. After washing once with PBS, 2.5 μL of CM-H2DCFDA (6.25 μg/mL in RPMI Medium1640) was added and cultured with Cells for another 15 min. Next, the cancer cells were washed again twice with PBS and once with blank medium to remove extracellular CM-H2DCFDA and then irradiated with a 690 nm laser (0.2 W/cm2) for 2 min per dish. Finally, the cells were fluorescently imaged and photographed with fluorescent microscope (Axio Observer 7; Zeiss, Germany). ROS was indicated by the green fluorescence of DCF and Vc (1.0 mM) was used to eliminate cellular ROS as a positive control.
Intracellular Hyperthermia
To test the efficacy of PTT at the cellular level, HepG2 cells (about 2×10⁴ cells per well) were treated by the before mentioned NPs (45 μg/mL) incubation and laser (808 nm, 1.0W/cm2, 5 min) irradiation in the 96 well plates, for a total of 6 well. The temperature and the thermal images of well were monitored and collected during irradiation by an IR thermal imaging camera (FLIR E8, FLIR Systems). After washing gently once with normothermic PBS, Cells were stained by the pure medium containing a commercially available kit (LIVE/DEADTM viability/cytotoxicity kit, (Green/Deep Red), Invitrogen) for 30 min. Then, another PBS wash later, the cell samples were imaged on fluorescent microscope to discriminate between live and dead cells and assess cell viability by a LIVE/DEAD staining assay for live (calcein-AM; Green) and dead (SYTOX™; Deep Red) cells with the emission at 526 nm and 668 nm, respectively.
Subcellular Localization
HepG2 (1 × 10⁴) cells or L02 (1 × 10⁴) cells were seeded in 35-mm glass-bottom confocal dishes and incubated with ZnPc 1 NPs (10 μg/mL) for 4 h. After incubation, the cells were stained with LysoTracker Red, MitoTracker Green, Hoechst 33,342 and a combination of the three for 15 min. Cell FL imaging was then performed after washing twice with PBS and once with blank medium to remove any extra dye and nanoparticles. The FL imaging of cells was obtained using a Zeiss Axio Observer 7 inverted FL microscope with a 63x oil immersion objective and analyzed by ZEN 2012 software (Carl Zeiss). The FL Emission of Hoechst 33,342, LysoTracker Red, MitoTracker Green and ZnPc 1 NPs was 455 nm, 512 nm, 589 nm and 630 nm, respectively.
Animals and Tumor Model
BALB/c nude mice (19–21 g) aged 5–6 weeks were purchased from Guangdong Medical Laboratory Animal Center (Guangdong, China). All animal procedures were performed in accordance with the Guidelines for Care and Use of Laboratory Animals of Shenzhen Institute for Drug Control and approved by the Ethics Committee for Animal Research, Shenzhen Institute for Drug Control (No. 20,220,920; Experimental Animal Production License: SCXK (Yue) 2022–0002; Laboratory Animal Use License: SCXK (Yue) 2021–0253). HepG2 tumor model was established by subcutaneous injection of cells (1×10⁶) into the lateral abdomen of the nude mice with further culture to become a solid tumor for therapeutic experiments.
In vivo FL Imaging (FLI)
ZnPc 1 NPs (100 μL) (100 μg/mL) was intravenously injected into the HepG2 tumor-bearing nude mice. The fluorescent scans were recorded at various time points (0, 0.5, 1, 2, 3, 4, 6, 8, 12 and 24 h) performed on the IVIS Lumina Series III (PerkinElmer, USA) with excitation at 560 nm and emission from 610 to 630 nm.
In vivo PAI
ZnPc 1 NPs (100 μL) (100 μg/mL) was intravenously injected into the HepG2 tumor-bearing nude mice. The PA imaging was recorded 0.5, 1, 2, 3, 4, 6, 8, 12 and 24 h postinjection using the multimode small animal ultrasound/PA imaging system (Vevo LAZR-X; FujiFilm VisualSonics, Canada).
In vivo Infrared (IR) Thermal Imaging
Eight hours after intravenous injection of ZnPc 1 NPs (200μL) (100μg/mL), the HepG2 tumor-bearing nude mice were irradiated by 808 nm laser at 1.5 W/cm2 for 10 min. The thermal images of mice were photographed and the temperature increase of tumor tissues was recorded by an IR thermal imaging camera (FLIR E8, FLIR Systems).
In vivo Synergistic Photothermal and Photodynamic Therapy (PTT and PTT)
For investigating the antitumor effect in vivo, HepG2 tumor-bearing nude mice were subjected to eight different treatments (n = 6) through tail vein injections in the following groups: PBS; PBS + laser (808 nm); PBS + laser (690 nm); PBS + laser (808 + 690 nm); ZnPc 1 NPs; ZnPc 1 NPs + laser (808 nm); ZnPc 1 NPs + laser (690 nm) and ZnPc 1 NPs + laser (808 + 690 nm). PTT and PDT required 808 nm and 690 nm laser irradiation, respectively. The power density of 808 nm laser for PTT was 1.5 W/cm2 and the exposure time was 10 min. The power density of 690 nm laser for PDT was 0.4 W/cm2 and the exposure time was 10 min. Then, the PBS (200 μL) and ZnPc 1 NPs (100 μg/mL) were injected intravenously into the control group and the experimental group, respectively. The PTT and PDT were performed at 8 h postinjection. During the experiment, the tumor volume and body weight of each mouse were measured and recorded every two days. Tumor volume was calculated with the following equation: tumor volume = length × width2/2.
Biochemical Analysis and Histological Studies
After treatment for 14 days, blood samples were collected from the retro-orbital venous plexus after anesthesia with 3% sodium pentobarbital for measuring blood routine by semiautomatic biochemistry analyzer. The mice were then sacrificed and major organs including heart, liver, spleen, lung, kidney were removed, followed by washing the surface of each tissue with physiological saline several times, fixed in formalin solution (4%), cut into 5 μm sections, and embedded in paraffin after H&E staining, which were observed through a fluorescence microscopy.
Statistical Analysis
The obtained data were all statistically analyzed using Origin 2018. Experimental data are presented as mean ± standard error (mean ± SEM). The test was used to test the data statistics between two groups, and Dunnett’s test was used after one-way ANOVA when there were three or more groups. *P<0.05 is considered to have a statistical difference. **P<0.01 is considered to have significant statistical difference. ***P<0.001 is considered to have extremely significant statistical difference. Data are represented as mean ± standard deviation (SD).
Results and Discussion
Photophysical Properties of ZnPc 1
The detailed preparation methods of ZnPc 1 are listed in the supporting information, including 1H-NMR and MS of ZnPc 1 (Figures S1–S4). To improve the hydrophilicity of ZnPc 1, four PEG chains were introduced in the perinuclear region of ZnPc 1. The ZnPc nucleus and PEG chains were connected through an N atom, which increased the π-electron delocalization structure of ZnPc 1 and caused the maximum absorption peak of ZnPc 1 to red-shift. Accordingly, we constructed a fast and simple two-step synthesis route of zinc phthalocyanine derivatives (Figure 1A) and successfully synthesized ZnPc 1 which displayed multifunctional attributes including PDT, PTT and PAI via evaluating its UV–Vis spectrum, FL spectrum, 1O2 generate capacity, photothermal performance and PA signal. Specifically, ZnPc 1 showed obvious characteristic absorption peaks of phthalocyanines in the B- and Q-bands in different solvents, including DMSO (Figures 1B, S5), MeOH (Figures S6 and S7) and water containing 0.1% DMSO (Figures S8 and S9).43 This also proved the successful synthesis of ZnPc 1 from the side. ZnPc 1 also had FL properties in different solvents, including DMSO (Figures 1C-E and S10 and S11) and MeOH (Figures S12-S15). Both the UV–Vis spectrum and the FL spectrum exhibited a good linear relationship between the intensity (FL in DMSO or UV–Vis absorption) and their corresponding concentration, expressing concentration-dependent activity well. In addition, the difference in UV–Vis response and FL intensity of ZnPc 1 in different solvents suggested that the ZnPc 1 predominantly existed as monomers rather than aggregates in DMSO.
 |
Figure 1 (A) Synthetic route of ZnPc 1. (B) UV–Vis absorption spectra of ZnPc 1. (C) FL emission spectra of ZnPc 1 with λEx = 649 nm. (D) FL emission spectra of ZnPc 1 with λEx = 700 nm. (E) The UV–Vis spectra of DPBF containing ZnPc 1 for different irradiation times under 690 nm laser irradiation (0.2 W/cm2). (F) Temperature elevation of ZnPc 1 in DMSO in dependence of power density (808 nm). (G) PA spectrum of ZnPc 1. (H) In vitro FL images of ZnPc 1 at different concentrations with ZnPc 1 in DMSO with λEx = 649 nm or λEx = 700 nm. (I) Optical graphs and IR thermal images of ZnPc 1 in DMSO at different concentrations. |
1O2 was one of the primary toxic ROS.44 The 1O2 quantum yield (φΔ) could be quantitatively measured using 1.3-diphenylisobenzofuran (DPBF)45 as a capture reagent with zinc phthalocyanine (ZnPc) (φΔ = 0.67 in DMSO) as a reference.46 When there was only DPBF, the absorbance changes at 415 nm decreased very slowly and minimally (Figure S16). When ZnPc 1 or ZnPc was added, the decreasing speed of DPBF absorbance at 415 nm increased, and the variation of ZnPc 1 was more obviously (Figures 1F and S17), presenting that the ZnPc 1 produced much more 1O2 under 690 nm illumination (Figures S18 and S19). Figure S20 showed the decrease in DPBF absorbance with the increase in illumination time, indicating that the change in DPBF absorbance reduction value was almost linear (with linear correlations of 0.9959 for ZnPc and 0.9992 for ZnPc 1, respectively). The linear relationship was ADPBF = APc + Kt being conformed to the zero-order reaction rate according to the Beer-Lambert law of dilute solution, indicating that the slope of the lines represented a constant of photodegradation rate. The 1O2 quantum yield of ZnPc 1 was calculated to be 0.71. Therefore, these results declared that the 1O2 generation capacity of ZnPc 1 was greater than that of the reference.
In general, the FL emission of compounds would compete with the thermal deactivation process through vibrational relaxation, leading to the photothermal effect.47 ZnPc 1 in DMSO displayed FL, but the FL quantum yield was lower than the reference. Therefore, the low FL effect of ZnPc 1 monomer was conducive to the generation of non-radiative heat. As exhibited in Figure 1G, the temperature of ZnPc 1 in DMSO increased significantly with the increase in laser power density (808 nm). And to further evaluate the dependence of their photothermal properties on concentrations, the temperature changes of ZnPc 1 in DMSO with different concentrations were monitored under 808 nm laser irradiation at 1.75 or 1.0 W/cm2 (Figures S21 and S22), demonstrating the temperature of ZnPc 1 appeared to have a concentration-dependent effect, indicating that ZnPc 1 had photothermal activity (Figure S23). The detailed IR thermal images are shown in Figure 1H. As for a photothermal agent, photothermal conversion efficiency (PCE) was a very important parameter to evaluate its PTT performance. Thus, the temperature change of ZnPc 1 monomer was measured under 808 nm laser irradiation at 1.75W/cm2. When the ZnPc 1 monomer was continuously irradiated for 10 minutes, the laser was turned off. According to the cooling phase of ZnPc 1 monomer, the curve of cooling time (t) versus negative natural logarithm of the temperature driving force (−lnθ) was obtained, and the time constant (τ) for heat transfer of the system was calculated to be 213.01 (Figure S24). The PCE of ZnPc 1 monomer was determined to be 44.05%. Finally, Figures S25 and S26 presented that the temperature had almost no change after five heating/cooling stages, confirming the excellent photothermal stability of ZnPc 1 monomer, which further evaluated the photothermal stability of ZnPc 1 monomer.
Encouraged by the obvious UV–Vis absorption peak in the wavelength range from 680 to 800 nm and photothermal effect, we subsequently studied the feasibility of ZnPc 1 monomer as a PA contrast agent. Figure 1I showed a smooth PA spectrum and the PA signal remained stable under irradiation at the optimal PA wavelength (715 nm) for an expanded period (Figure S27). This implied that the ZnPc 1 monomer had a significant PA signal with stable.
Characterization of ZnPc 1 NPs
Nano self-assembly was a kind of nanostructure with considerable potential for development and had been widely used because of the better biocompatibility and enhanced properties of PT.48 Owing to the unique amphiphilic chemical structure of monomers, the ZnPc 1 facilitated spontaneously assembly through π−π stacking under the effects of ultrasound to form a robust nanostructure with a uniform size distribution (Figure 2A). As was evident by TEM (Figures 2B and S28) and DLS analyses (Figures 2C and S29), ZnPc 1 NPs displayed spherical shapes with nanosized structure and dispersed uniformly with an average hydrated particle size of 70 nm and a Zeta potential of −32.6 mV, which facilitated their biomedical applications as they could passively target the tumor sites owing to the enhanced permeability and retention (EPR) effect with the stable colloids, illustrating the successful synthesis of ZnPc 1 NPs. To evaluate the stability of the ZnPc 1 NPs suspension, changes in spectral and size were performed under different conditions. The UV–Vis absorption of ZnPc 1 NPs suspension was basically stable between freshly prepared samples and samples stored in a refrigerator at 4°C for a week, and the ZnPc 1 NPs suspension maintained size stability for 30 days. These results showed that ZnPc 1 NPs suspension had good long-term stability (Figures S30 and S31).
 |
Figure 2 (A) Preparation of ZnPc 1 NPs. (B) TEM images of ZnPc 1 NPs (The red arrow in (B) indicates that ZnPc 1 NPs are a spherical nanoparticle.). (C) Size distribution of ZnPc 1 NPs. (D) UV–Vis absorption spectra of ZnPc 1 NPs. (E) The corresponding relative absorbance variations of different groups (ΔA(ZnPc 1 NPs+DPBF)-ΔA(DPBF) and ΔA(ZnPc 1+DPBF)-ΔA(DPBF)) at different irradiation times under the 690 nm laser irradiation (0.2 W/cm2). (The three asterisk indicators in € indicate an extremely significant statistical difference in the relative absorbance variations of different groups ((Δ A (ZnPc1NPs+DPBF) - Δ A (DPBF))and (Δ A (ZnPc1+DPBF) - Δ A (DPBF))) under 690 nm laser irradiation (0.2 W/cm2)). ***p < 0.001 as compared with the control. (F) Temperature elevation of ZnPc 1 NPs in dependence of power density (808 nm). (G) PA spectrum of ZnPc 1 NPs. (H) Optical graphs and IR thermal images of ZnPc 1 NPs at different concentrations(808 nm, 1.0 W/cm2). In vitro (I) 2D- or (J) 3D-PA images (render) of ZnPc 1 NPs upon excitation wavelength at 710 nm at corresponding concentrations. |
Photophysical Properties of ZnPc 1 NPs
The UV–Vis absorption peak of ZnPc 1 NPs was red-shifted, causing the Q-band span to widen due to aggregation properties (Figure 2D). And there was a good linear relationship between absorption intensity and concentration of ZnPc 1 NPs (Figure S32). Notably, Figure S33 showed that the suspension of ZnPc 1 NPs had a shoulder peak at 808 nm, and the overall absorption intensities increased, which was combined with the above to further prove that ZnPc 1 NPs were successfully synthesized.
The photodynamic properties of ZnPc 1 NPs were also evaluated by using DPBF to monitor reactive oxygen species (ROS) generation. It can be seen that the absorption of DPBF mixed with ZnPc 1 NPs could be more rapidly decreased than that of ZnPc or ZnPc 1 during the irradiation of 690 nm laser (0.2 W/cm2) for 2 minutes (Figure 2E and Figures S34-S38), indicating that the efficiency of ROS generation could be greatly improved through the nanoprecipitation process to enhance the potential effect of PDT.
The photothermal effect of ZnPc 1 NPs was also evaluated with the changes in temperature at different concentrations and laser intensities under 808 nm laser irradiation. In Figure 2F, it was demonstrated that the temperature of ZnPc 1 NPs increased by 34.9°C at a concentration of 50 μg/mL after 10 min of irradiation at 1.5 W/cm2, indicating that ZnPc 1 NPs exhibited the laser-power-density-dependent temperature elevation properties. In parallel, as recorded in the thermal images, when the concentration of ZnPc 1 NPs suspension was 100 μg/mL, a high value of suspension 54°C was observed after 10 minutes of irradiation with a laser power density of 1.0 W/cm2, and pure water, as a reference, did not show any significant temperature change. This explained that the temperature of ZnPc 1 NPs was positively correlated with concentration (Figures 2H and S39). Based on the test procedure of ZnPc 1 monomer, the time constant (τ) for heat transfer of ZnPc 1 NPs was calculated to be 206.93 and the PCE of ZnPc 1 NPs was determined to be 87.8% (Figures S40 and S41), higher than of most reported photothermal agents.49–51 Additionally, the absorption spectrum of the ZnPc 1 NPs displayed negligible change after 808 nm laser irradiation (1.0 W/cm2, 10 min), confirming the photothermal stability of ZnPc 1 NPs (Figure S42). More remarkably, as shown in Figure S43, the temperature hardly changed during the five heating/cooling stages, further confirming the high photothermal stability of ZnPc 1 NPs. This also directly verified that the nanoprecipitation process could also greatly improve the photothermal effect to further enhance the potential of PTT.
The PA properties of ZnPc 1 NPs were investigated based on their UV–Vis absorption in the range 680–900 nm and photothermal activity. The PA signal intensity of ZnPc 1 NPs increased with the increasing concentrations (0–200 μg/mL) (Figure 2G). Besides, the PA values at both 715 nm and 808 nm of ZnPc 1 NPs displayed a relatively linear correlation in the range of 0–200 μg/mL (Figure 2I, J and S44-S46). Meanwhile, ZnPc 1 NPs also had high PA stability as shown in the Figure S47, demonstrating that ZnPc 1 NPs possessed remarkable PA performance.
Cell Viability Assay, Intracellular ROS Generation and Hyperthermia
Given the high efficiency of ROS production and photothermal conversion, the cytotoxicity of ZnPc 1 NPs on HepG2 cells was determined by the CCK-8 assay to further evaluate the feasibility of ZnPc 1 NPs as nanoagents for cancer phototherapy (Figure 3A). The cell viability even at 60 μg/mL of ZnPc 1 NPs under dark conditions still exceeded 86%, declaring ZnPc 1 NPs equipped with low cytotoxicity and good biocompatibility. Also, ZnPc 1 NPs showed a significantly therapeutic effect in a dose-dependent manner on HepG2 cells. When ZnPc 1 NPs (60 μg/mL) were exposed to an 808 nm laser (1.0 W/cm2), a 690 nm laser (0.2 W/cm2) or a combination of the two (808 nm, 1.0 W/cm2; 690 nm, 0.2 W/cm2), the cell viabilities were 1.7%, 28.2% and 0.2%, respectively, indicating that PTT and PDT had a enhancing effect. In addition, the cell viability test of L02 cells co-cultured with ZnPc1 NPs showed that ZnPc 1 NPs had almost no toxicity under dark conditions (Figure S48). Therefore, the fine biocompatibility and high photocytotoxicity of ZnPc 1 NPs towards HepG2 cells made it an ideal PS for cancer PT containing influential pleiotropic pathways.
 |
Figure 3 (A) Viability of HepG2 cells treated with various concentrations of ZnPc 1 NPs in dark or upon exposure to laser radiation (a 808 nm laser (1.0 W/cm2, 5 min), a 690 nm laser (0.2 W/cm2, 5 min) or a combination of the two (808 nm, 1.0 W/cm2, 5 min; 690 nm, 0.2 W/cm2, 5 min)). (The three asterisks indicate an extremely significant statistical difference in the viability of HepG2 cells treated with different concentrations of ZnPc 1 NPs (3.75, 7.5, 15, 30, 45, 60 μg/mL) in the dark and exposed to a combination of two laser co-radiation (808 nm, 1.0 W/cm2, 5 min; 690 nm, 0.2 W/cm2, 5 min). Data are presented as mean ± SD (n = 6;***p < 0.001). (B) Live/dead images of HepG2 cells after various treatments and corresponding IR thermal images. Green fluorescence calcein-AM and red fluorescence SYTOX™ represent live cells and dead cells, respectively. (Scale bar represents 50 µm.) (C) Confocal fluorescence images of HepG2 cells stained with LysoTracker Red, Mito Tracker Green and Hoechst 33,342 following incubation with ZnPc 1 NPs for 4 h. (Scale bar represents 20 µm). |
To clearly investigate the production of ROS in cells by ZnPc 1 NPs, the production of ROS n cells was further measured using CM-H2DCFDA (Figure S49).52 No fluorescence was observed in “ZnPc 1 + RPMI Medium1640” group, “ZnPc 1 NPs + RPMI Medium 1640” group and “ZnPc 1 NPs + Vc + RPMI Medium1640 + laser (690 nm)” group. However, after being treated with ZnPc 1 or ZnPc 1 NPs under irradiation with 690 nm, the obvious green fluorescence of DCF in cells co-incubated with ZnPc 1 NPs was monitored. The results demonstrated that ZnPc 1 NPs could produce more abundant ROS compared to ZnPc 1. Taken together, these results further indicated that self-assembly structure could enhance the therapeutic effect of PDT to effectively kill cancer cells.
To verify the photothermal effect of ZnPc 1 NPs, LIVE/DEADTM viability/cytotoxicity kit (Green/Deep Red) was then used to further measure the photothermal therapeutic effect.53 As shown in Figure 3B, HepG2 cells treated with ZnPc 1 NPs displayed evident red fluorescence under the 808 nm irradiation, proclaiming that the HepG2 cells were completely photoablated. In contrast, the control group using laser alone could not kill cancer cells, which authenticated the high PTT efficacy of ZnPc 1 NPs. Hence, these results further indicated that the prepared ZnPc 1 NPs were an efficient photothermal agent for killing cancer cells.
For validating the PTT/PDT effect that occurred in HpeG2 and L02 cells, the cellular uptake and subcellular localization of ZnPc 1 NPs were studied by inverted fluorescence microscopy. The purple fluorescence of ZnPc 1 NPs could be clearly observed in HepG2 after 4 hours, while it was rarely observed in L02. This indicated that ZnPc 1 NPs could be significantly uptaken by HepG2, while L02 intake was almost non-existent or minimal (Figures S50 and S51). The fluorescence image of HepG2 cells co-stained with LysoTracker Red as a lysosome indicator, MitoTracker Green as a mitochondrial indicator, and Hoechst 33,342 as a nuclear indicator appeared in Figure 3C. It was noteworthy that the red fluorescence of LysoTracker Red almost overlapped with the purple fluorescence from ZnPc 1 NPs, appearing as pink fluorescence spots, indicating that ZnPc 1 NPs could effectively accumulate in cancer cells and target lysosomal compartments. Similarly, subcellular localization of L02 cells co-incubated with ZnPc1 NPs was also identified using the same tracking agent. The results showed that ZnPc1 NPs were rarely taken up by L02 and not only enriched in lysosomes but also accumulated in mitochondria (Figure S52).
In vivo PAI, FLI and IR Thermal Imaging of ZnPc 1 NPs
To examine the accumulation of ZnPc 1 NPs at the tumor site in vivo, ZnPc 1 NPs (100 μg/mL, 100 μL) were injected intravenously into mice with HepG2 tumors implanted subcutaneously via the tail vein and scanned at different time points after injection. On the one hand, as depicted in Figures 4A, S53 and 4B, the PA signal at the tumor site significantly increased post-injection from 0.5 to 8 h and reached its maximum, revealing selective accumulation at the tumor site due to effective EPR effect. Furthermore, both PA mode (Figures 4C and S54) and blood oxygen mode (Figures 4D, E and S55) emerged, showing that the blood oxygen signal around the tumor site increased significantly after 808 nm irradiation, explaining that PTT could increase the blood flow at the tumor site and thus enhance the oxygen supply, which would be expected to produce “1+1>2” therapeutic effects. On the other hand, the FL signal intensity of ZnPc 1 NPs at the tumor site increased with an increasing time from 2 h. After injection for 8 h, the FL brightness at the tumor site reached the maximum (Figures 5A and S56), consistent with the results of PAI. Surprisingly, ex vivo imaging of excised organs identified that only tumor had a strong visible FL signal (Figure 5B). These results include the relative FL intensity of both tumors in vivo (Figure 5C) and ex vivo (Figure 5D) further confirmed that ZnPc 1 NPs had a good EPR effect. Taken together, 8 h postinjection was the best time for the next PT based on the light signals originated from PA and FL signals in vivo at longitudinal and transverse sections of the tumor site. Therefore, the infrared (IR) thermal imaging of the ZnPc 1 NPs was further investigated after injection for 8 h in vivo. As recorded in the thermal images in vivo, temperature of tumor site was raised nearly by 30°C within 10 min of irradiation (808 nm, 1.5 W/cm2). In contrast, the tumor temperature of PBS-treated mice increased only by 8°C (Figure 5E-G), which was confirmed directly that the optimal time of therapy was about 8 hours, echoing the results of PAI and FLI. Overall, the passive targeting characteristics and long-term circulation in vivo of ZnPc 1 NPs may be attributed to their appropriate size of NPs to improve the effective EPR effect.
 |
Figure 4 (A) PA images of tumor site at different time points (2, 4, 8, 12 h) after intravenous injection of ZnPc 1 NPs (100 μg/mL, 100 μL). (These colored circles represent the location of the tumor.) (B) Relative PA signal intensity of tumor tissues after intravenous injection at corresponding times. (C) Comparison of oxygen signal (OXYHemo in red) and the hypoxia signal (DeOXYHemo in blue) in tumor, para-tumor site and the whole at before and after 808 nm irradiation with PA mode, and the sections in the procedure of exploring the blood oxygen signal (sO2 Average) of the para-tumor site at (D) before and (E) after 808 nm irradiation with PA probe under OXYHemo mode. |
 |
Figure 5 (A) In vivo FL images of HepG2 tumor-bearing nude mice at different time points after intravenous injection with ZnPc 1 NPs. (B) Ex vivo FL images of major organs from HepG2 tumor-bearing nude mice 24 h after intravenous injection of ZnPc 1 NPs. (C) Relative FL signal intensity of tumor site after intravenous injection at corresponding times. (D) Relative FL signal intensity of major organs ex vivo. (The three asterisks of Figure 5D indicate an extremely significant statistical difference in the relative FL signal intensity between the main organs (spleen, heart, kidney, liver, lung) and the tumor ex vivo). Data are presented as mean ± SD (n = 3;***p < 0.001). (E) Temperature profiles of tumor-site or (F) an increase in temperature of tumor-site as a function of irradiation time. Laser irradiation was performed after injection of PBS or ZnPc 1 NPs at 8 h. (The three asterisks indicate an extremely significant statistical difference in temperature changes at the irradiated tumor site after 8 hours of intravenous injection of PBS or ZnPc1NPs into the tail). Data are presented as mean ± SD (n = 6;***p < 0.001). (G) IR thermal images of HepG2 tumor-bearing mice after the injection of PBS or ZnPc 1 NPs intravenously and irradiation by laser (808 nm, 1.5 W/cm2). |
In vivo Tumor Inhibitory Effect of Combined PTT/PDT
According to the FL/PA/IR multimodal imaging results, the anti-tumor effect of ZnPc 1 NPs was evaluated. The BALB/c nude mice bearing HepG2 tumor were randomly divided into eight groups (n=6) as follows: “PBS”, “PBS + laser (808 nm)”, “PBS + laser (690 nm)”, “PBS + laser (808 + 690 nm)”, “ZnPc 1 NPs”, “ZnPc 1 NPs + laser (808 nm)”, “ZnPc 1 NPs + laser (690 nm)” and “ZnPc 1 NPs + laser (808 + 690 nm)”. PTT and PDT therapy were performed at 8 h postinjection under the guidance of imaging results (Figure 6A and B). During the treatment, the average tumor size within 14 days was monitored to evaluate the therapy efficacy. As shown in Figures 6C-F and S57, the “PBS” control group, the “PBS + laser (808 nm)” group, the “PBS + laser (690 nm)” group, the “PBS + laser (808 + 690 nm)” group and the “ZnPc 1 NPS” group were similar that could not inhibit tumor growth at all. However, the “ZnPc 1 NPs + laser (808 nm)” group, the “ZnPc 1 NPs + laser (690 nm)” group and the “ZnPc 1 NPs + laser (808 + 690 nm)” group showed high anti-tumor activity that the significant abrogation of tumor growth could be observed at day 14. Notably, the “ZnPc 1 NPS + laser (808+690 nm)” group displayed a stronger therapeutic effect, showing faster treatment, cell necrosis, scab over, and abscission until spontaneous healing. Upon further exploration, this result was probably attributed to PTT, owing to the increasing the blood flow of tumor site to make up for hypoxia deficiency of tumor site for enhancing PDT for holistic cancer therapy, being in line with previous PA data (Figures S54 and S55). Therefore, these results indicated that the treatment of ZnPc 1 NPs with combination of PDT and PTT was more effectively than the groups treated with only PDT or PTT. This also proved that the combination of PDT and PTT of ZnPc 1 NPs could more effectively inhibit tumor growth. Interestingly, Figure S58 showed that there was no significant difference in the mice’s weight during the 14-day period, suggesting that ZnPc 1 NPs had a negligible side effect on mice. Summarizing, these results comprehensively proved the remarkable therapeutic effect of ZnPc 1 NPs in vivo.
 |
Figure 6 In vivo PTT/PDT therapy of tumor. (A) Schematic illustration showing the timeline of the in vivo therapy. (B) Schematic diagram of the process establishing tumor model. Representative photos of mice within the 14 days of treatment, (C): Representative photos of mice at different times taken after treatment process of ZnPc 1 NPs + laser (808 nm). (The red box indicates mice after treatment process of ZnPc 1 NPs + laser (808 nm) group.), (D): Representative photos of mice at different times taken after treatment process of ZnPc 1 NPs + laser (690 nm). (The blue box indicates mice after treatment process of ZnPc 1 NPs + laser (690 nm) group.), (E): Representative photos of mice at different times taken after treatment process of ZnPc 1 NPs + laser (808 + 690 nm). (The pink box indicates mice after treatment process of ZnPc 1 NPs + laser (808 + 690 nm) group.), and (F): Representative photos of control group mice captured on prior treatment and 14th day post-treatment including PBS, PBS + laser (808 nm), PBS + laser (690 nm) and PBS + laser (808 + 690 nm). (The black box indicates control group mice on prior treatment and 14th day post-treatment including PBS, PBS + laser (808 nm), PBS + laser (690 nm) and PBS + laser (808 + 690 nm).). |
For evaluating the biocompatibility of ZnPc 1 NPs, the inside organs (heart, lung, liver, kidney, spleen) of mice were collected and stained with H&E at the end of observation. As shown in Figure S59, there was no noticeable sign of organ damage to heart, lung, liver, kidney and spleen, suggesting superior biocompatibility and the unique therapeutic effect of ZnPc 1 NPs under laser irradiation for cancer treatment. Furthermore, in order to further evaluate the potential toxicity of ZnPc 1 NPs in vivo, the mice were sacrificed for a blood routine examination after 14 days of treatment. The results of blood biochemistry analysis further suggested no obvious hepatic disorders of mice treated by “ZnPc 1 NPs + laser” (Figure S60). Altogether, ZnPc 1 NPs unveiled excellent biocompatibility and could be applied as efficient nanoagents in FL/PA/IR multimodal imaging to jointly guide PTT and PDT against cancer.
Conclusion
In summary, this study has successfully synthesized a phthalocyanine-based planar micro-molecule amphiphile ZnPc 1. Immediately after, the ZnPc 1 would spontaneously self-assemble into NPs (ZnPc 1 NPs) under the effects of ultrasound without any adjuvants. Indeed, ZnPc 1 NPs have unfolded remarkable FL/PA/IR multimodal imaging capability to accurately locate the tumor from the transverse and longitudinal section, which were able to guide the enhanced PT including PDT and PTT for cancer treatment. Meanwhile, ZnPc 1 NPs have still possessed favorable biocompatibility and phototoxic in vivo and in vitro experiments. Therefore, these results reported here have confirmed our design that ZnPc 1 NPs with the features of good biocompatibility, effective ROS generation, high photothermal conversion efficiencies and FL/PA/IR multimodal imaging capability, which can play an integrated therapeutic function, opening a promising way for precise PT.
Abbreviations
PET: photoinduced electron transfer; PDT: photodynamic therapy; PTT: photothermal therapy; ROS: reactive oxygen species; FLI: fluorescence imaging; PAI: photoacoustic imaging; IR: infrared; PT: phototherapy; 1O2: singlet oxygen; ZnPc: zinc phthalocyanine; DPBF: 1.3-diphenylisobenzofuran.
Acknowledgments
This work was supported by the National Natural Science Foundation of China (82104357), China Postdoctoral Science Foundation (2021M702292 and 2022T150441). All animal procedures were managed under protocols approved by the Institutional Animal Use and Care Committee of Shenzhen Institute for Drug Control.
Disclosure
The authors declare no conflicts of interest in this work.
References
1. Zou Y, Long S, Xiong T, et al. Single-Molecule Förster Resonance Energy Transfer-Based Photosensitizer for Synergistic Photodynamic/Photothermal Therapy. ACS Cent Sci. 2021;7:327–334. doi:10.1021/acscentsci.0c01551
2. Wang J, Sun J, Wang Y, et al. Gold Nanoframeworks with Mesopores for Raman-Photoacoustic Imaging and Photo-Chemo Tumor Therapy in the Second Near-Infrared Biowindow. Adv Funct Mater. 2020;30:1908825. doi:10.1002/adfm.201908825
3. Zhou Y, Tong F, Gu W, et al. Co-delivery of photosensitizer and diclofenac through sequentially responsive bilirubin nanocarriers for combating hypoxic tumors. Acta Pharm Sin B. 2022;12:1416–1431. doi:10.1016/j.apsb.2021.12.001
4. Li S, Deng Q, Zhang Y, et al. Rational Design of Conjugated Small Molecules for Superior Photothermal Theranostics in the NIR-II Biowindow. Adv Mater. 2020;32:e2001146.
5. Wang S, Zhang L, Zhao J, et al. A tumor microenvironment-induced absorption red-shifted polymer nanoparticle for simultaneously activated photoacoustic imaging and photothermal therapy. Sci Adv. 2021;7:eabe3588.
6. Gong F, Cheng L, Yang N, et al. Preparation of TiH1.924 nanodots by liquid-phase exfoliation for enhanced sonodynamic cancer therapy. Nat Commun. 2020;11:3712. doi:10.1038/s41467-020-17485-x
7. Cai H, Dai X, Wang X, et al. A Nanostrategy for Efficient Imaging-Guided Antitumor Therapy through a Stimuli-Responsive Branched Polymeric Prodrug. Adv Sci. 2020;7:1903243. doi:10.1002/advs.201903243
8. Ding F, Chen Z, Kim WY, et al. A nano-cocktail of an NIR-II emissive fluorophore and organoplatinum(ii) metallacycle for efficient cancer imaging and therapy. Chem Sci. 2019;10:7023–7028. doi:10.1039/C9SC02466B
9. Nabeshima Y, Seo Y, Takeuchi M. A review of current trends in three-dimensional analysis of left ventricular myocardial strain. Cardiovasc Ultra. 2020;18:23. doi:10.1186/s12947-020-00204-3
10. Hill TK, Kelkar SS, Wojtynek NE, et al. Near Infrared Fluorescent Nanoparticles Derived from Hyaluronic Acid Improve Tumor Contrast for Image-Guided Surgery. Theranostics. 2016;6:2314–2328. doi:10.7150/thno.16514
11. Liang G, Wang H, Shi H, et al. Recent progress in the development of upconversion nanomaterials in bioimaging and disease treatment. J Nanobiotech. 2020;18:154. doi:10.1186/s12951-020-00713-3
12. Qin W, Quan G, Sun Y, et al. Dissolving Microneedles with Spatiotemporally controlled pulsatile release Nanosystem for Synergistic Chemo-photothermal Therapy of Melanoma. Theranostics. 2020;10:8179–8196. doi:10.7150/thno.44194
13. Hou J, Zhou J, Chang M, et al. LIFU-responsive nanomedicine enables acoustic droplet vaporization-induced apoptosis of macrophages for stabilizing vulnerable atherosclerotic plaques. Bioact Mater. 2022;16:120–133. doi:10.1016/j.bioactmat.2022.02.022
14. Fan Z, Liu H, Xue Y, et al. Reversing cold tumors to hot: an immunoadjuvant-functionalized metal-organic framework for multimodal imaging-guided synergistic photo-immunotherapy. Bioact Mater. 2020;6:312–325. doi:10.1016/j.bioactmat.2020.08.005
15. Lovell JF, Jin CS, Huynh E, et al. Porphysome nanovesicles generated by porphyrin bilayers for use as multimodal biophotonic contrast agents. Nat Mater. 2011;10(4):324–332. doi:10.1038/nmat2986
16. Liu Y, Mo F, Hu J, et al. Precision photothermal therapy and photoacoustic imaging by in situ activatable thermoplasmonics. Chem Sci. 2021;12:10097–10105. doi:10.1039/D1SC02203B
17. Jiao L, Liu Y, Zhang X, et al. Constructing a Local Hydrophobic Cage in Dye-Doped Fluorescent Silica Nanoparticles to Enhance the Photophysical Properties. ACS Cent Sci. 2020;6:747–759. doi:10.1021/acscentsci.0c00071
18. Yang M, Cao S, Sun X, et al. Self-Assembled Naphthalimide Conjugated Porphyrin Nanomaterials with D-A Structure for PDT/PTT Synergistic Therapy. Bioconjug Chem. 2020;31:663–672. doi:10.1021/acs.bioconjchem.9b00819
19. Lv N, Li Q, Zhu H, et al. Electrocatalytic Porphyrin/Phthalocyanine-Based Organic Frameworks: building Blocks, Coordination Microenvironments, Structure-Performance Relationships. Adv Sci. 2023;10:e2206239.
20. Xue S, Zhou X, Sang W, et al. Cartilage-targeting peptide-modified dual-drug delivery nanoplatform with NIR laser response for osteoarthritis therapy. Bioact Mater. 2021;6:2372–2389. doi:10.1016/j.bioactmat.2021.01.017
21. Zheng BD, He QX, Li X, et al. Phthalocyanines as contrast agents for photothermal therapy. Coord Chem Rev. 2021;426:213548. doi:10.1016/j.ccr.2020.213548
22. Lara P, Huis In ‘t Veld RV, Jorquera-Cordero C, et al. Zinc-Phthalocyanine-Loaded Extracellular Vesicles Increase Efficacy and Selectivity of Photodynamic Therapy in Co-Culture and Preclinical Models of Colon Cancer. Pharmaceutics. 2021;13:1547. doi:10.3390/pharmaceutics13101547
23. Tang Q, Hu P, Peng H, et al. Near-Infrared Laser-Triggered, Self-Immolative Smart Polymersomes for in vivo Cancer Therapy. Int J Nanomed. 2020;15:137–149. doi:10.2147/IJN.S224502
24. Chota A, George BP, Abrahamse H. In Vitro Cell Death Mechanisms Induced by Dicoma anomala Root Extract in Combination with ZnPcS4 Mediated-Photodynamic Therapy in A549 Lung Cancer Cells. Cells. 2022;11:3288. doi:10.3390/cells11203288
25. Lee HJ, Lee YG, Kang J, et al. Monitoring metal-amyloid-β complexation by a FRET-based probe: design, detection, and inhibitor screening. Chem Sci. 2018;10:1000–1007. doi:10.1039/C8SC04943B
26. Nowacka M, Makowski T, Kowalewska A. Hybrid Fluorescent Poly(silsesquioxanes) with Amide- and Triazole-Containing Side Groups for Light Harvesting and Cation Sensing. Materials. 2020;13:4491. doi:10.3390/ma13204491
27. Naik IK, Bodapati R, Sarkar R, et al. Functional Molecular System of Bis(pyrazolyl)pyridine Derivatives: photophysics, Spectroscopy, Computation, and Ion Sensing. ACS omega. 2018;3:3022–3035. doi:10.1021/acsomega.7b02006
28. Susu L, Campu A, Astilean S, et al. Calligraphed Selective Plasmonic Arrays on Paper Platforms for Complementary Dual Optical “ON/OFF Switch” Sensing. Nanomaterials. 2020;10:1025. doi:10.3390/nano10061025
29. Ozaki R, Yamada T, Yudate S, et al. Luminescent color control of Langmuir-Blodgett film by emission enhancement using a planar metal layer. Sci Rep. 2018;8:17119. doi:10.1038/s41598-018-35467-4
30. Zhang B, Chen L, Zhang Z, et al. Modulating the Band Structure of Metal Coordinated Salen COFs and an In Situ Constructed Charge Transfer Heterostructure for Electrocatalysis Hydrogen Evolution. Adv Sci. 2022;9:e2105912. doi:10.1002/advs.202105912
31. Dibetsoe M, Olasunkanmi LO, Fayemi OE, et al. Some Phthalocyanine and Naphthalocyanine Derivatives as Corrosion Inhibitors for Aluminium in Acidic Medium: experimental, Quantum Chemical Calculations, QSAR Studies and Synergistic Effect of Iodide Ions. Molecules. 2015;20:15701–15734. doi:10.3390/molecules200915701
32. Wang Y, Hou J, Eguchi K, et al. Structural, Electronic, and Magnetic Properties of Cobalt Tetrakis (Thiadiazole) Porphyrazine Molecule Films on Au(111). ACS omega. 2020;5:6676–6683. doi:10.1021/acsomega.9b04453
33. Balogun SA, Fayemi OE. Recent Advances in the Use of CoPc-MWCNTs Nanocomposites as Electrochemical Sensing Materials. Biosensors. 2022;12:850. doi:10.3390/bios12100850
34. Li X, Peng XH, Zheng BD, et al. New application of phthalocyanine molecules: from photodynamic therapy to photothermal therapy by means of structural regulation rather than formation of aggregates. Chem Sci. 2018;9:2098–2104. doi:10.1039/C7SC05115H
35. Peng XH, Chen SF, Zheng BY, et al. Comparison between amine-terminated phthalocyanines and their chlorambucil conjugates: synthesis, spectroscopic properties, and inâvitro anticancer activity. Tetrahedron. 2017;73:378–384. doi:10.1016/j.tet.2016.12.017
36. van de Winckel E, Schneider RJ, de la Escosura A, et al. Multifunctional Logic in a Photosensitizer with Triple-Mode Fluorescent and Photodynamic Activity. Chemistry. 2015;21:18551–18556. doi:10.1002/chem.201503830
37. Wang Y, Zhang X, Zhao Y, et al. Three Novel Zn-Based Coordination Polymers: synthesis, Structure, and Effective Detection of Al3+ and S2- Ions. Molecules. 2020;25:382. doi:10.3390/molecules25020382
38. Ryu U, Jee S, Rao PC, et al. Recent advances in process engineering and upcoming applications of metal-organic frameworks. Coord Chem Rev. 2021;426:213548.
39. Hu S, Pei X, Duan L, et al. A mussel-inspired film for adhesion to wet buccal tissue and efficient buccal drug delivery. Nat Commun. 2021;12:1689. doi:10.1038/s41467-021-21989-5
40. Wang Y, Quinsaat JEQ, Ono T, et al. Enhanced dispersion stability of gold nanoparticles by the physisorption of cyclic poly(ethylene glycol). Nat Commun. 2021;11:6089. doi:10.1038/s41467-020-19947-8
41. Wu F, Chen L, Yue L, et al. Small-Molecule Porphyrin-Based Organic Nanoparticles with Remarkable Photothermal Conversion Efficiency for in Vivo Photoacoustic Imaging and Photothermal Therapy. ACS Appl Mater Int. 2019;11:21408–21416. doi:10.1021/acsami.9b06866
42. Revuelta-Maza MÁ, Mascaraque M, González-Jiménez P, et al. Assessing Amphiphilic ABAB Zn(II) Phthalocyanines with Enhanced Photosensitization Abilities in In Vitro Photodynamic Therapy Studies Against Cancer. Molecules. 2020;25:213. doi:10.3390/molecules25010213
43. Ribeiro VGP, Mota JPF, Júnior AEC, et al. Nanomaterials Based on Fe3O4 and Phthalocyanines Derived from Cashew Nut Shell Liquid. Molecules. 2019;24:3284. doi:10.3390/molecules24183284
44. Liu D, Liu L, Liu F, et al. HOCl-Activated Aggregation of Gold Nanoparticles for Multimodality Therapy of Tumors. Adv Sci. 2021;8:e2100074.
45. Liu Y, Dai S, Wen L, et al. Enhancing Drug Delivery for Overcoming Angiogenesis and Improving the Phototherapy Efficacy of Glioblastoma by ICG-Loaded Glycolipid-Like Micelles. Int J Nanomed. 2020;15:2717–2732. doi:10.2147/IJN.S234240
46. Abid S, Hassine SB, Richy N, et al. Phthalocyanine-Cored Fluorophores with Fluorene-Containing Peripheral Two-Photon Antennae as Photosensitizers for Singlet Oxygen Generation. Molecules. 2020;25:239. doi:10.3390/molecules25020239
47. Shimomura S, Nishimura T, Ogura Y, et al. Optical decomposition of DNA gel and modification of object mobility on micrometre scale. Sci Rep. 2019;9:19858. doi:10.1038/s41598-019-56501-z
48. Sun B, Luo C, Zhang X, et al. Probing the impact of sulfur/selenium/carbon linkages on prodrug nanoassemblies for cancer therapy. Nat Commun. 2019;10:3211. doi:10.1038/s41467-019-11193-x
49. Liu C, Zhang S, Li J, et al. A Water-Soluble, NIR-Absorbing Quaterrylenediimide Chromophore for Photoacoustic Imaging and Efficient Photothermal Cancer Therapy. Angew Chem Int Ed Engl. 2019;58:1638–1642. doi:10.1002/anie.201810541
50. Zhang S, Guo W, Wei J, et al. Terrylenediimide-Based Intrinsic Theranostic Nanomedicines with High Photothermal Conversion Efficiency for Photoacoustic Imaging-Guided Cancer Therapy. ACS nano. 2017;11:3797–3805. doi:10.1021/acsnano.6b08720
51. Du L, Qin H, Ma T, et al. In Vivo Imaging-Guided Photothermal/Photoacoustic Synergistic Therapy with Bioorthogonal Metabolic Glycoengineering-Activated Tumor Targeting Nanoparticles. ACS nano. 2017;11:8930–8943. doi:10.1021/acsnano.7b03226
52. Cao S, Shao J, Wu H, et al. Photoactivated nanomotors via aggregation induced emission for enhanced phototherapy. Nat Commun. 2021;12:2077. doi:10.1038/s41467-021-22279-w
53. Chen X, Fan X, Zhang Y, et al. Cooperative coordination-mediated multi-component self-assembly of “all-in-one” nanospike theranostic nano-platform for MRI-guided synergistic therapy against breast cancer. Acta Pharm Sin B. 2022;12:3710–3725. doi:10.1016/j.apsb.2022.02.027
 © 2024 The Author(s). This work is published and licensed by Dove Medical Press Limited. The
full terms of this license are available at https://www.dovepress.com/terms.php
and incorporate the Creative Commons Attribution
- Non Commercial (unported, v3.0) License.
By accessing the work you hereby accept the Terms. Non-commercial uses of the work are permitted
without any further permission from Dove Medical Press Limited, provided the work is properly
attributed. For permission for commercial use of this work, please see paragraphs 4.2 and 5 of our Terms.
© 2024 The Author(s). This work is published and licensed by Dove Medical Press Limited. The
full terms of this license are available at https://www.dovepress.com/terms.php
and incorporate the Creative Commons Attribution
- Non Commercial (unported, v3.0) License.
By accessing the work you hereby accept the Terms. Non-commercial uses of the work are permitted
without any further permission from Dove Medical Press Limited, provided the work is properly
attributed. For permission for commercial use of this work, please see paragraphs 4.2 and 5 of our Terms.