")
Back to Journals » Clinical Ophthalmology » Volume 18
Advantages of Lissamine Green Vital Staining as an Endpoint in Dry Eye Clinical Trials
Authors Rodriguez JD , Kerti S, Hamm A, Ousler GW, Bensinger E, Burnham S, Abelson MB
Received 10 May 2024
Accepted for publication 16 July 2024
Published 6 August 2024 Volume 2024:18 Pages 2193—2203
DOI https://doi.org/10.2147/OPTH.S468457
Checked for plagiarism Yes
Review by Single anonymous peer review
Peer reviewer comments 2
Editor who approved publication: Dr Scott Fraser
John D Rodriguez,1,2 Samantha Kerti,3 Adam Hamm,3 George W Ousler,1 Ethan Bensinger,1,2 Sadie Burnham,1,2 Mark B Abelson1,2,4,5
1Ora, Inc, Andover, MA, USA; 2Andover Eye Institute, Andover, MA, USA; 3Statistics and Data Corporation, Tempe, AZ, USA; 4Ophthalmology, Harvard Medical School, Cambridge, MA, USA; 5Mass Eye and Ear, Boston, MA, USA
Correspondence: John D Rodriguez, Email [email protected]
Purpose: The absence of a standardized diagnostic method for clinical signs of Dry Eye Disease (DED) complicates clinical trials for future treatments. This paper evaluated Lissamine Green (LG) conjunctival staining as a valid, stable and modifiable endpoint for both clinical practice and clinical trials.
Methods: Screening and pre-randomization data from two identically designed clinical trials for DED resulted in a pooled dataset of 494 subjects. Inclusion was based on reported symptoms, lissamine green (LG) conjunctival staining, Fluorescein (Fl) corneal and conjunctival staining, and Schirmer’s Test (ST). Outcome measures were assessed based on the modifiability of LG staining to exposure to a Controlled Adverse Environment (CAE®), correlation of LG to Fl staining, relative variation of LG staining scores and Schirmer test scores, and the correlation of LG staining with symptom scores.
Results: The modifiability of LG conjunctival staining to environmental exposure was demonstrated, with nasal LG and FL staining displaying the most similar percent change. Nasal LG conjunctival staining scores for subjects with ST scores of less than 8mm were significantly higher than for subjects with ST greater than 8mm. LG staining scores were more consistent (25% change from baseline threshold) than ST scores. Finally, statistically significant correlations were found between LG staining and a number of symptom scores.
Conclusion: This evaluation demonstrates the superiority of the utilization of a clinical endpoint focused on ocular surface damage. The reproducibility and modifiability of LG conjunctival staining to controlled adverse environment, coupled with its significant correlation with symptoms, positions it as an exemplary clinical sign endpoint for clinical management and in clinical trials. Our findings advocate for the adoption of LG conjunctival staining as a primary endpoint in both clinical research and drug development, offering a more effective means of identifying and addressing ocular surface damage in the realm of DED.
Keywords: dry eye, conjunctiva, stain, lissamine green clinical trials, controlled adverse environment, disease models, drug screening, dry eye disease, efficacy endpoints
Introduction
Dry eye disease (DED) is a multifactorial and prevalent condition which presents with a varied range of signs, symptoms, and different levels of severity.1 DED is characterized by a loss of homeostasis of the tear film and treatments target the restoration of this balance.1 Maintaining ocular surface homeostasis requires a vast array of complex and interactive physiological processes.2 The diagnosis and categorization of the various dry eye diseases requires sensitive, clinically relevant and robust clinical endpoints.3,4 Many diagnostic tests are invasive resulting in potential compromise to the accuracy of the measurements, mechanical, chemical, or other stimulations.5 Seasonal and diurnal variation of signs and symptoms of DED and poor correlations between them create diagnostic challenges.6–8 The crucial aspect of clinical research and drug development for dry eye disease lies in the careful selection and refinement of clinical scales for signs and symptoms, along with a comprehensive understanding of their interaction. This process is not only essential for diagnosis but is central to advancing research in this field.9,10 The development of therapeutic agents in clinical trials and objectively measurable biomarkers has also been hampered by the absence of a clear diagnostic gold standard to define clinical trial endpoints due to a multitude of challenges such as variation in study design, data processing, analysis methods, and biological differences in data samples.11
Multiple clinical modalities have been developed for clinical assessments to scrutinize the qualitative and quantitative aspects of the ocular surface and tear functional units.4,5 These encompass tear secretion analysis via Schirmer’s Test (ST) and tear volume assessment with tear meniscus height, as well as the evaluation of tear film stability through tear film break-up time (TFBUT).4,5 Ocular surface damage can be measured with vital dye staining and impression cytology while the lipid layer can be assessed with tear film interferometry.4 Clinical trials for DED treatments habitually utilize sign endpoints based on tear film function measures such as TFBUT or ST. Vital dye staining such as Fluorescein (Fl) and Lissamine Green (LG) measuring ocular surface damage are also used to help diagnose DED by identifying areas where the protective barrier function of the ocular surface is compromised.12–16 Both tear film function and ocular surface health measures have been the basis for approvals of therapeutic agents by the Food and Drug Administration (FDA).17,18
Although commonly used, ST has been shown to exhibit many disadvantages often complicating subject recruitment based on the test’s low reproducibility, high variability, invasive nature of testing.19 Subsequently, vital dye staining reflects ocular surface damage12 and physiological changes are expected to occur on longer time scales than tear film function-based endpoints and hence may yield improved repeatability and provide a greater historic understanding of the subject’s ocular health. LG, a synthetically produced organic acid derivative, was introduced by Norn in 197313 as a less toxic alternative to Rose Bengal14 (RB) and is well tolerated by the subject. Like RB, LG is known to stain desiccated or dead cells in the conjunctiva.12,13,15 Unlike RB, LG does not stain healthy cells.12 Defects in the ocular surface barrier function allow LG to diffuse into deeper layers of the epithelium and bind to the cell nucleus.12 LG is also known to stain free floating mucus13 as well as lost or immature glycocalyx.12 As a clinical trial endpoint, it represents an appealing complement to fluorescein staining of the cornea as well as greater apparent clinical advantages to the health of DED patients.16
In clinical trials, treatment effect is assessed using grading scales of vital staining based on clinical observation and experience.20 These scales were developed over several decades by numerous experienced dry eye specialists21 and have served as the basis for FDA approvals of DED therapies. Although widely used as a secondary endpoint in therapeutic trials LG conjunctival staining has also served as a co-primary or sole primary endpoint in recent clinical trials22–25 Nevertheless, LG remains arguably under-utilized in the development of FDA approved clinical trials for DED therapies.17,18
The purpose of this paper is to investigate the relative benefits of LG conjunctival staining as a clinical trial endpoint relative to other vital dye staining methods such as Fl corneal staining as well as a tear production-based test (ST). In particular, variability of LG conjunctival staining scores as compared to ST, correlation with Fl corneal staining, and the modifiability of LG conjunctival staining scores to CAE exposure.
Methods
General Statistical Considerations
Data for this analysis was very complete and there was minimal missingness, thus no imputation for missing data was implemented. All statistical tests were two-sided with a significance level of 0.05 (α=0.05). All calculations were made using R version 4.2.1 and RStudio 2022.7.1.554.
Subject Selection
Screening and pre-randomization data from two identically designed clinical trials (Phase 2 and Phase 3) were combined into one dataset. Inclusion and exclusion criteria, endpoints and subject population pool were identical. The objective of both studies was the evaluation of the safety and efficacy of active treatment compared to vehicle for the treatment of dry eye disease. In both trials, exposure to a controlled adverse environment (CAE)9 occurred at Visit 1 and Visit 2, each lasting 90 minutes. The CAE is designed to provide an environment with controlled temperature and humidity which minimizes variability of sign and symptom subject response due to external environmental factors.9 In this secondary data analysis, only data from the Pre and Post exposure to controlled adverse environment timepoints at Visit 1 and Visit 2 are used. Pulling the studies produced a combined total of 1049 subjects of which 494 met the screening criteria.
Informed consent and protocols for each study were reviewed and approved by Alpha Institutional Review Board, (San Clemente CA). The studies were performed in accordance with the Health Insurance Portability and Accountability Act of 1996, the Declaration of Helsinki, the protocol, the International Conference on Harmonization guideline on Good Clinical Practices, and all other applicable local regulatory requirements and laws.
Subjects were included if they had a history of use or desire to use artificial tear substitutes for symptoms of dry eye disease within the previous 6 months and a patient- or investigator- reported history of dry eye in both eyes for at least 6 months prior to Visit 1. Subjects were required to report a score of ≥2 on the Ocular Discomfort & 4-Symptom Questionnaire26 (Ora Calibra®) in at least one symptom (ocular discomfort, burning, grittiness, stinging or dryness) at Visit 1 and Visit 2 pre- exposure to controlled adverse environment.
Subjects were required to present the following sign outcome measures at both Visit 1 and Visit 2 pre-controlled adverse environment exposure: summed temporal and nasal conjunctival (bulbar conjunctiva including paralimbal regions) LG staining score of ≥ 2, summed corneal Fl staining score of ≥ 4 based on the sum of inferior, superior and central regions. Both vital dyes staining values were graded on a 0–4 scale (Ora Calibra® staining scale)20,26,27 with 0.5 increments (where 0 is no staining and 4 is severe staining). Subjects were also required to have a have a tear film break-up time (TFBUT) ≤5 seconds as well as a ST score of ≤10 mm and ≥1 mm at Visit 1 and Visit 2. The eye with the worst Fl staining score in the nasal conjunctiva at Visit 2 was chosen as the study eye.
Subjects were excluded from participating if clinically relevant abnormal slit lamp findings or lid anatomy were observed at Visit 1, or if they had any other ocular inflammation, infection or condition that may have put the subject at risk, confounded study results, or interfered with the subject’s participation in the study. Subjects were also excluded who had a history of laser-assisted in situ keratomileusis or other corneal refractive surgery or used contact lenses or any medications known to cause ocular drying for at least 30 days, or prescription treatments for DED for at least 90 days prior to Visit 1 (washout period).
Outcome Measure Assessment
Lissamine green is most commonly used for evaluating conjunctival staining and fluorescein for corneal staining. However, in order to compare staining properties of the two dyes, data was collected for each dye over each ocular region: nasal and temporal conjunctiva, inferior, central and superior cornea.
Modifiability of LG Conjunctival Staining Scores to Environmental Exposure
We examined the effect of exposure to the controlled adverse environment on LG staining scores in the nasal and temporal conjunctival regions (including paralimbal) by analyzing pre- and post-exposure values at Visit 2 in both the study eye and fellow eye. A paired t-test was used to evaluate the difference from pre to post exposure to controlled adverse environment.
Association Between LG and Fl Staining Scores for Corneal and Conjunctival Regions
To consider how LG would complement Fl staining as a clinical trial endpoint evaluating ocular surface damage, we compared the differences in LG and Fl staining in several regions (nasal and temporal conjunctiva and inferior cornea) pre and post controlled adverse environment exposure at Visit 1. Percent change between the different clinical sign assessments was compared in each of the regions to determine if the percent change in LG staining was statistically similar to the percent change in Fl staining.
Relative Variation of LG Staining Scores for Each Ocular Region and ST Values
LG staining scores in each of the following regions (conjunctiva: nasal and temporal; cornea: inferior, central and superior; corneal sum; total sum all corneal and conjunctival regions) were compared to ST score values in order to evaluate the relationship between the two endpoints. Due to the different systems of measurement in each scale, we examined the relationship between the LG scores and a dichotomized ST score “cutoff” point to evaluate if there is a certain threshold at which the baseline LG values differed in patients on different sides of the threshold. Integer values of 3 through 11 were considered as the ST score “cutoff”.
ST scores were examined between visits 1 and 2 pre-controlled adverse environment exposure to determine the percent change in the ST score values from baseline/visit 1 to visit 2. LG staining was assessed in the same way in each of the following regions: central, inferior and superior (cornea), and nasal and temporal (conjunctiva). Consistent values from visit to visit were defined as those values that had a percent change of 25% or less (selected as a reasonable meaningful alteration in the clinical scale). Comparisons were made between ST score consistency and LG score consistency for the purpose of assessing reproducibility and to determine which of the endpoints is more variable from visit to visit.
Correlation of LG Staining Scores for All Ocular Regions and Symptom Scores
The following symptom outcomes were collected during the studies at Visit 2 Pre-controlled adverse environment exposure: Ocular Discomfort and 4-Symptom scale, and two 100mm visual analog symptom scales. These included the SANDE28 scale rating symptom frequency and severity and a 0–100 point VAS symptom scale29 rating each of the following symptoms: burning/stinging, itching, foreign body sensation, eye discomfort, eye dryness, photophobia and pain. The SANDE scale is more specialized for dry eye disease, measuring both symptom severity and frequency, while the VAS is a general tool for measuring symptom intensity. Together, these scales are valuable for assessing symptoms comprehensively. The Pearson correlation coefficient and p-value were calculated between the lissamine green staining score in each of the following regions: central, inferior and superior (cornea) and nasal and temporal (conjunctiva) of the ocular surface and each component of the symptom scales. These calculations were then repeated for the Schirmer test values and compared to the results for lissamine staining.
Results
Demographics
Total subject population was n = 494, mean age and standard deviation (SD) of the subject population was 63.7 (12.4) years. Three hundred and seventy-one (75.1%) of subjects were female and 123 (24.9%) were male. Mean baseline and standard deviation (SD) visual acuity determined using ETDRS chart for all subjects was 0.13 (0.14) LogMAR (study eye).
Modifiability of LG Conjunctival Staining Scores to Environmental Exposure
Lissamine conjunctival staining scores are affected by controlled adverse environment exposure and are significantly higher [p < 0.0001] post controlled adverse environment exposure (Figure 1). This reflects its timely sensitivity to acute ocular surface perturbation.
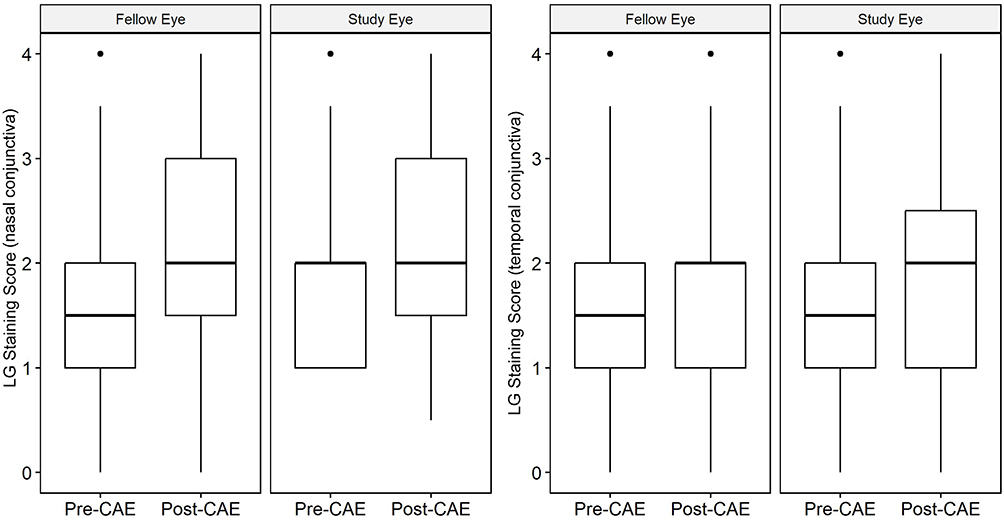 |
Figure 1 Nasal and Temporal Conjunctival LG staining pre and post exposure to controlled adverse environment (study and fellow eyes). |
Association Between LG and Fl Staining Scores for Corneal and Conjunctival Regions
A comparison of the percent change of Fl and LG staining score values from pre to post controlled adverse environment exposure for nasal and temporal conjunctiva and inferior cornea regions demonstrated that the nasal conjunctiva is the region with the most similarity between percent change in LG and Fl staining score values (Table 1).
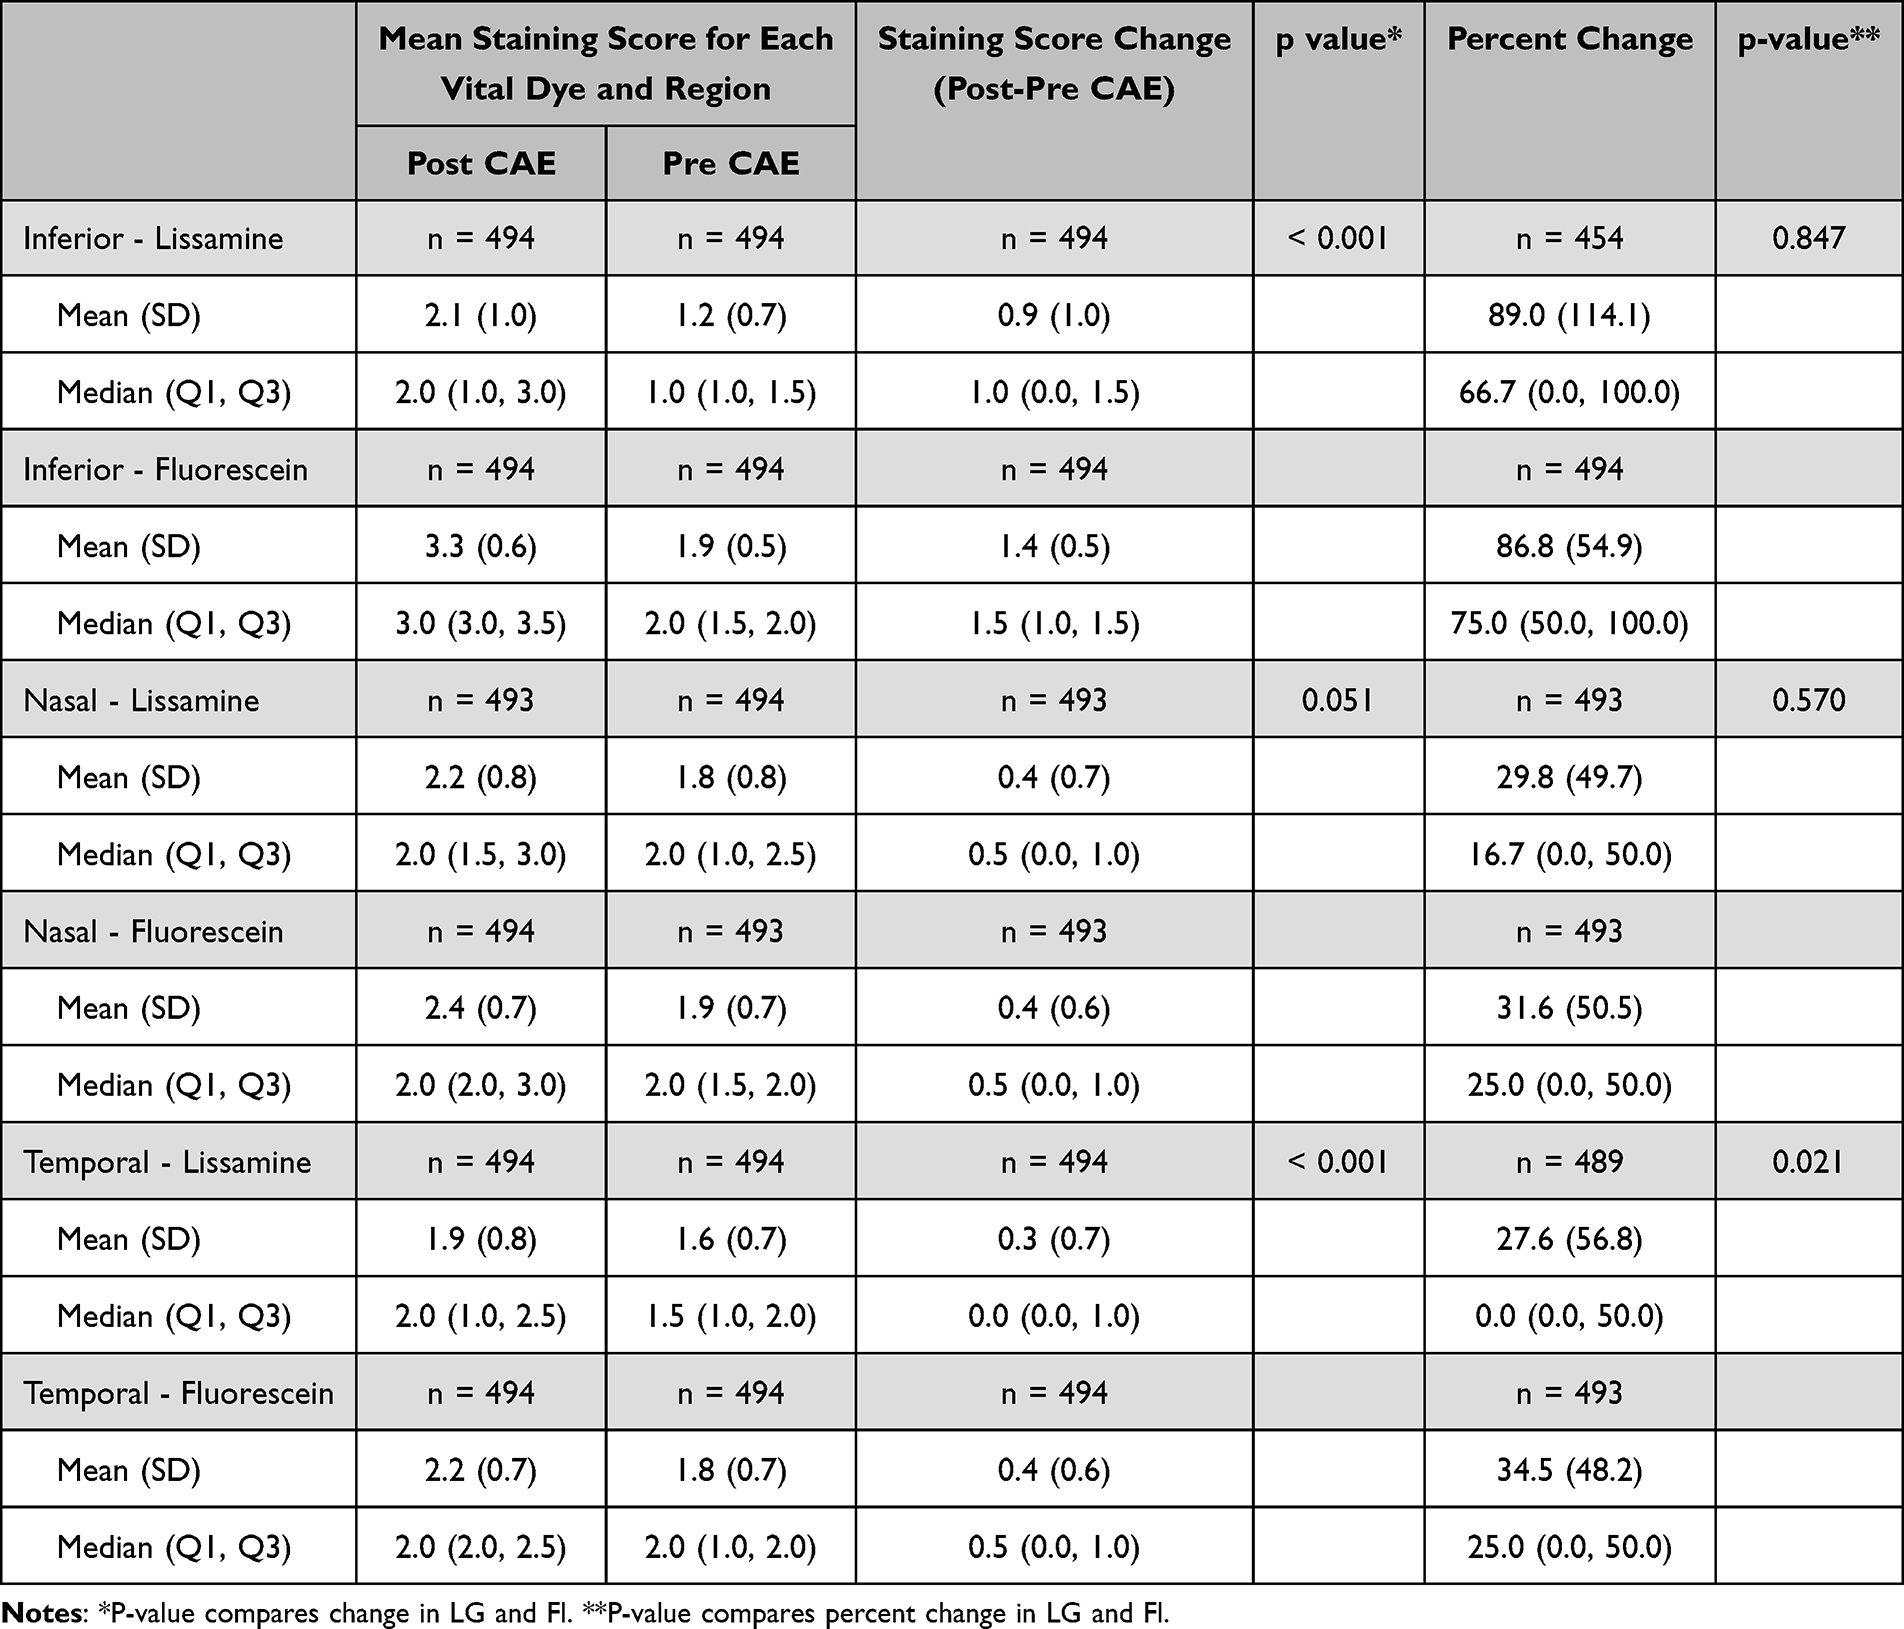 |
Table 1 Lissamine and Fl Staining Scores in the Nasal and Temporal Conjunctiva and Inferior Cornea Pre/Post Controlled Adverse Environment Exposure (CAE) [Visit 1] |
Relative Variation of LG Staining Scores for Each Ocular Region and ST Values
LG staining scores in the nasal conjunctival region demonstrated the greatest difference when assessing various baseline ST score cut points. We found that subjects with baseline ST values less than 8mm had nasal LG staining scores significantly higher [p = 0.039] than subjects who had ST baseline values greater than 8 mm. This significant difference was found only in the nasal region (Figure 2).
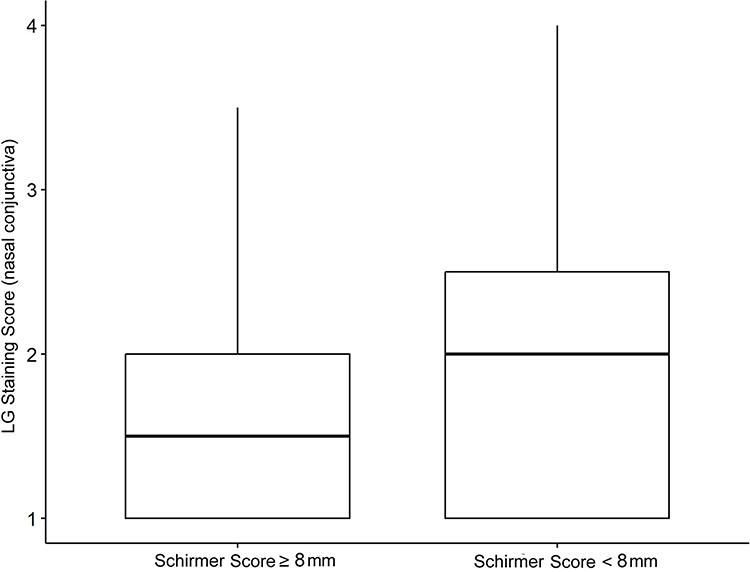 |
Figure 2 Distribution of LG staining scores (nasal conjunctiva) for subjects with Schirmer scores greater and less than 8mm. |
The percentage of patients who had consistent LG results (see column 4) between visits 1 and 2 was greater than the percentage of patients who had consistent Schirmer’s results (32.8%) in all regions, using the 25% percent change from baseline as the threshold value for defining consistency (Table 2). Furthermore, the percentage of patients with consistency of lissamine results was not significantly different between the two groups of patients in each of the ST consistency category, suggesting that LG is the more stable of the two.
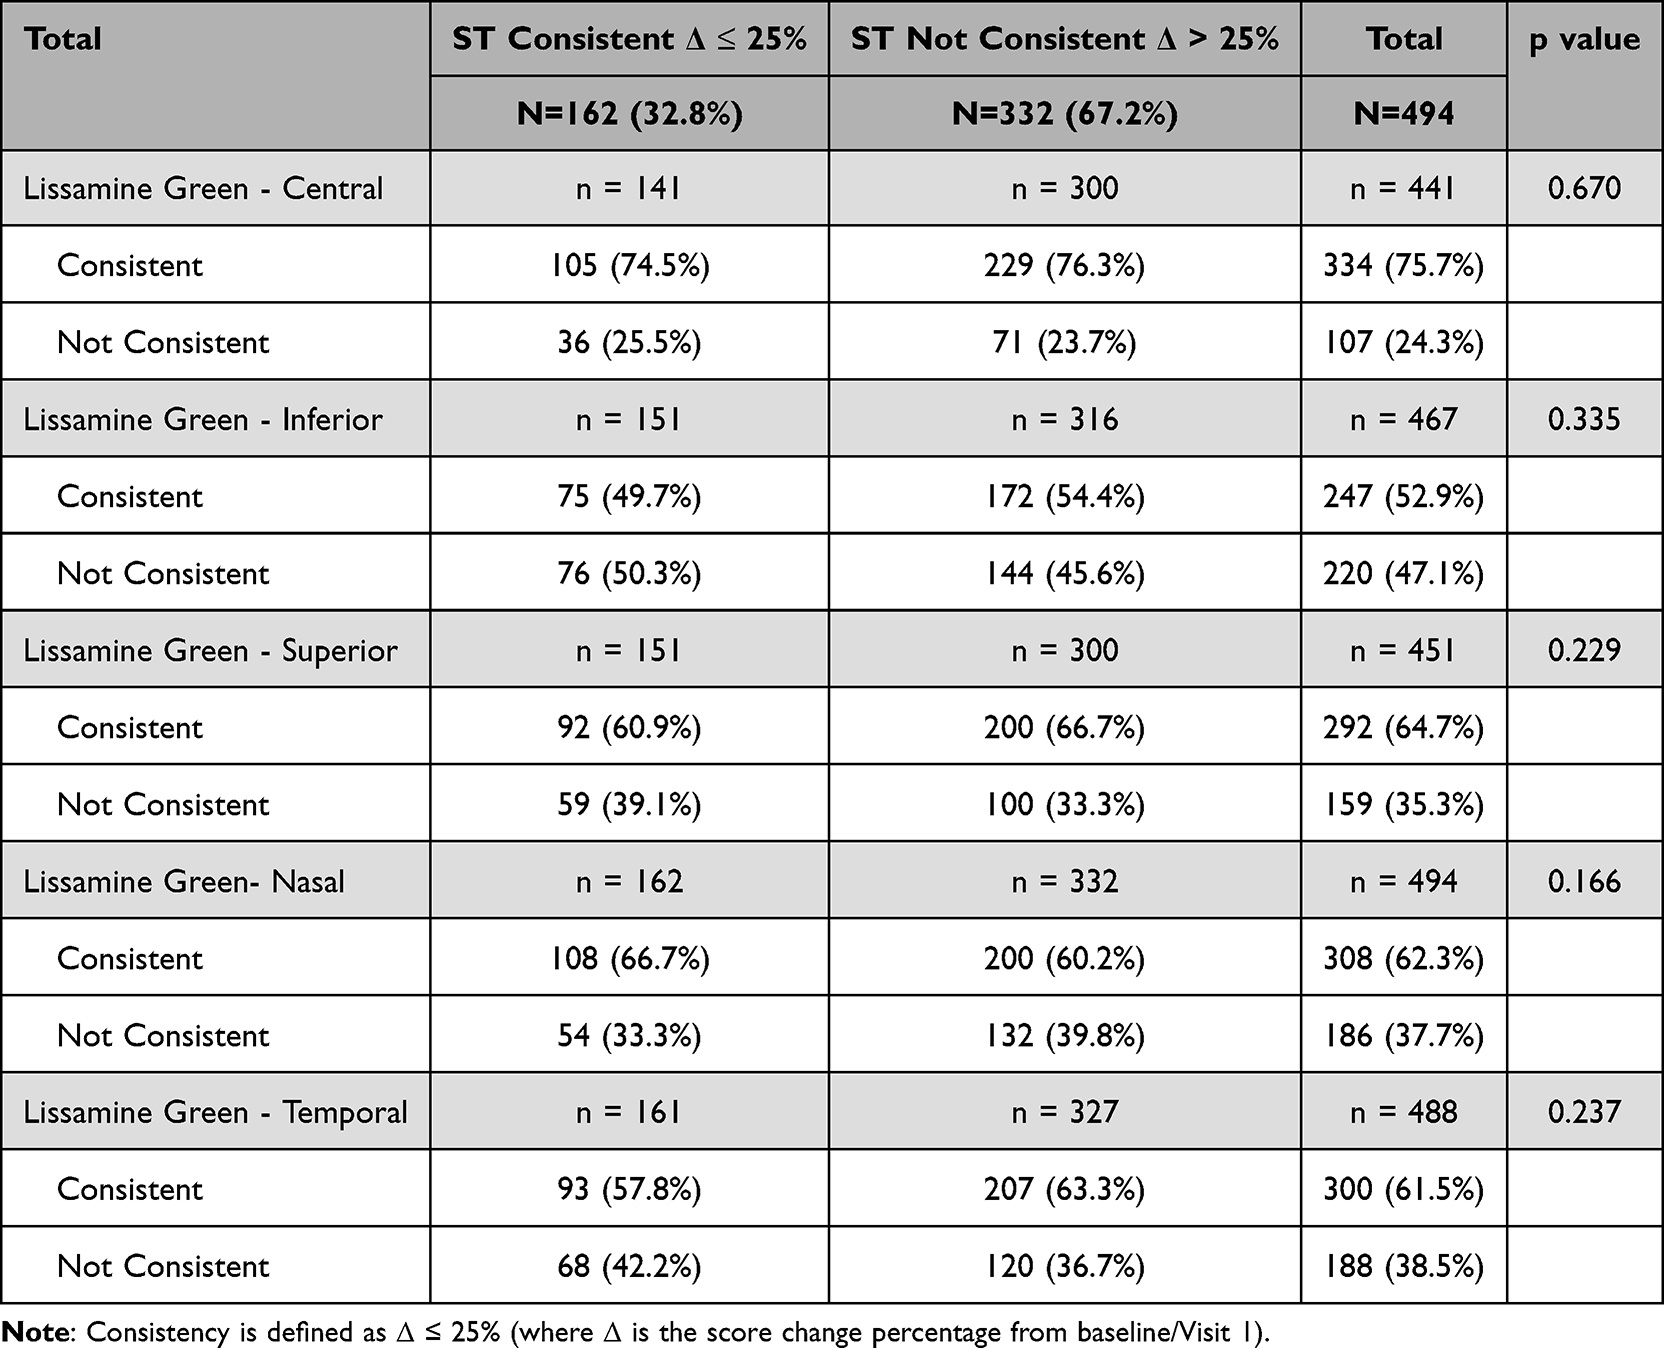 |
Table 2 Consistency of Lissamine Green (LG) Staining Score (Nasal and Temporal Conjunctiva; Inferior, Central and Superior Cornea) Compared to Consistency of Schirmer Score (ST) |
Correlation of LG Staining Score for Each Ocular Region and Symptom Scores
When evaluating the correlation between LG staining scores and symptoms, and ST score and symptoms, LG staining scores had statistically significant correlation with various symptoms on both VAS and SANDE scales such as eye dryness and burning, whereas the ST score does not correlate well with any symptoms (Table 3). Figures 3 and 4 demonstrate this relationship between LG and ST score for subjects with symptoms of eye dryness (VAS scale) and burning (Ocular Discomfort & 4 Symptom Questionnaire).
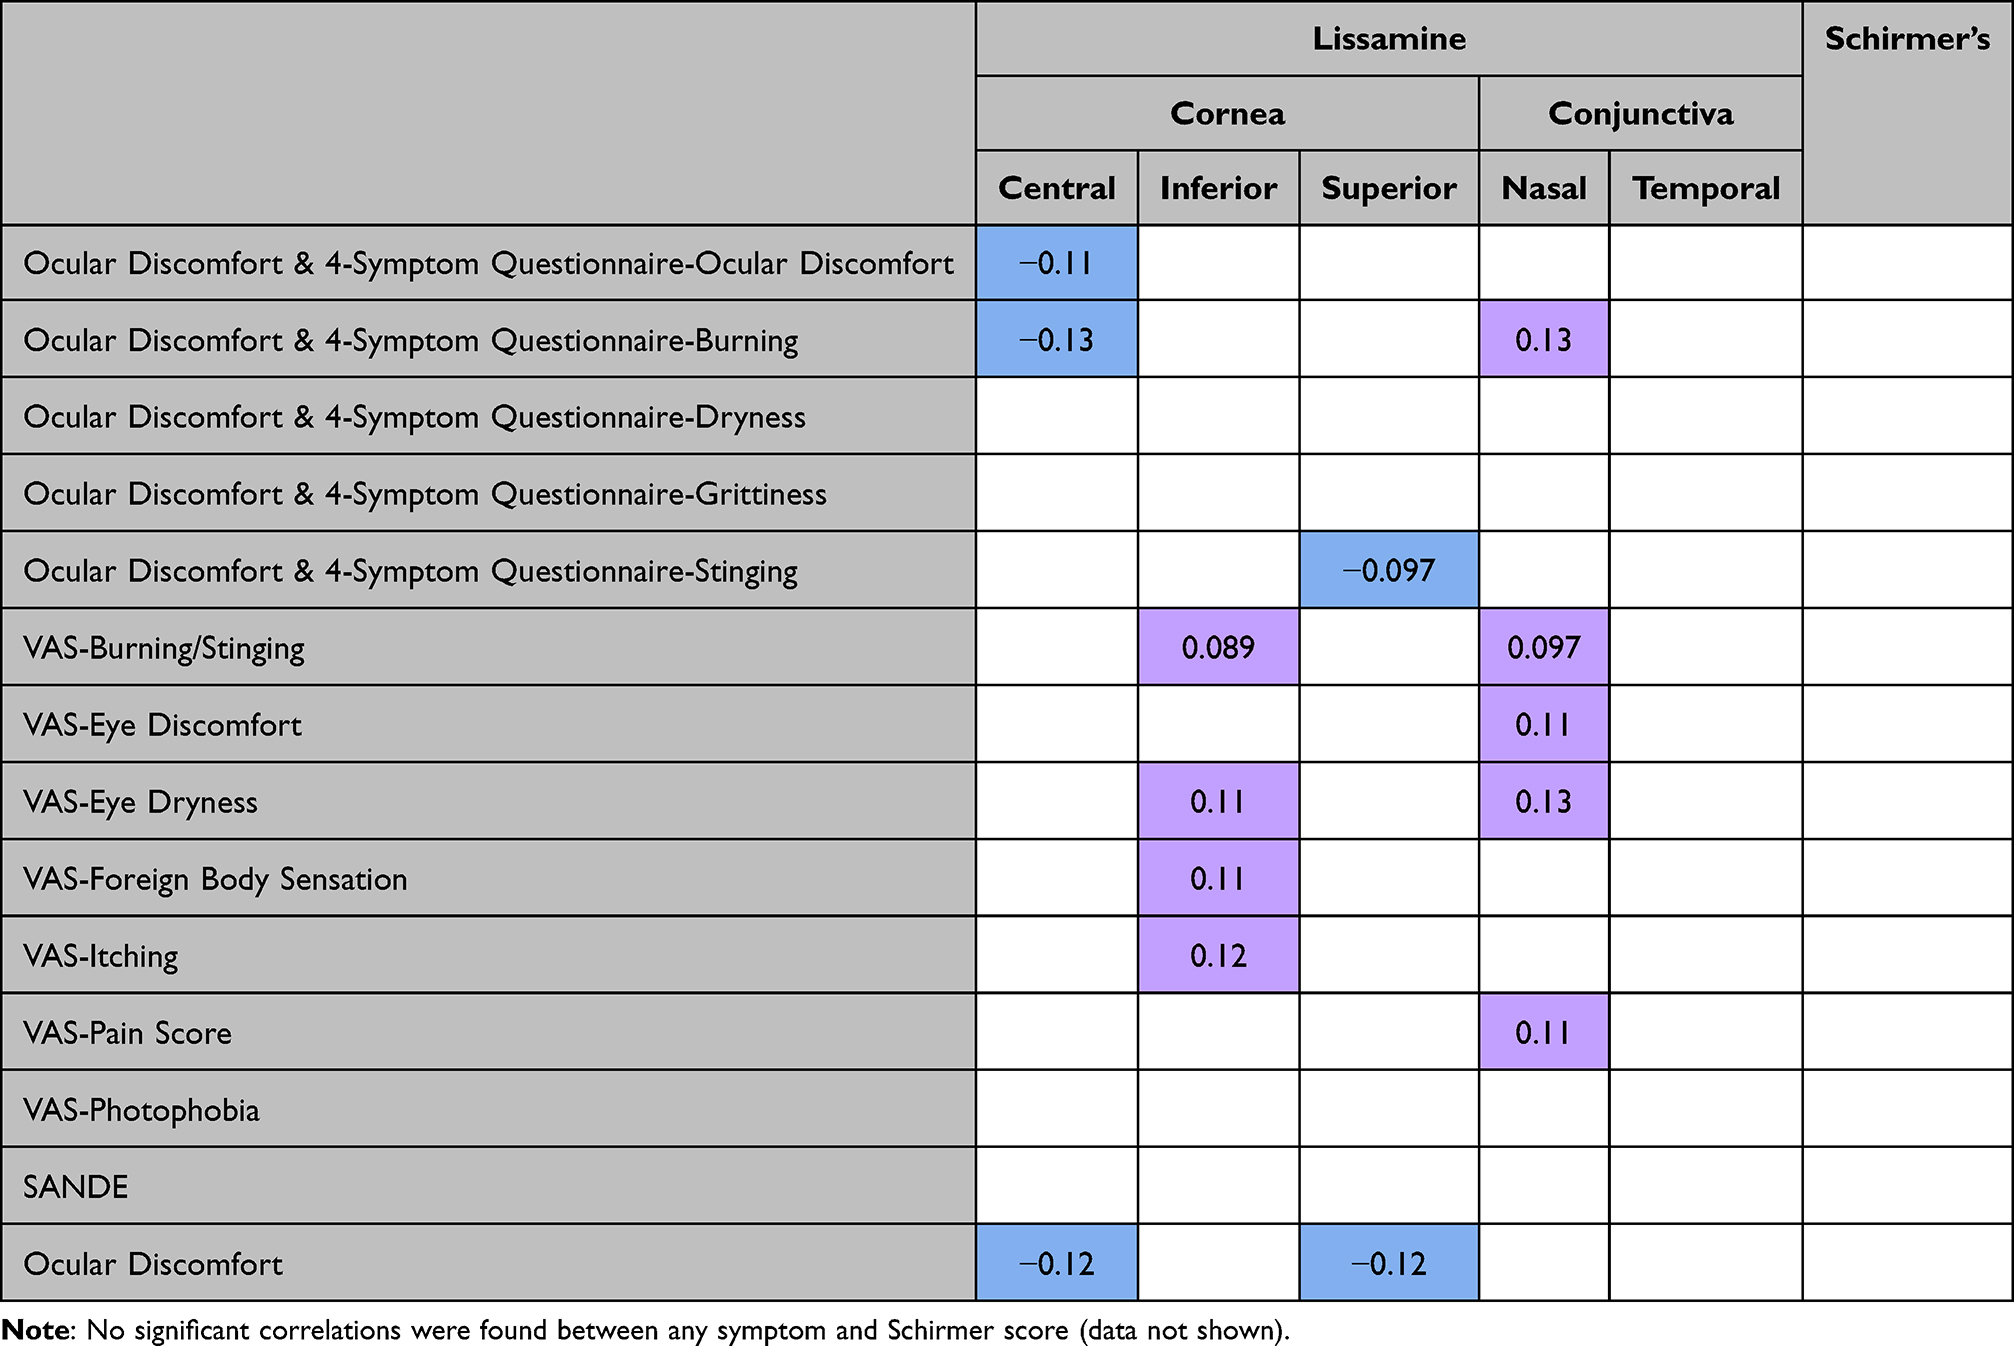 |
Table 3 Significant Positive (Purple) and Negative (Blue) Correlations Between Each Symptom and Lissamine Staining Score for Each Region (Central, Inferior and Superior Cornea; Nasal and Temporal Conjunctiva)) (Non-Significant Correlation Data Not Shown) |
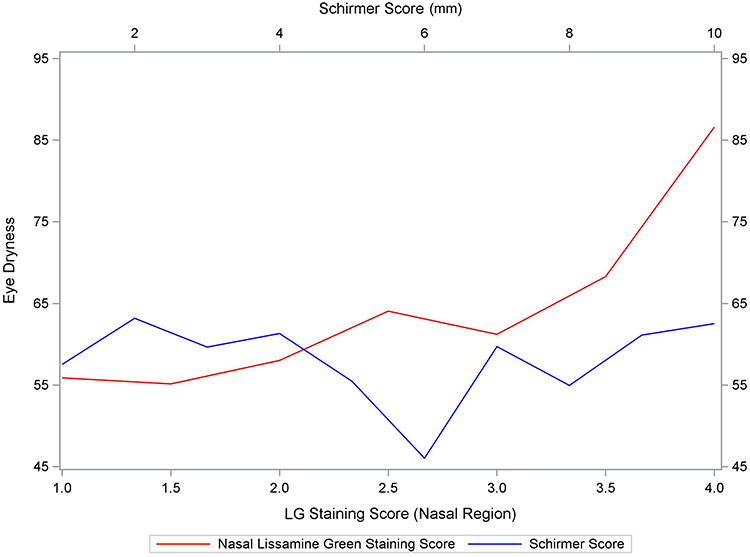 |
Figure 3 Eye dryness (VAS symptom scale) vs LG staining score (nasal conjunctiva) (red) and Schirmer scores (blue). |
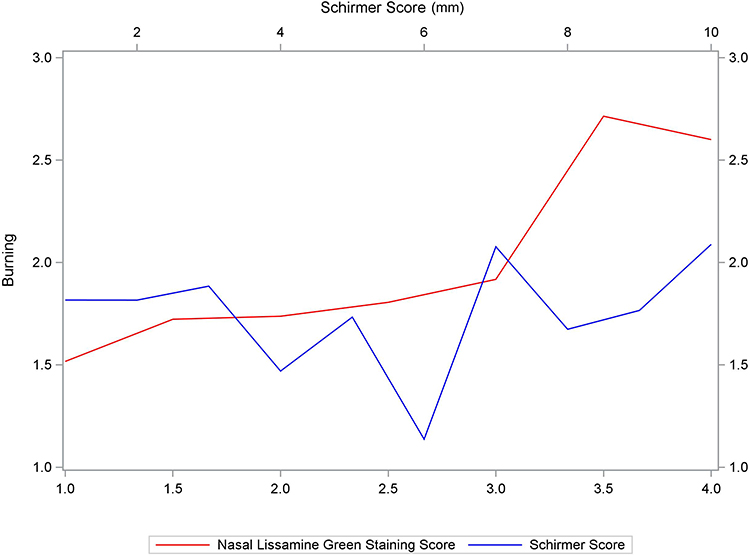 |
Figure 4 Burning (Ocular Discomfort & 4 Symptom Questionnaire) vs LG staining score (nasal conjunctiva) (red) and Schirmer scores (blue). |
Discussion
There are many clinical tests for DED and related ocular surface and symptomatic changes from normal. There are numerous scales for each of these evaluations. They can be grouped into 1) assessment of ocular surface damage, 2) defect in an ocular surface protective function. The former (1) would include vital dye staining, impression cytology, conjunctival vasodilation, visual function to include interblink visual acuity, contrast sensitivity, reading functions. The latter (2) (protective defects) would include palpebral fissure height, blink rate and pattern, reflex tearing delay, ST, functional lid margins and meibomian glands and absence of external ocular disease.
To select a test out of this pool requires reproducibility over time and correlation with disease severity and other functional endpoints. The LG test meets these criteria convincingly, as demonstrated in this study. It is modifiable by environmental factors, remains stable over time and correlates well with both corneal Fl staining and with symptoms unlike the ST score which does not correlate well with symptoms such as eye dryness and burning. This robustness and relevance make LG a critical and potentially standalone test for screening and as a primary endpoint in drug development. Its demonstrated reliability underscores its indispensability in effectively diagnosing and monitoring dry eye disease.
In clinical trials for therapies for DED, the lack of correlation between signs and symptoms results in increased complexity for clinical trial design. Approvals by the FDA typically require separate studies to evaluate efficacy for signs and symptoms.30 The correlations found between several symptom outcomes and LG staining in several ocular regions, although relatively low, are significant and appear to follow a common trend. Surprisingly, several correlations are negative. This may indicate that subject reported symptoms in DED measure other forms of ocular surface discomfort besides actual damage. Understanding that ST scores do not correlate well with symptoms underscores the importance of considering both objective tests (such as LG conjunctival staining) and subjective symptom scales (VAS and SANDE) when making treatment decisions. These results may provide an increased understanding of the relationship between signs and symptoms and eventually more efficient design of clinical trials.
Historically when utilizing ST for clinical evaluation and in clinical research a cutoff of ≤ 10mm was considered clinically meaningful. When ST was dichotomized and compared to nasal LG staining ≤ 8mm was found to have clinical relevance. Those subjects with ST of ≤ 8mm demonstrated more nasal conjunctival LG staining suggesting that at 8mm or less of tear volume ocular surface damage occurs. Conversely, those subjects greater than 8mm on ST had adequate tears to protect the ocular surface evident by lower rates of LG in the nasal conjunctiva.
Evaluating LG staining scores for stability of testing compared to ST showed LG staining to be a more consistent and robust marker over each ocular region. Tear volume measures such as ST experience diurnal variation as well as variability from external factors ie systemic hydration and environment. LG measures ocular surface health where diurnal influences are less impactful. The stability of LG was also seen as the clinical findings were consistent regardless of what location was being evaluated (nasal, temporal, etc). Since, in the context of clinical trials for DED therapies, ST is often used as a primary criterion for inclusion, increased use of LG conjunctival staining for inclusion may allow for decreased rates of screen failures and more effective trial design.
Conclusion
In summary, LG staining of the conjunctiva is a stable, modifiable and clinically relevant endpoint and should be considered as a primary end point in clinical research trials in dry eye drug development. LG staining exhibits greater consistency than Schirmer’s test across multiple visits, suggesting that it can serve as a reliable primary indicator for assessing DED.
Lissamine staining in the nasal region appears to be the appropriate clinical metric for defining dry eye-related ocular surface perturbation. The relation between lissamine nasal staining score, which is indicative of ocular surface pathology, and Schirmer test at 8mm suggests that lowering the metric from the commonly used 10mm to 8mm may be more indicative of the presence of DED.
The correlation between several symptoms of dry eye disease (DED) and Lissamine Green (LG) staining in multiple ocular regions offers significant clinical relevance. By mapping symptom severity and localization, this correlation provides detailed insights into the pathophysiology of DED, such as understanding how different parts of the ocular surface are affected by inflammation, tear film instability, or epithelial damage. This information is crucial for developing targeted interventions that address specific aspects of DED.
In the design of clinical trials, the strong correlation between LG staining and symptoms serves as an objective, quantifiable endpoint that complements subjective symptom scales like VAS and SANDE. This dual approach ensures that trials can measure both the biological effects of therapies and their impact on patient-reported outcomes. Furthermore, the correlation allows for stratification of patients based on their LG staining patterns and symptom profiles, enabling more personalized treatment approaches and improving the accuracy of trial results by identifying subgroups who respond best to specific treatments.
Clinically, the correlation enhances the diagnostic process, allowing for a more precise identification of DED severity and type, which leads to more effective and tailored treatment plans. Regular LG staining assessments may provide a reliable method for monitoring disease progression and treatment efficacy, ensuring timely adjustments in patient management. Additionally, understanding the correlation between LG staining and symptoms aids in patient education, improving compliance with treatment regimens and lifestyle modifications. Overall, this correlation significantly improves the understanding, treatment, and management of DED, leading to better patient outcomes.
Disclosure
JDR, GWO, EB, SB and MBA are employees of Ora, Inc. SK and AH are consultants of Ora, Inc. The authors report no other conflicts of interest in this work.
References
1. Craig JP, Nichols KK, Akpek EK, et al. TFOS DEWS II definition and classification report. Ocul Surf. 2017;15(3):276–283. doi:10.1016/j.jtos.2017.05.008
2. Lemp MA, Foulks GN. The epidemiology of dry eye disease: report of the epidemiology subcommittee of the international dry eye workshop (2007). Ocul Surf. 2007;5(2):93–107.6.
3. Foulks GN. Challenges and pitfalls in clinical trials of treatments for dry eye. Ocul Surf. 2003;1(1):20–30. doi:10.1016/S1542-0124(12)70004-6
4. Savini G, Prabhawasat P, Kojima T, Grueterich M, Espana E, Goto E. The challenge of dry eye diagnosis. Clin Ophthalmol. 2008;2(1):31–55. doi:10.2147/OPTH.S1496
5. Yokoi N, Komuro A. Non-invasive methods of assessing the tear film. Exp Eye Res. 2004;78(3):399–407. doi:10.1016/j.exer.2003.09.020
6. Begley CG, Chalmers RL, Abetz L, et al. The relationship between habitual patient-reported symptoms and clinical signs among patients with dry eye of varying severity. Invest Ophthalmol Vis Sci. 2003;44(11):4753–4761. doi:10.1167/iovs.03-0270
7. Walker PM, Lane KJ, Ousler GW, Abelson MB. Diurnal variation of visual function and the signs and symptoms of dry eye. Cornea. 2010;29(6):607–612. doi:10.1097/ICO.0b013e3181c11e45
8. Kyei S, Dzasimatu SK, Asiedu K, Ayerakwah PA. Association between dry eye symptoms and signs. J Curr Ophthalmol. 2018;30(4):321–325. doi:10.1016/j.joco.2018.05.002
9. Ousler GW, Rimmer D, Smith LM, Abelson MB. Use of the Controlled Adverse Environment (CAE) in clinical research: a review. Ophthalmol Ther. 2017;6(2):263–276. doi:10.1007/s40123-017-0110-x
10. Ousler GW, Gomes PJ, Welch D, Abelson MB. Methodologies for the study of ocular surface disease. Ocul Surf. 2005;3(3):143–154. doi:10.1016/S1542-0124(12)70196-9
11. Roy NS, Wei Y, Kuklinski E, Asbell PA. The growing need for validated biomarkers and endpoints for dry eye clinical research. Invest Ophthalmol Vis Sci. 2017;58(6):BIO1–BIO19. doi:10.1167/iovs.17-21709
12. Bron AJ, Argüeso P, Irkec M, Bright FV. Clinical staining of the ocular surface: mechanisms and interpretations. Prog Retin Eye Res. 2015;44:36–61. doi:10.1016/j.preteyeres.2014.10.001
13. Norn MS. Lissamine green. Vital staining of cornea and conjunctiva. Acta Ophthalmol. 1973;51(4):483–491. doi:10.1111/j.1755-3768.1973.tb06027.x
14. Srinivas SP, Rao SK. Ocular surface staining: current concepts and techniques. Indian J Ophthalmol. 2023;71(4):1080–1089. doi:10.4103/ijo.IJO_2137_22
15. Doughty MJ. Rose bengal staining as an assessment of ocular surface damage and recovery in dry eye disease-a review. Cont Lens Anterior Eye. 2013;36(6):272–280. doi:10.1016/j.clae.2013.07.008
16. Machado LM, Castro RS, Fontes BM. Staining patterns in dry eye syndrome: rose bengal versus LG. Cornea. 2009;28(7):732–734. doi:10.1097/ICO.0b013e3181930c03
17. Sall K, Stevenson OD, Mundorf TK, Reis BL; CsA Phase 3 Study Group. Two multicenter, randomized studies of the efficacy and safety of cyclosporine ophthalmic emulsion in moderate to severe dry eye disease. Ophthalmology. 2000;107(4):631–639. doi:10.1016/S0161-6420(99)00176-1
18. Sheppard JD, Torkildsen GL, Lonsdale JD, et al.; OPUS-1 Study Group. Lifitegrast ophthalmic solution 5.0% for treatment of dry eye disease: results of the OPUS-1 phase 3 study. Ophthalmology. 2014;121(2):475–483. doi:10.1016/j.ophtha.2013.09.015
19. Cho P, Yap M. Schirmer test. I. A review. Optom Vis Sci. 1993;70(2):152–156. doi:10.1097/00006324-199302000-00011
20. Begley C, Caffery B, Chalmers R, Situ P, Simpson T, Nelson JD. Review and analysis of grading scales for ocular surface staining. Ocul Surf. 2019;17(2):208–220. doi:10.1016/j.jtos.2019.01.004
21. Van Bijsterveld OP. Diagnostic tests in the Sicca syndrome. Arch Ophthalmol. 1969;82(1):10–14. doi:10.1001/archopht.1969.00990020012003
22. Sheppard JD, Wirta DL, McLaurin E, et al. A water-free 0.1% cyclosporine a solution for treatment of dry eye disease: results of the randomized Phase 2B/3 ESSENCE study. Cornea. 2021;40(10):1290–1297. doi:10.1097/ICO.0000000000002633
23. Study of TOP1630 for Dry Eye Syndrome (THEIA-1). Available from: https://clinicaltrials.gov/study/NCT03833388.
24. Ousler GW, Jordan R, Spana C. Effectiveness of PL9643 in treating the signs and symptoms of moderate to severe dry eye disease including a subpopulation of hyper-responders to CAE® challenge: results from 2 independent clinical trials. Invest Ophthalmol Vis Sci. 2023;64(8):3969.
25. Muñoz-Villegas PDC, Sánchez-Ríos A, Olvera-Montaño O. The effect of sodium hyaluronate eye drops 2, 4 or 6 times a day on signs and symptoms of dry eye disease. Clin Ophthalmol. 2023;17:2945–2955. doi:10.2147/OPTH.S433709
26. Ousler G, Devries DK, Karpecki PM, Ciolino JB. An evaluation of Retaine™ ophthalmic emulsion in the management of tear film stability and ocular surface staining in patients diagnosed with dry eye. Clin Ophthalmol. 2015;9:235–243. doi:10.2147/OPTH.S75297
27. Abelson MB, Rimmer DW, Ousler G. Diagnosing dry eye: it’s now a fine art. Ophthalmol Manag. 2016;20:48–50.
28. Schaumberg DA, Gulati A, Mathers WD, et al. Development and validation of a short global dry eye symptom index. Ocul Surf. 2007;5(1):50–57. doi:10.1016/S1542-0124(12)70053-8
29. Holland EJ, Luchs J, Karpecki PM, et al. Lifitegrast for the treatment of dry eye disease: results of a Phase III, randomized, double-masked, placebo-controlled trial (OPUS-3). Ophthalmology. 2017;124(1):53–60. doi:10.1016/j.ophtha.2016.09.025
30. Cui D, Saldanha IJ, Li G, Mathews PM, Lin MX, Akpek EK. United States regulatory approval of topical treatments for dry eye. Am J Ophthalmol. 2024;258:14–21. doi:10.1016/j.ajo.2023.09.024
 © 2024 The Author(s). This work is published and licensed by Dove Medical Press Limited. The
full terms of this license are available at https://www.dovepress.com/terms.php
and incorporate the Creative Commons Attribution
- Non Commercial (unported, v3.0) License.
By accessing the work you hereby accept the Terms. Non-commercial uses of the work are permitted
without any further permission from Dove Medical Press Limited, provided the work is properly
attributed. For permission for commercial use of this work, please see paragraphs 4.2 and 5 of our Terms.
© 2024 The Author(s). This work is published and licensed by Dove Medical Press Limited. The
full terms of this license are available at https://www.dovepress.com/terms.php
and incorporate the Creative Commons Attribution
- Non Commercial (unported, v3.0) License.
By accessing the work you hereby accept the Terms. Non-commercial uses of the work are permitted
without any further permission from Dove Medical Press Limited, provided the work is properly
attributed. For permission for commercial use of this work, please see paragraphs 4.2 and 5 of our Terms.