")
Back to Journals » Drug Design, Development and Therapy » Volume 18
Alisol A, the Eye-Entering Ingredient of Alisma orientale, Relieves Macular Edema Through TNF-α as Revealed by UPLC-Triple-TOF/MS, Network Pharmacology, and Zebrafish Verification
Authors Shen R, Cheng K, Li G, Pan Z, Qiaolongbatu X, Wang Y , Ma C, Huang X, Wang L, Li W, Wang Y, Jing L, Fan G, Wu Z
Received 9 March 2024
Accepted for publication 8 July 2024
Published 30 July 2024 Volume 2024:18 Pages 3361—3382
DOI https://doi.org/10.2147/DDDT.S468119
Checked for plagiarism Yes
Review by Single anonymous peer review
Peer reviewer comments 2
Editor who approved publication: Prof. Dr. Georgios Panos
Rui Shen,1,2,* Kebin Cheng,3,* Guanyi Li,1 Zhendong Pan,4 Xijier Qiaolongbatu,1 Yuting Wang,1 Cui Ma,1 Xucong Huang,1 Li Wang,1 Wenjing Li,1 Yuanyuan Wang,2 Lili Jing,1 Guorong Fan,2 Zhenghua Wu2
1School of Pharmaceutical Sciences, Shanghai Jiao Tong University, Shanghai, 200240, People’s Republic of China; 2Department of Clinical Pharmacy, Shanghai General Hospital, Shanghai Jiao Tong University School of Medicine, Shanghai, 200080, People’s Republic of China; 3Department of Respiratory and Critical Care Medicine, Shanghai Pulmonary Hospital, School of Medicine, Tongji University, Shanghai, 200433, People’s Republic of China; 4Department of Clinical Pharmacy, Eye and ENT Hospital, Fudan University, Shanghai, 200031, People’s Republic of China
*These authors contributed equally to this work
Correspondence: Zhenghua Wu, Department of Clinical Pharmacy, Shanghai General Hospital, Shanghai Jiao Tong University School of Medicine, No. 85 Wujin Road, Shanghai, 200080, People’s Republic of China, Tel +86-159-0161-7923, Email [email protected]
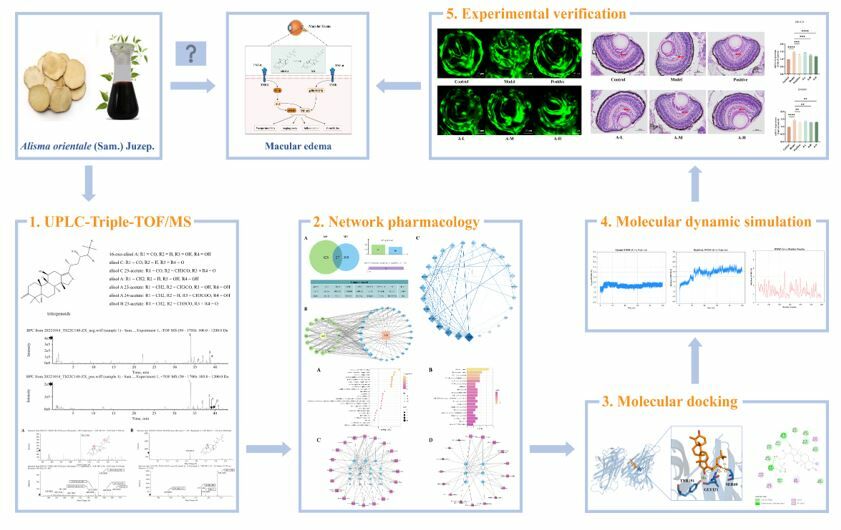
Purpose: Alisma orientale (AO, Alisma orientale (Sam). Juzep) has been widely employed for the treatment of macular edema (ME) in traditional Chinese medicine due to its renowned water-relief properties. Nonetheless, the comprehensive investigation of AO in alleviating ME remained unexplored. This study aims to identify the active components of AO that target the eye and investigate its pharmacological effects and mechanisms on ME.
Methods: The study commenced with UPLC-Triple-TOF/MS analysis to identify the primary constituents of AO. Zebrafish eye tissues were then analyzed after a five-day administration of AO to detect absorbed components and metabolites. Subsequently, network pharmacology, molecular docking, and molecular dynamics simulations were employed to predict the mechanisms of ME treatment via biological target pathways. In vivo experiments were conducted to corroborate the pharmacological actions and mechanisms.
Results: A total of 7 compounds, consisting of 2 prototype ingredients and 5 metabolites (including isomers), were found to traverse the blood-eye barrier and localized within eye tissues. Network pharmacology results showed that AO played a role in the treatment of ME mainly by regulating the pathway network of PI3K-AKT and MAPK with TNF-α centered. Computational analyses suggested that 11-dehydro-16-oxo-24-deoxy-alisol A, a metabolite of alisol A, mitigates edema through TNF-α inhibition. Furthermore, zebrafish fundus confocal experiments and HE staining of eyes confirmed the attenuating effects of alisol A on fundus angiogenesis and ocular edema, representing the first report of AO’s ME-inhibitory effects.
Conclusion: In this study, computational analyses with experimental validation were used to understand the biological activity and mechanism of alisol A in the treatment of ME. The findings shed light on the bioactive constituents and pharmacological actions of AO, offering valuable insights and a theoretical foundation for its clinical application in managing ME.
Keywords: Alisma orientale, macular edema, network pharmacology, zebrafish, TNF-α
Graphical Abstract:
Introduction
Macular edema (ME) is formed when the inner and outer space of the retinal cells in the macular area expand locally and the liquid infiltrates and accumulates.1 It is the main cause of functional vision loss caused by retinal vascular or ocular inflammatory diseases. This complication is frequently associated with non-characteristic intraocular or systemic diseases, such as retinal vein occlusion, diabetic retinopathy (DR), chronic uveitis, and age-related macular degeneration. There are many inducing mechanisms of ME, but the specific details are unknown. Current research suggests that the disruption of the blood-retinal barrier (BRB), the inflammatory response, the release of cytokines, ischemic and hypoxic conditions, and others play a major role in the development of ME.2 Amongst them, tumor necrosis factor-α (TNF-α) is a classic, pleiotropic inflammatory mediator that involves a variety of biological processes, including vasodilatation, edema, facilitation of the adhesion of leukocytes, and so forth.3 According to the statistical research, it has been observed that the levels of TNF-α in both the serum and aqueous humor of individuals diagnosed with diabetic macular edema (DME) exhibit a marked increase, which could increase vascular permeability, lead to the progressive destruction of BRB, and play an important part in the occurrence and development of DME.4 Whether it is a basic disease of diabetes or angiogenesis, there is persistent chronic inflammation and drugs that inhibited TNF-α might be useful for the treatment of DME in the future.5,6
In traditional Chinese medicine (TCM), ME is attributed to deficiencies in qi, blood, yin, and yang, leading to water and dampness stagnation, and long-term phlegm and blood stasis, which block the eye’s collaterals.7 Data mining of literature and prescriptions has identified a pattern in TCM for treating ME, highlighting the frequent use of Alisma orientale (AO) for water relief.8–10 The esteemed ancient text “Shen Nong’s Herbal Classic” characterizes AO as having sweet, light, and cold properties that make it effective for diarrhea, oliguria, dizziness, painful urination, and high lipid levels.11 Additionally, the “Enlightening Primer of Materia Medica”, a canonical text authored by Hanmo Chen and referenced in the widely regarded “Compendium of Materia Medica”, documents AO’s ability to alleviate head rotation symptoms and improve sensory function, especially for the ears and eyes. AO with proper dosing facilitates drainage of excess fluids and removal of impurities to enhance vision. These therapeutic indications align seamlessly with the etiology and pathology of ME. Research has shed light on the various chemical constituents of AO, which include triterpenes, sesquiterpenes, diterpenes, sugars, nitrogenous compounds, and phenylpropanoids.12 Among the diverse array of constituents, a set of five primary triterpenoids, namely alisol A, alisol B, alisol C 23-acetate, alisol A 24-acetate, and alisol B 23-acetate, have been noted for their remarkable biological properties in the treatment of ME, particularly in alleviating edema, inflammation, blood sugar, and lipid levels.13–16 Specifically, Jia et al suggest that triterpenoids derived from AO can diminish the expression of TNF-α and mitigate damage to the AMPK/JNK and IRS-1/PI3K/Akt/GLUT4-mediated skeletal muscle insulin signal transduction pathway,17 indicating a potential role in DME treatment by enhancing the underlying conditions. In addition, these triterpenoids might mediate beneficial effects by blocking the PI3K/Akt/mTOR signaling pathway.18–20
In this investigation, we utilized UPLC-Triple-TOF/MS to isolate and identify the constituents and metabolites of AO extract that could enter the eye. This approach was complemented with network pharmacology, molecular docking, molecular dynamics simulation, and experimental validation, to elucidate the AO’s potential targets and mechanisms of ameliorating ME. These findings collectively furnished a theoretical basis for the exploitation of AO in the treatment of ME.
Materials and Methods
Materials and Reagents
Alisma orientale (AO, Alisma orientale (Sam). Juzep., originating from Sichuan Province, China. No. 20,221,221) was obtained from Shanghai WanShiCheng Traditional Chinese Medicine Products Co., Ltd. The plant name was confirmed through “World Flora Online” (https://www.worldfloraonline.org/) on Jan. 28, 2024. The following reference standards were purchased from Yuanye Biotech Co., Ltd. (Shanghai, China): alisol A (purity ≥98%), 23-acetate alisol B (purity ≥98%), 23-acetate alisol C (purity ≥98%), 16-oxo-alisol A (purity ≥98%), and alisol C (purity ≥95%). Methanol (mass spectrometry grade), acetonitrile (chromatography grade), and formic acid (chromatography grade) were supplied by Shanghai Anpu Experiment Technology Co., Ltd.
Preparation of AO Extractum
AO crude drugs (approximately 500 g) were decocted twice with water for 2 h each time, then the resulting decoctions were merged and subjected to filtration. The supernatant, acquired after standing, was condensed to a clear, creamy consistency with a relative density between 1.16 and 1.22 at 60 °C. Two times amount of ethanol was incorporated and thoroughly blended in and thereafter left to stand for a duration of 24 hours before being filtered. The residual filter matter was washed with 60% ethanol, which was subsequently combined with the filtrate. Lastly, the ethanol was recovered and the remaining solution was condensed to yield a thick paste with a relative density of 1.36 at 50 °C. Roughly 309 g of the final product was eventually obtained.
Experimental Animals and Drug Administration
Zebrafish were reared under standard conditions at a temperature of 28.5 °C with a light/dark cycle of 14 h/10 h and were fed brine shrimp twice a day. This study adhered to the Guide for the Care and Use of Laboratory Animals, the guidelines of ARRIVE (Animal Research: Reporting of In Vivo Experiments), and relevant Chinese laws and regulations. Approval for the experiment was obtained from the Institutional Animal Care and Use Committee of Shanghai Jiao Tong University (approval number A2018075).
Healthy adult zebrafish (AB strain, male) were randomly divided into blank control group and AO group, with 5 in each group. The blank control group was given zebrafish aquaculture water, and the AO group was given 100 µg/mL AO extract.21 Zebrafish in each group were taken out of the tank and soaked in the corresponding solution for 20 min for five consecutive days. The tank was not connected into the circulation system, and the water was changed every day. After the administration, the zebrafish were put to death on ice, and each group was combined to collect enough samples for further detection by UPLC-Triple-TOF/MS.22,23
Ocular Tissue Samples Collection and Pretreatment
Ocular tissue samples from zebrafish were collected and placed in a 2 mL tube to facilitate extraction. About 250 μL of acetonitrile was added to homogenize the tissues and mix efficiently. After centrifuging for 3 min at 13,000 rpm, 200 μL of supernatant was collected and subjected to filtration through 0.22 μm filter. Finally, 10 μL of each prepared sample was then employed for further analysis.24
UPLC-Triple-TOF/MS Analysis
During the UPLC analysis, the Waters H-Class ultra-high performance liquid chromatography system (Waters Technology Co., Ltd.) and an Agilent ZORBAX RRHD SB-Aq chromatographic column (2.1 × 100 mm, 1.8 µm) was employed. The mobile phase A consisted of acetonitrile, while the mobile phase B was a 0.1% formic acid aqueous solution. To achieve optimal separation, a gradient elution method was adopted. The specific gradient profile was as follows: 0–3 min, 100% B; 3–7 min, 100–95% B; 7–12 min, 95–90% B; 12–22 min, 90–80% B; 22–30 min, 80–70% B; 30–35 min, 70–55% B; 35–40 min, 55–30% B; 40–45 min, 30–5% B; 45–47 min, 5% B; 47–47.1 min, 5–100% B; 47.1–50 min, 100% B. Additionally, the flow rate was set at 0.3 mL/min, the column temperature was maintained at a constant 30 °C and the injection volume was 2 µL.
For mass spectrometry analysis, the AB Sciex Triple TOF® 4600 high-resolution mass spectrometer (SCIEX company) was employed. The ESI-Negative/Positive ion mode detection mode was applied and the specific mass spectrometry conditions were as follows: scan range, 50–1700 m/z (MS) and 50–1250 m/z (MS/MS); nebulizer gas pressure, 50 psi; curtain gas pressure, 35 psi; ion source temperature, 500 °C; ion spray voltage, −4500/5000 V; declustering potential, 100 V; collision energy, 10 eV (MS) and ± 40 eV (MS/MS); collision energy spread, 20 eV; ion release delay, 30 ms; ion release width, 15 ms.
Identification of Structures and ADME Prediction
According to the analysis strategy of UPLC-Triple-TOF/MS and referring to relevant literature, the prototype components and metabolites of AO extract in eyes were determined. The molecular structures of prototype components in eyes were obtained from the PubChem database (https://pubchem.ncbi.nlm.nih.gov). The theoretical active site for metabolic reactions was predicted using SMARTCyp (https://smartcyp.sund.ku.dk/mol_to_som), and the putative structure of the metabolite was rendered using ChemDraw software. In addition, the relevant parameters of absorption, distribution, metabolism, and excretion (ADME) were predicted by SwissADME (http://www.swissadme.ch).
Network Pharmacology
Targets of AO Extract Against ME
All the identified compounds of the components and metabolites from AO extract were imported into SwissTargetPrediction (http://www.swisstargetprediction.ch) to identify potential targets in Homo sapiens.
To identify potential targets associated with ME, a thorough search was conducted using various databases including DisGeNET (https://www.disgenet.org), OMIM (https://www.omim.org), GeneCards (https://www.genecards.org), and DRUGBANK (https://www.drugbank.com) with “macular edema” as the primary search term. In particular, the relevance score setting in GeneCards is greater than 10 to screen out more relevant targets. After merging and duplicating the targets of the above databases, the targets related to ME were obtained.25
The active component targets of AO extract and the disease targets of ME were imported into the online tool jvenn (http://jvenn.toulouse.inra.fr/app/example.html) to obtain the common targets of the two, which were the potential targets of AO in the treatment of ME.
C-T-D Network Construction
By incorporating active compounds, common targets, and diseases, a comprehensive representation of the compound-target-disease (CTD) network was achieved through Cytoscape 3.9.1 software. In the network diagram, nodes were designated to represent drugs, active compounds, targets, and diseases. These nodes were interconnected by edges to illustrate their interactions. The degree value, a topological property that reveals the importance of compounds/targets/pathways in the network diagram, was calculated by network analysis tools. Furthermore, the targets were sorted by the degree value, and the target with the highest connectivity is considered to be the key target.
Screening of Core Targets Through PPI Network
To identify core targets of AO for ME, we imported the corresponding proteins into the STRING database (https://cn.string-db.org). We set “Homo sapiens” as the protein species and the minimum confidence threshold as “medium confidence (0.400)” for analysis. The protein–protein interaction (PPI) network was constructed and exported as a target protein information table. Cytoscape 3.9.1 software was utilized to visualize and analyze the network topology parameters. Core targets were then screened from the PPI network based on these parameters.26
KEGG and GO Pathway Enrichment Analysis
KEGG and GO pathway enrichment analysis were conducted by using the Metascape database (https://metascape.org/gp/index.html) to investigate the underlying signaling pathways associated with AO’s therapeutic effects on ME. In the analysis, the p value was set to less than 0.01, and the minimum number of overlapping targets was set to 3.
Molecular Docking
Molecular docking was used to verify the binding affinity between the active ingredient and the target. AutoDock 4, a highly accurate program for molecular docking, particularly important in predicting binding conformations and energies of ligands to receptors,27 was used as the molecular docking program for this study.
The crystal structure of TNF-α was retrieved from the Protein Data Bank (PDB, https://www.rcsb.org) with the specific PDB ID 2AZ5. The structure of compound was generated, and conformation was optimized to attain the minimum energy conformation. The system was meticulously prepared by adding hydrogen atoms and inspecting charges. Essential parameters and configuration files for molecular docking were also defined and generated. Molecular docking was then carried out using AutoDock 4.2.6. To ensure the reliability of the docking result, we executed each docking procedure iteratively for a total of 50 runs. From each cluster of docking results, the docking pose with the lowest energy was selected to gather the structural models. These models were subsequently visualized using PyMOL 2.5.5 and BIOVIA Discovery Studio Visualizer (Discovery Studio Visualizer v24.1.0.23298).
Molecular Dynamics Simulation
The TNF-α-M4 complex was prepared with the tLeap module in AmberTools23. The AMBER force field ff14SB28 was utilized for the protein, while the generalized AMBER force field (GAFF)29 was utilized for the ligand. TIP3P water molecules were used to solvate the system, ensuring a minimum distance of 10 Å between the protein atoms and the edges of the solvate box. To neutralize the system, 8 Na+ ions were added.
Molecular dynamics simulation was performed using the AMBER20 package.30 The system underwent energy minimization in two stages: the first stage consisted of 5000 steps with protein constrained by a force of 200 kcal/mol/Å2, while the second stage consisted of another 5000 steps with no constraints. In both stages, the first 1000 steps employed the steepest descent algorithm, followed by 4000 steps using the conjugate gradient algorithm. Subsequently, the system was gradually heated from 0 to 300 K using the Langevin31 thermostat in 100 ps and equilibrated to 1 atm in 100 ps with 2.0 kcal/mol/Å2 constraint force. Next, a 100 ps equilibration was performed at 300 K and 1 atm with no constraint. Finally, a 100 ns production run was submitted. During the entire process of production, the time step was set to 2 fs. The periodic boundary was utilized, and the SHAKE32 algorithm was used to constrain all covalent bonds involving hydrogen atoms. Particle Mesh Ewald (PME) method33 was used to calculate long-range electrostatic interactions, and the cutoff value was set to 8 Å.
After the 100 ns production, root-mean-square deviation (RMSD) and the root-mean-square fluctuation (RMSF) were calculated by CPPTRAJ in AmberTools23 to investigate the fluctuation of the system.
In vivo Experimental Verification
Zebrafish Model Construction and Administration
Zebrafish embryos of the Tg (flk-GFP) strain were utilized to establish disease model. After 3 days post fertilization (DPF), embryos exhibiting normal morphology were randomly distributed into 24-well plates at a density of 15 embryos per well. Subsequently, the embryos were incubated in accordance with the standard conditions. The zebrafish hatching water was supplemented with 0.003% propylthiouracil (PTU) to inhibit melanin formation, thus facilitating the observation of blood vessels in subsequent experiments. Except for the control group, zebrafish embryos with 3 DPF were incubated in a 30 mmol/L glucose medium for an additional 7 days to induce DR and establish the ME model.34,35 After this duration, fundus images of the zebrafish were captured. Successful modeling was determined by the presence of enlarged retinal blood vessels, impaired blood vessels, or significant branching of blood vessels, in comparison to the blank group.
The successfully modeled zebrafish embryos were divided into various treatment groups: the model group, the positive control group, and the alisol A administration groups of different doses. The doses of the therapeutic drugs were referred to in the literature.36,37 Each group was cultured and administered with specific conditions as follows: the blank group (E3+0.003% PTU), the model group (E3+0.003% PTU+30 mM glucose), the positive drug group (E3+0.003% PTU+30 mM glucose+25 μM prednisolone), the alisol A of low-dose group (A-L, E3+0.003% PTU+30 mM glucose+3 μM alisol A), the alisol A of medium-dose group (A-M, E3+0.003% PTU+30 mM glucose+10 μM alisol A), and the alisol A of high-dose group (A-H, E3+0.003% PTU+30 mM glucose+30 μM alisol A). The culture medium was replaced every 24 hours for a consecutive period of 7 days. Each group contains 15 samples, of which 5 for laser confocal microscopy imaging, 5 for HE staining, 5 for RT-qPCR.
Laser Confocal Microscopy Imaging
Zebrafish embryos from each group were briefly anesthetized and observed using a fluorescence microscope (Olympus MVX10, Japan) equipped with a digital camera (ColorView II, Soft Imaging System, Olympus). Subsequently, the embryos were fixed in 1% low-melt agarose and their visual properties were captured utilizing a confocal microscope Leica SP8 microsystems (Leica, Heidelberg, DE, Germany).
HE Staining
Zebrafish samples were fixed in 4% paraformaldehyde, dehydrated, embedded, sliced, and refrigerated. Hematoxylin and eosin staining were then performed to, respectively, stain the nuclei and cytoplasm. The samples were subsequently observed and photographed using a microscope.
RT-qPCR
Based on the results obtained from GO and KEGG enrichment analysis in network pharmacology, two potential components, PI3K and eNOS, were chosen from the pathway net with TNF-α centered to conduct the verification experiments. Since the experimental tissues were taken from zebrafish samples, two protein targets of PIK3CB (the homologous site of PI3K) and ENOSF1 (the homologous site of eNOS) were finally selected for the experiments after searching and integrating through the UniProt database. Total RNA was extracted using Trizol reagent (Beijing, China) and subsequently treated with RNase-free DNase (Promega, Beijing, China). Reverse transcription was then performed using oligo-DT (Beijing, China) and MMLV (TOYOBO, Shanghai, China) reverse transcriptase in accordance with the manufacturer’s instructions. The reaction was conducted in a PCR machine (Applied Biosystems, Foster City, CA, USA) under the following conditions: 65 °C for 5 min, 37 °C for 60 min, 99 °C for 5 min, and 4 °C for 5 min. For primer synthesis, Saiheng Biotechnology Co., Ltd (Shanghai, China) was enlisted, and the primer sequences are provided below.
PIK3CB-F: 5’-TCGCGAGAGTACCATCCAAC-3’
PIK3CB-R: 5’-GGTCGCACATCACATAGTCG-3’
ENOSF1-F: 5’-GCCGTATTGAATGCTGTCTG-3’
ENOSF1-R: 5’-TCTAAAGCTTCCTGCTCCGT-3’
Quantitative real-time polymerase chain reaction (RT-qPCR) was performed using SYBRTM Green Master Mix (Vazyme, Beijing, China) in a QuantStudio 6 Flex system (Applied Biosystems, Foster City, CA, USA). The RT-qPCR cycling profile consisted of one cycle at 95 °C for 3 min and 72 °C for 10 min, followed by 35 cycles at 94 °C, 60 °C, and 72 °C for 30 s each. Fluorescence signals were detected using the QuantStudio 6 Flex system. The gene-expression data were normalized to the endogenous control GAPDH, and relative gene expression was determined using the ΔΔCt method.
Statistical Analysis
The data analysis was performed at least three times using GraphPad Prism (version 8; GraphPad Software, La Jolla, CA), and all data were presented as mean ± standard deviation. The Shapiro–Wilk test and graphical methods were applied to assess data normality. For multiple pharmacodynamic comparisons against the model condition, normally distributed data were analyzed using the one-way ANOVA test which included the Brown-Forsythe and Bartlett’s tests to evaluate variance homogeneity, followed by the Tukey’s test. P-values less than 0.05 were considered statistically significant. The following nomenclature was used to indicate significance levels in figures: *P < 0.05, **P < 0.01, ***P < 0.001, ****P < 0.0001.
Results
UPLC-Triple-TOF/MS Analysis
Identification of the Main Ingredients of AO
In order to explore the absorption of AO extract and their metabolites in vivo, UPLC-Triple-TOF/MS was used for the qualitative analysis of AO extract to clarify the main triterpenoids of AO.
All known compounds in this study were identified by comparing them to reference standards, conforming to established methodologies. In the case of unknown compounds, their structures were tentatively characterized based on their comprehensive chromatographic and spectrometric data, further supported by cross-referencing relevant literatures.38–40 Following these analytical procedures, a total of seven predominant triterpenoids were detected (as shown in Figure 1 and Table 1) and the corresponding mass spectrogram was additionally presented in Supplementary Figure 1. For these triterpenoids, their quasi-molecular ions were displayed as [M-H]−, [M+H]+ and [M+FA-H]−. Furthermore, an abundance of [M+H-H2O]+ ions were also generated, originating from the phenolic hydroxyl groups present in the core chemical structures of the compounds. These findings have valuable implications for the subsequent exploration of the absorbed AO after oral administration.
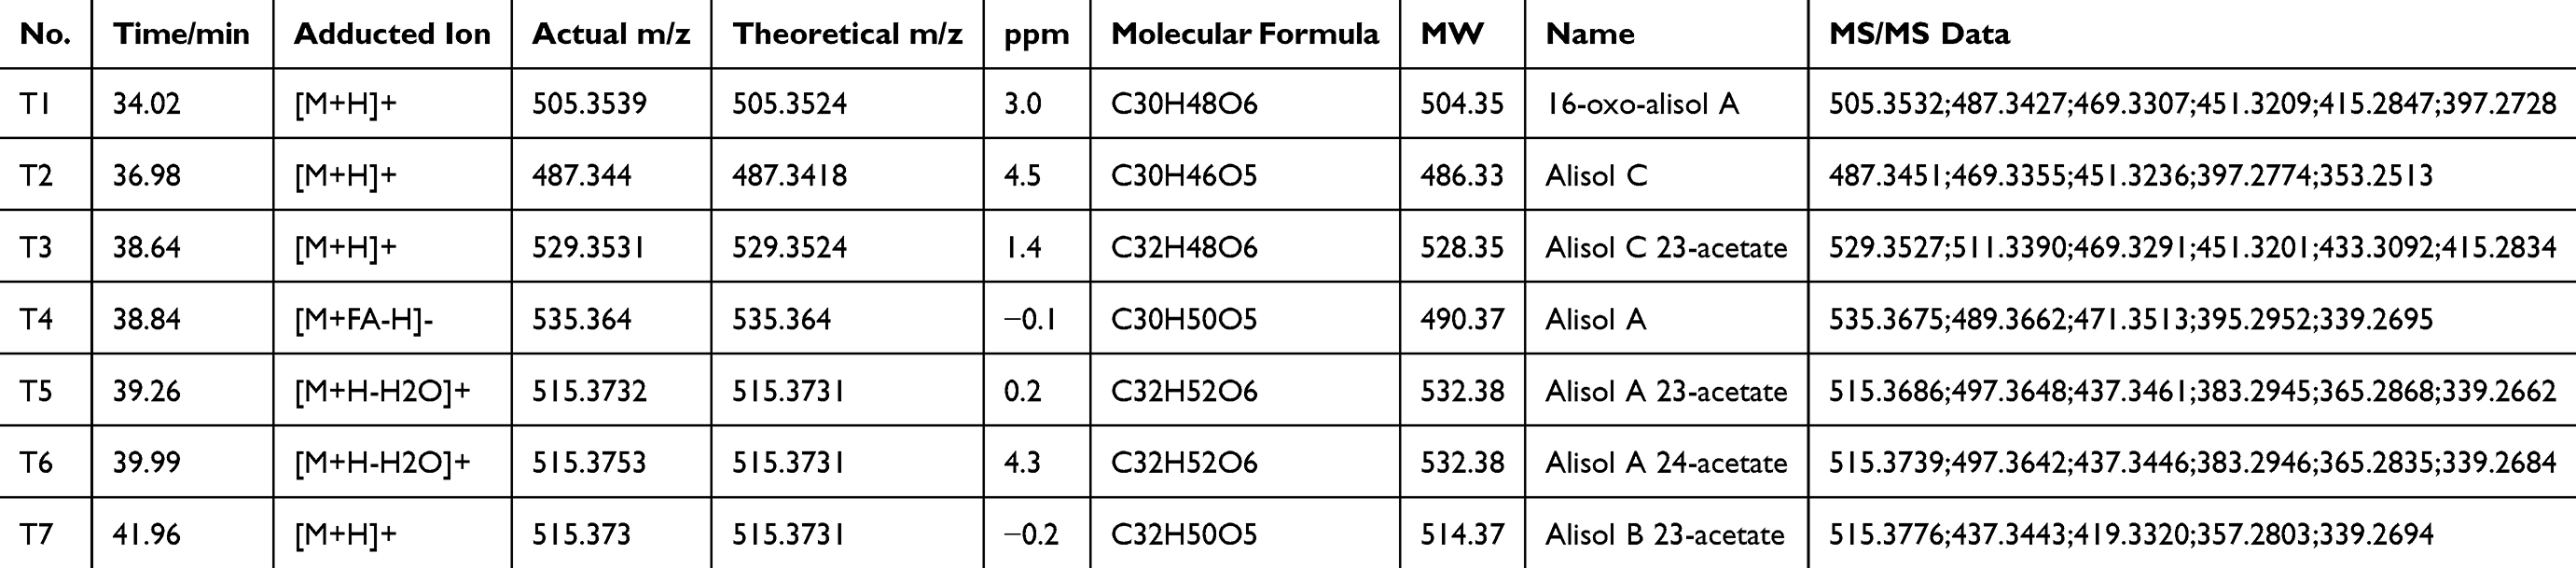 |
Table 1 Identification of the Main Triterpenoids of AO |
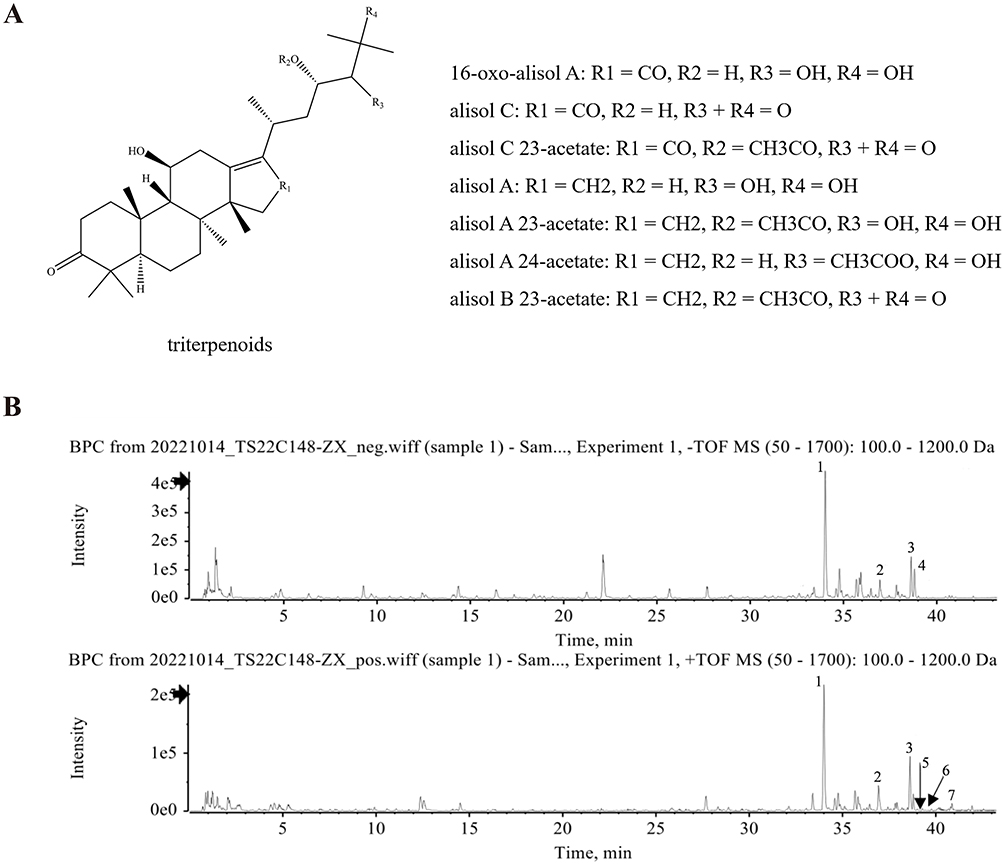 |
Figure 1 Chemical structures (A) and base peak chromatograms (B) of AO extract. |
Identification of the Absorbed Ingredients and Corresponding Metabolites of AO in Ocular Tissue
By comparing the ion chromatograms of the control group and drug-containing group, the influence of the complexity of tissue samples is minimized. This analysis mainly focused on the retention time of chromatographic peaks and the mass spectrometry data obtained by positive and negative ion scanning detection, combined with literature comparison.38–40 A total of 7 components of AO extract were identified in the drug-containing ocular tissue, of which 2 were the prototype components of AO and 5 were the metabolites (Figures 2 and 3). The specific component information is shown in Table 2 and Table 3.
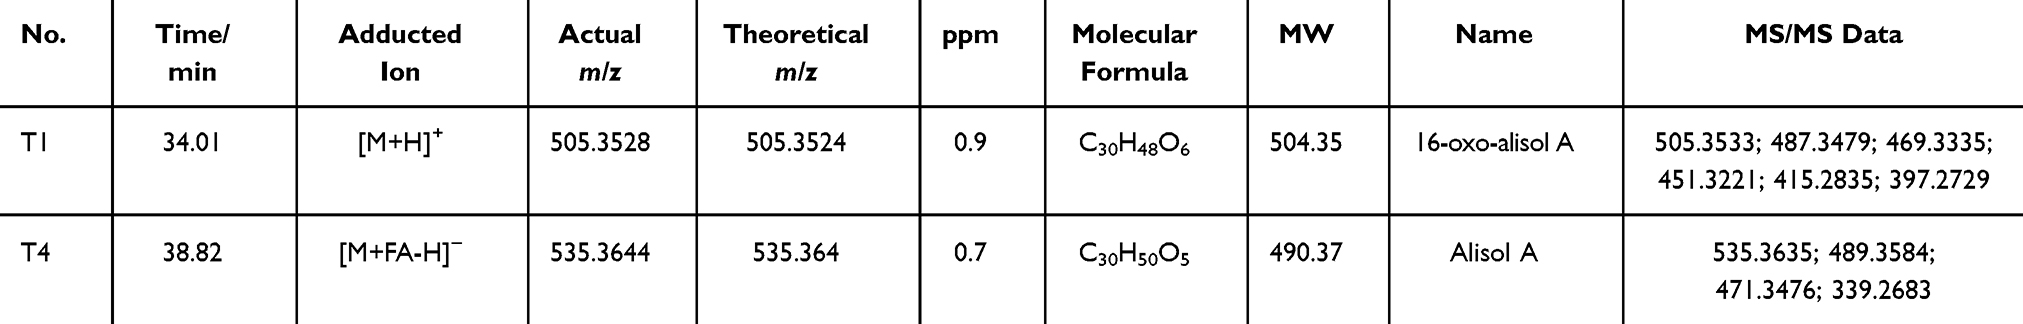 |
Table 2 Identification Results of the Prototype Components of AO-Administered Ocular Tissue Samples |
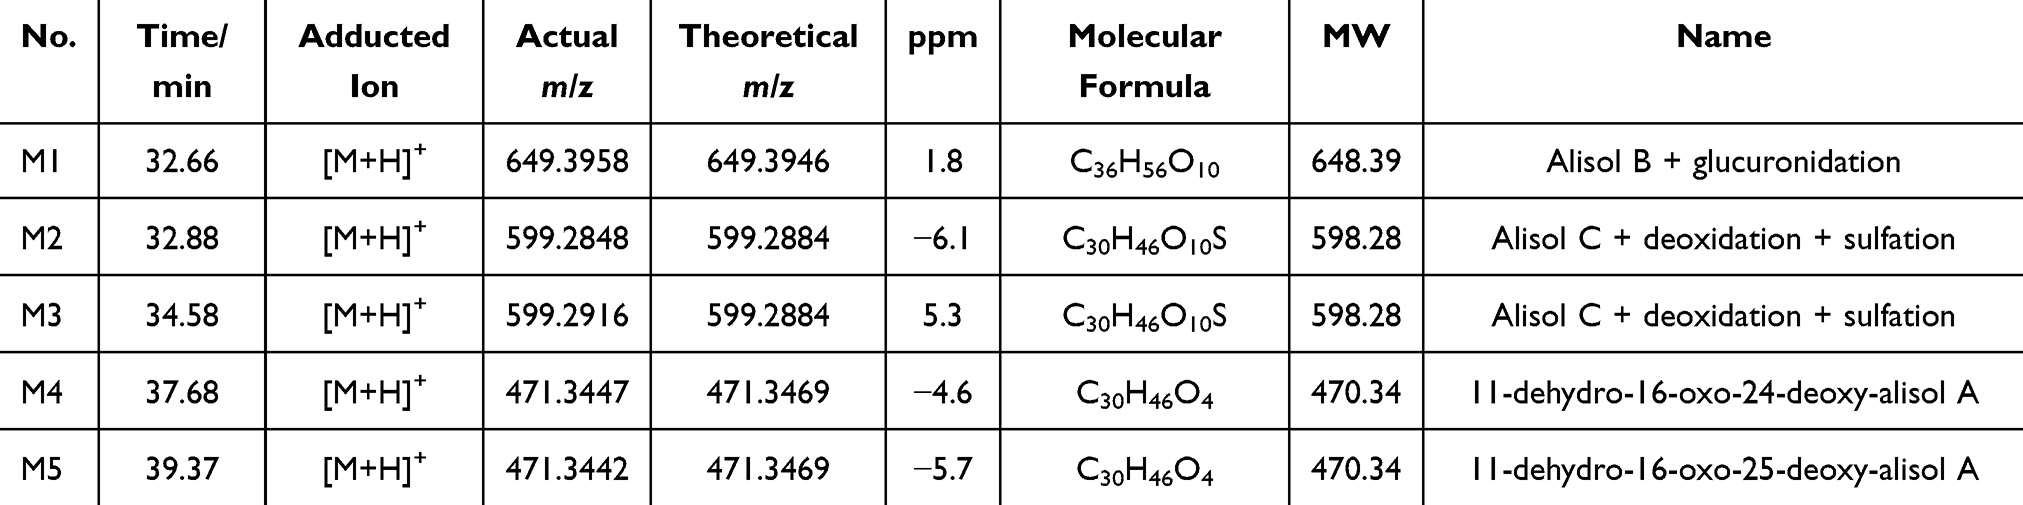 |
Table 3 Identification Results of Metabolites of AO-Administered Ocular Tissue Samples |
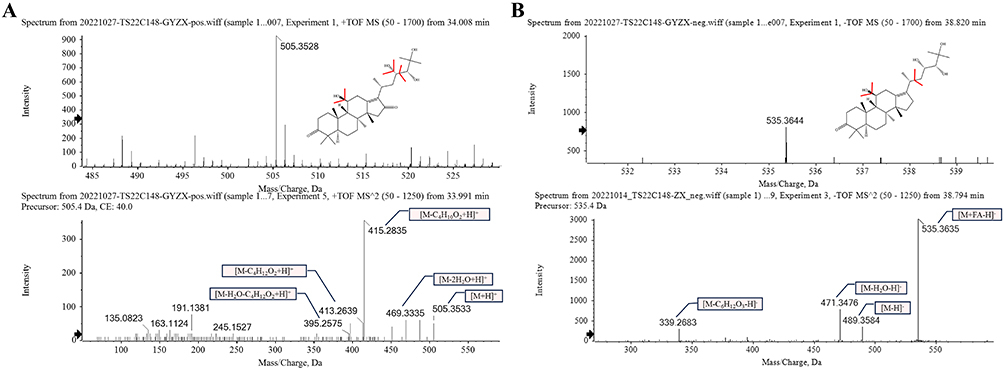 |
Figure 2 Identification of T1 (A) and T4 (B) of AO extract in ocular tissue by UPLC-Triple-TOF/MS, n = 5. |
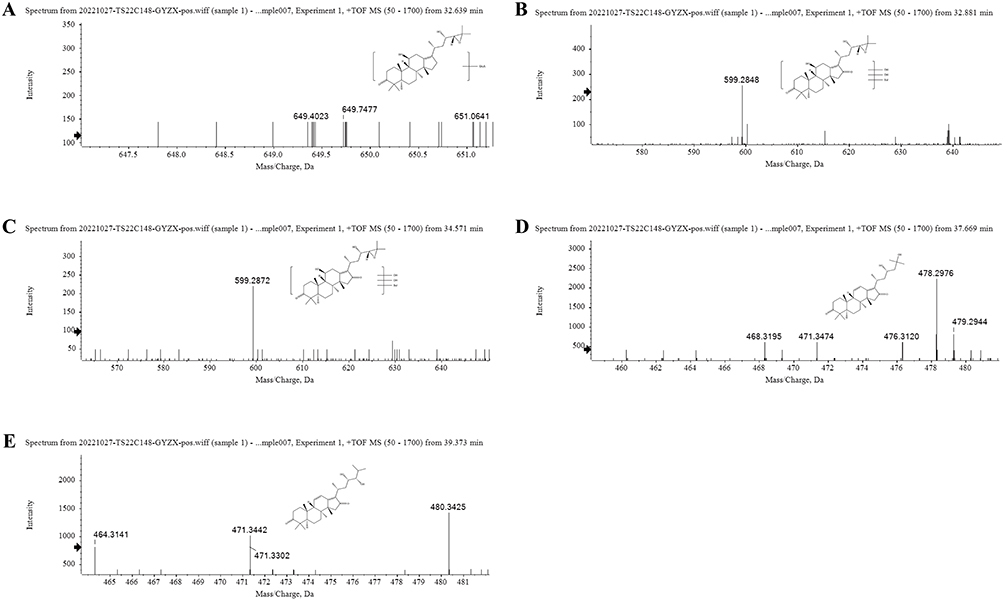 |
Figure 3 Identification of M1 (A), M2 (B), M3 (C), M4 (D), and M5 (E) of AO metabolites in ocular tissue by UPLC-Triple-TOF/MS, n = 5. |
Metabolic Profiling and ADME Prediction
The above studies showed the main triterpenoids of AO extract and the most exposed components after administration of AO extract which are 16-oxoalisol A (T1) and alisol A (T4), and the metabolites are alisol B + glucuronidation (M1), alisol C + deoxidation + sulfation (M2), alisol C + deoxidation + sulfation (M3), 11-dehydro-16-oxo-24-deoxy-alisol A (M4), and 11-dehydro-16-oxo-25-deoxy-alisol A (M5). It was worth noting that certain metabolites of these components possessed a substantial number of isomers. In order to gain further insights into the active sites for metabolic reactions, the predictive tool SMARTCyp was utilized. By employing this method, we were able to infer the most probable structures of these aforementioned components. According to the results of UPLC-Triple-TOF/MS and guided by previous research on metabolites and metabolic profiles of AO,41 as well as relevant knowledge on drug transformation, the plausible transformation process of the active compounds from AO extract and their metabolites in vivo is presented schematically in Figure 4. The epoxy structure of alisol B 23-acetate was unstable under acidic conditions in the gastrointestinal tract. It was easy to open the ring structure and convert into 24-acetate alisol A and further deacetylate into alisol A. In the MS/MS analysis of alisol A, a fragment ion with m/z 471.3513 was observed, whereas m/z values of M4 and M5 were 471.3447 and 471.3442, respectively, reflecting a reduction of 16 Da compared to alisol A. We speculated that M4 and M5 were metabolites of alisol A after a series of oxidation and deoxidation reactions and distinguished them according to liposolubility and retention time. On the other hand, the C-16 of 23-acetate alisol B was easily oxidized to produce α, β-unsaturated ketones, which was converted to 23-acetate alisol C. Upon comparing the MS/MS result of alisol C with 16-oxo-alisol A, it was noted that both exhibit ion fragments at m/z 487, m/z 469, m/z 451, and m/z 415, demonstrating a striking similarity in their dissociation patterns. Accordingly, it was hypothesized that 16-oxo-alisol A represented the transformation product of alisol C. Given the high liposolubility of most of these small molecules, Phase II metabolic reactions, such as glucuronidation and sulfation, could enhance their polarity, thereby facilitating their excretion.
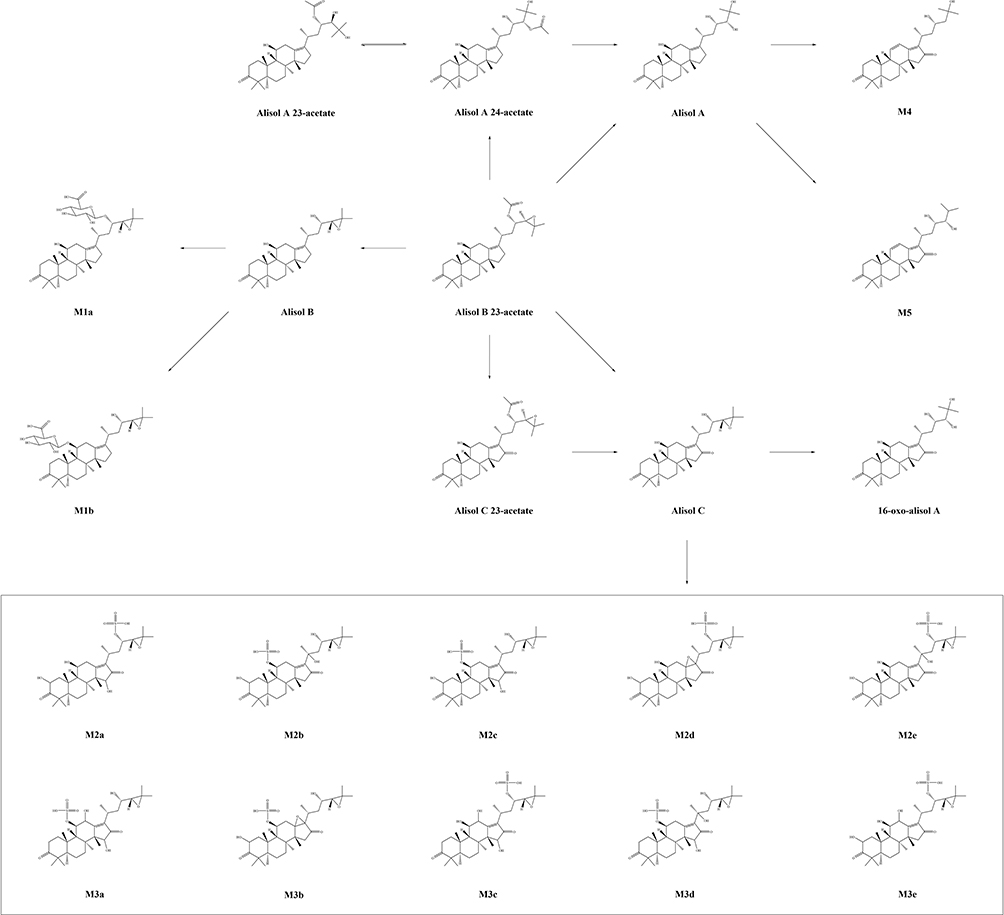 |
Figure 4 Proposed metabolic pathway of AO active components. |
Considering previous studies have shown that BRB destruction played an important role in the development of ME,2 the program SwissADME was employed to assess the permeability of the two primary ingredients as well as the fourteen compounds (Table S1). Among these parameters, molecular weight less than 500, LogP between 2 and 5, and TPSA less than 90 Å2 are main driving forces for a compound to penetrate blood–brain barrier (BBB).42 These compounds could pass through BRB that were structurally like BBB, especially when in the ME state, the barrier would be destroyed and the permeability would increase.43
Network Pharmacology Analysis
Potential Targets of Eye-Entering Components of AO Extract and ME
The SMILES and SDF structures of 16-oxoalisol A, alisol A, 11-anhydro-16-oxo-24-deoxy-alisol A, and 11-anhydro-16-oxo-25-deoxy-alisol A were obtained in PubChem and the most plausible isomer structures were generated. All these components were subsequently imported into the SwissTargetPrediction database to ascertain their targets. After the process of deduplication and normalization, a total of 453 predicted targets were obtained. A comprehensive search was conducted across several databases, including OMIM, GeneCards, DRUGBANK, and DisGeNET, to identify potential targets for ME. A total of 415 targets were obtained after integration and deduplication. In addition, 453 targets were extracted for the 16 active components (including isomers) of AO. The overlap of these two sets of targets was visualized using Venn, yielding 27 common targets between ME and AO (Figure 5A, Table S2).
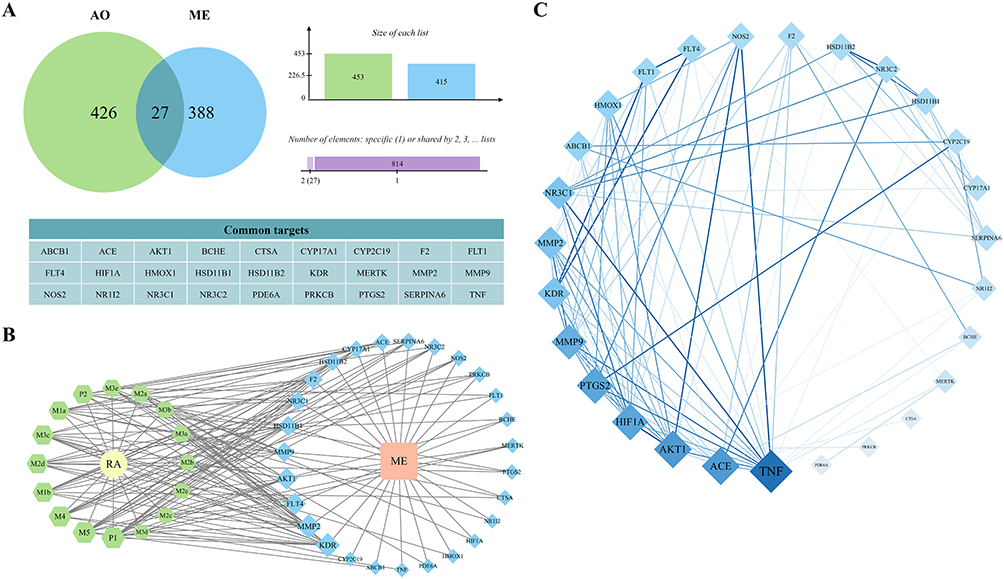 |
Figure 5 Potential targets of AO against ME. (A) The common targets from the intersection of the related targets of AO and ME. (B) The C-T-D network diagram was constructed by 16 active compounds, 27 common targets and the disease. (C) A PPI network diagram was generated, encompassing 27 nodes and 101 edges. |
Construction of the C-T-D Network
To further investigate the potential mechanism of action of AO in treating ME, a C-T-D network was constructed using Cytoscape 3.9.1 software. The network included drugs, diseases, active compounds, and the 27 common targets identified in the previous step (Figure 5B, Table S3). Within this network, nodes were sorted according to the degree value and those with a larger size and more connections were identified as more important.44 The network calculation results (Table S4) reminded us to pay more attention to T1, M5 and M4 in compounds and KDR, MMP2, and AKT1 in targets.
Construction of PPI Network and Identification of Core Targets
The 27 common targets identified earlier were input into the STRING database to construct a PPI network for further analysis. The resulting PPI network (Figure 5C, Table S5) contained 27 nodes and 101 edges, with an average node degree of 7.48. Employing Cytoscape 3.9.1, the PPI network was subjected to topological analysis, which involved determining the degree, betweenness centrality (BC), closeness centrality (CC), and topological coefficient (TC) of each node. From this analysis, six nodes (Table 4) showcasing a degree value exceeding 10 (twice the median) were identified as core targets, including TNF, ACE, AKT1, PTGS2, HIF1A, and MMP9.45
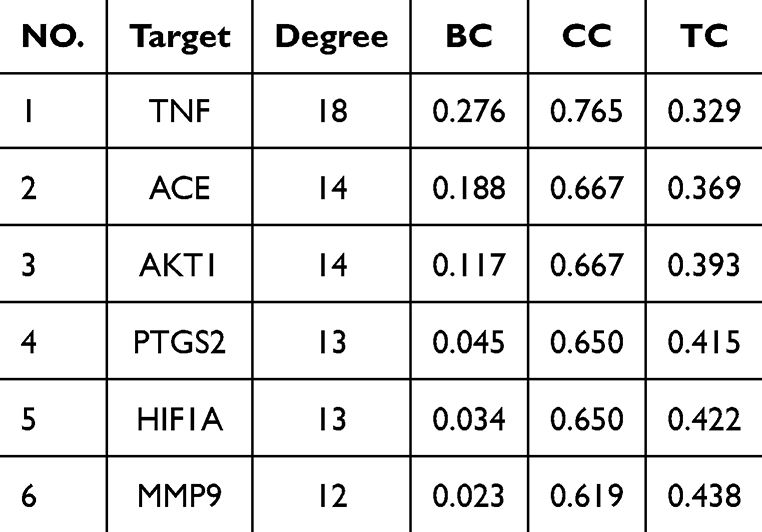 |
Table 4 Parameters for Topological Analysis of Core Targets from PPI |
GO and KEGG Enrichment Analysis
Enrichment analysis was performed using the Metascape database on a set of 27 common targets. The analysis revealed significant enrichments in multiple pathways across various functional categories. Specifically, the GO analysis identified 387 enriched pathways in biological process, 34 pathways in molecular function, and 8 pathways in cell component (Table S6). The -Log10 (P-value) and gene count were used to rank the clustered results, and the top 8 pathways from each category were visualized using a bubble chart (Figure 6A). The significantly enriched biological processes encompassed the response to external stimuli, response to hypoxia, and vascular morphogenesis. The molecular functions showed strong associations with VEGF receptor activity, heme binding, and oxidoreductase activity. Moreover, the cellular components primarily involved the membrane side, the outside of the plasma membrane, and receptor complexes. ME was commonly caused by hypoxic-ischemic diseases, inflammation, or trauma. Previous studies had indicated that AO exhibited anti-inflammatory effects.46 Therefore, based on the predictions from the GO analysis, it was speculated that AO might exert therapeutic effects on ME by modulating these biological processes, molecular functions, and cellular components.
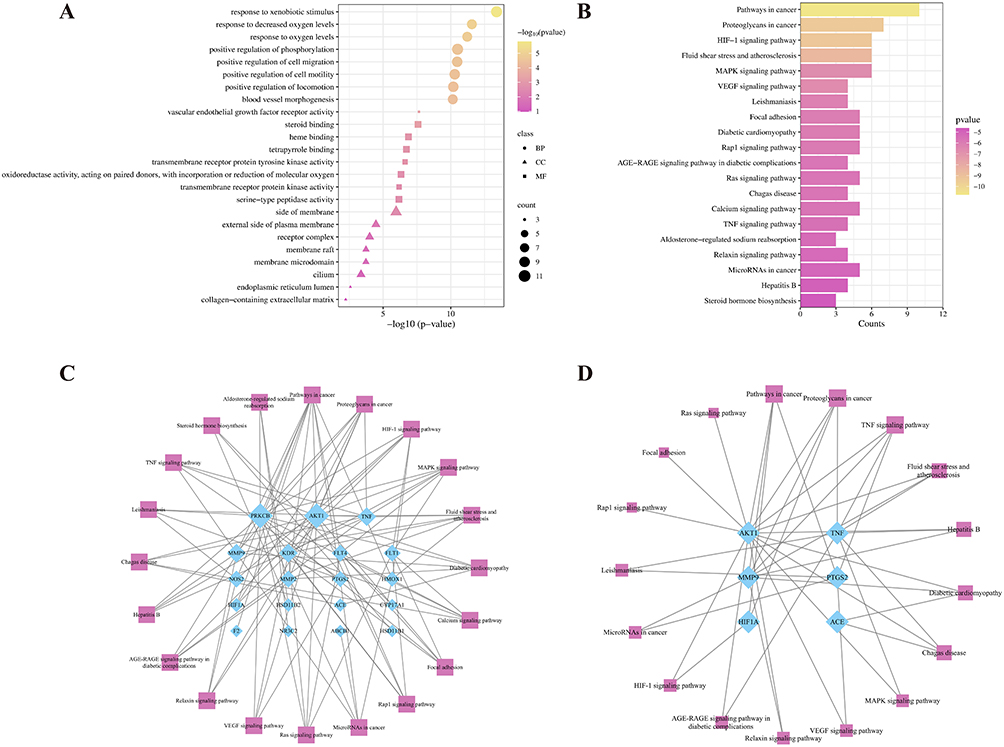 |
Figure 6 (A) GO enrichment analysis of AO for ME, including the 8 items for biological engineering, molecular function, and cellular components. (B) The first 20 pathways from KEGG enrichment analysis of AO for ME. (C) Pathway-related target network (constructed from the first 20 pathways and 19 related targets). (D) Core target-related pathway network (construction of the first 6 core targets and 17 related pathways). |
A total of 50 pathways were identified in the KEGG analysis (Table S7). The results were then sorted based on -Log10 (P-value) and gene count, resulting in the top 20 pathways being displayed in a bar graph (Figure 6B). The analysis revealed that the treatment of ME by AO involves several signaling pathways, namely, the HIF-1 signaling pathway, MAPK signaling pathway, VEGF signaling pathway, and AGE-RAGE signaling pathway in diabetic complications. To visualize the relationship between the identified 27 common targets and the 20 related pathways, a network diagram was constructed (Figure 6C, Table S8). The top 20 pathways involved 19 targets, and all pathways and targets were sorted according to the degree value. PRKCB, AKT1, TNF in the target and HIF-1 signaling pathway, MAPK signaling pathway in the pathway are more prominent. In addition, six core targets, namely AKT1, TNF, MMP9, PTGS2, HIF-1α, and ACE, were screened out in the PPI analysis. These targets and the 17 pathways associated with them were depicted in the network diagram (Figure 6D, Table S9). It was not difficult to find that TNF and its regulated signaling pathways have great potential in AO treatment of ME. Among them, the MAPK signaling pathway was closely related to TNF and AKT1, and TNF-mediated activation of PI3K/Akt, MAPK and NF-κB signaling pathways is also well known.47 As TCM exhibited the unique characteristic of “multi-component-multi-target-multi-pathway” effects, the findings from this study prompted us to explore the MAPK signaling pathway, PI3K-AKT signaling pathway, as well as other pathways and key targets involved in complex crosstalk with TNF as the center.
TNF-α was a classic, pleiotropic inflammatory mediator that involved a variety of biological processes and its biological effects were mediated by binding to two different receptors, TNFR1 and TNFR2, whose extracellular ligand-binding domains had cysteine-rich subdomains unique to members of the TNFR superfamily, but the intracellular domain had no sequence homology or inherent enzyme activity, so they interacted with cytoplasmic proteins to trigger different signaling pathways.47 With an expansive set of members, the MAPK family actively participated in diverse biological processes, including but not limited to cell proliferation, differentiation, and inflammatory stress.48 MAPK played a role in both upstream and downstream of TNF-α, which MAPK activated by TNF-α could increase the expression of TNF-α.49 Previous investigations had revealed that infliximab exerted its effects on the p38/MAPK pathway through antagonism of TNF receptors, thereby impeding BRB damage in diabetic rats and ameliorating ME.50 Moreover, the PI3K-AKT signaling pathway, known as an intracellular mediator of signal transduction, orchestrates metabolism, proliferation, cell survival, growth, and angiogenesis, particularly in response to insulin stimulation, offered promising research prospects in disorders linked to insulin resistance.51 Hernandez’s laboratory was dedicated to studying the molecular mechanism of insulin resistance in brown adipocytes and found that activation of p42/p44 and p38MAPKs by TNF-α impaired insulin stimulation of IRS-2 associated PI3K, leading to insulin resistance in brown adipocytes.52 Investigations had indicated that erythropoietin, through the PI3K/Akt signaling pathways, could defend against retinal pigment epithelial damage and reduce cell permeability elicited by high glucose plus IL-1β stimuli, thus holding potential implications for the management of DME.53 Besides, Lin et al demonstrated that exogenous H2S conferred protection to endothelial cells against high glucose-induced injury by activating the PI3K/Akt/eNOS pathway, thereby underscoring the significance of PI3K/Akt/eNOS signaling impairment as a key pathophysiological mechanism in hyperglycemia-induced vascular injury.54 Furthermore, studies had demonstrated that pituitary adenylate cyclase-activating polypeptide and vasoactive intestinal peptide could restore peripheral BRB integrity disrupted by exposure of cells to hyperglycemia/hypoxia, presumably mediated through the PI3K/Akt and MAPK/ERK signaling pathways.55
Collectively, these targets and signaling pathways intertwined and interconnected with each other, crafting an intricate network.56 Recognizing the significant characteristics of TCM, our focus was directed toward delineating the role of crosstalk among these pathways in the management of ME, with subsequent experiments planned to validate its effectiveness.
Molecular Docking Analysis
Based on the findings from the network pharmacology analysis of AO in ME treatment, TNF-α was selected as a primary target and proceeded to investigate its interaction with M4, a metabolite of Alisol A. Molecular docking was employed to predict the binding affinities and binding modes between M4 and TNF-α.
The results of our molecular docking analysis revealed a strong binding affinity between M4 and TNF-α, with an average estimated binding free energy of −8.5258 kcal/mol. Notably, the lowest estimated binding free energy was −9.46 kcal/mol. To further elucidate the binding mode, we superimposed the lowest-energy pose of M4 onto TNF-α and visualized the alignment (Figure 7A). Overall, M4 interacted with TNF-α via strong hydrogen bonds and hydrophobic interactions. Specifically, the hydrogen bonds were mediated by Ser60, Gly121, and Tyr151, and hydrophobic interactions were observed more widely (Figure 7A). These findings from molecular docking suggested that M4 exhibited a high binding affinity to TNF-α, potentially showing biological activity at the physiological level. To validate the stability of the binding mode between M4 and TNF-α, molecular dynamics simulation was subsequently conducted.
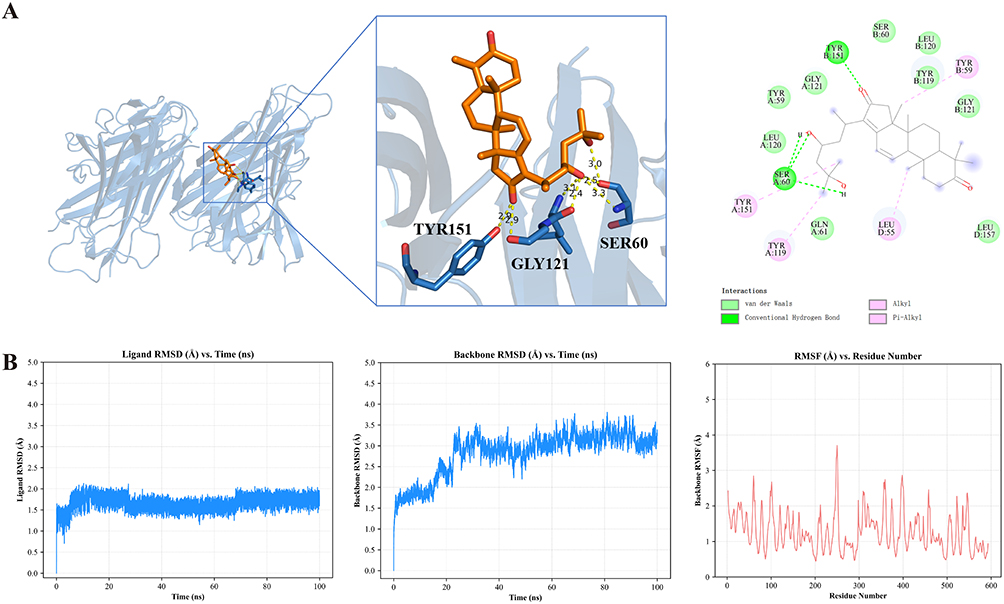 |
Figure 7 (A) Visualization of predicted binding mode of M4 and TNF-α. (B) RMSD and RMSF analysis of complex of M4 with TNF-α in MD simulation. |
Molecular Dynamics Simulation
To gain dynamic insights of the binding between TNF-α and M4, a 100 ns molecular dynamics simulation was carried out. The initial structure for the simulation was selected based on the top docking result obtained from the AutoDock 4. The simulation results were then analyzed using RMSD and RMSF to assess the stability of both the ligand and protein. Overall, our analysis revealed that both the ligand and protein exhibited remarkable stability throughout the simulation (Figure 7B). After 20 ns, the system reached a relatively stable state, with the ligand RMSD remaining below 2.0 Å and the protein backbone RMSD fluctuating around 3.0 Å. Additionally, the RMSF calculations indicated that the protein-ligand complex remained relatively stable, as the RMSF values of nearly all residues were below 3.0 Å. These findings collectively supported the reliability of the predicted binding mode of M4 with TNF-α as determined by AutoDock 4.
In vivo Experimental Validation
Effects of Alisol A on Neovascularization
Zebrafish have emerged as a valuable model organism for studying eye diseases due to the various advantages it possesses.57,58 Firstly, zebrafish exhibited a visual response as early as 72 hours after fertilization, during which time the morphology and function of the retina closely resembled those of the adult retina. Secondly, zebrafish had a high abundance of cones, similar to the human macula. This similarity enabled researchers to investigate macular disorders in zebrafish, such as ME, which was of great clinical significance. Furthermore, the transparency of zebrafish embryos facilitated fluorescence imaging, making it easier to observe the progression of diseases in real-time. Considering these advantages, we induced DR in zebrafish to establish an ME model and conducted confocal experiments to investigate the effects of certain drugs. Comparing the results of the control group and the model group (Figure 8A), the model group exhibited a significant increase in fundus blood vessel branches, a prominent feature of DR. Prednisolone, as a glucocorticoid drug, could reduce tissue edema and fiber deposition during inflammatory response and inhibit telangiectasia and hyperplasia. It was often used clinically as a combined drug for the treatment of ME.59 Therefore, prednisolone was used in the positive control group, and the confocal results showed that prednisolone significantly inhibited the formation of retinal vascular branches. Analyzing the data from the different groups, we found that both the A-M and A-H groups significantly suppressed fundus angiogenesis.
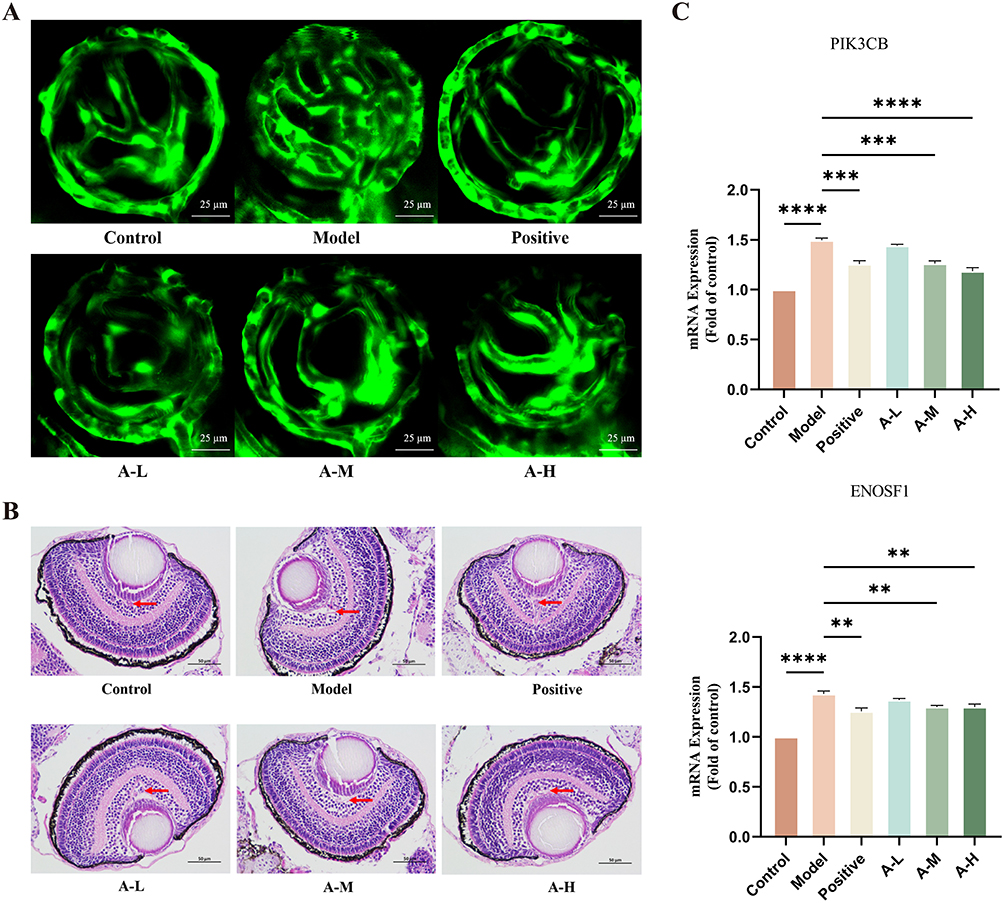 |
Figure 8 (A) LCSM results of zebrafish fundus. (B) HE staining results of zebrafish eyes (400×). (C) The mRNA expression of proteins related to PI3K-AKT and MAPK signaling pathway in ME zebrafish tissues (n = 5, **P < 0.01, ***P < 0.001, ****P < 0.0001). |
Effects of Alisol A on Edema
ME was generally formed by fluid exudation from retinal neovascularization and accumulation in the center of the retina. Histological analysis is illustrated in Figure 8B and indicated that the intercellular space between cone photoreceptor cells within zebrafish eyes in the model group increased significantly when compared to the control group, suggesting the formation of edema.60 By contrast, compared with the model groups, the A-H group had the best effect on eliminating edema, and its effect on eliminating edema was dose-dependent. The experimental findings indicated that Alisol A exhibited significant efficacy in eliminating or reducing fundus retinal edema. The experiment showed that Alisol A exerted promising potential in treating ME.
Regulation in mRNA Level of Alisol A on ME
Combining the findings from network pharmacology analysis and zebrafish protein information, we identified two protein targets, namely PIK3CB and ENOSF1. Each protein target was subjected to PCR detection using zebrafish samples. These proteins were crucial targets within the PI3K/Akt pathway and served as key hubs within the studied pathway net. Specifically, PI3K facilitated the synthesis of phosphatidylinositol-3,4,5-triphosphate (PIP3) on the cell membrane, thereby activating Akt through PIP3. Subsequently, Akt phosphorylated and deactivated RAF within the MAPK signaling pathway. MEK, on the other hand, hindered PI3K signaling by enhancing the membrane localization of phosphatase and tensin homolog (PTEN).61 In addition to their collaborative role in promoting GLUT4 expression for facilitating glucose uptake and utilization in peripheral tissues, these pathways also jointly governed eNOS-mediated angiogenesis.62
The PCR experimental data collected from the control group, the model group, and the positive control group revealed expression patterns of PIK3CB and ENOSF1 mRNA. It was obvious that the model group displayed an upward trend in the expression of PIK3CB and ENOSF1 mRNA expression. Conversely, the positive drug group showed a downward trend in the expression of PIK3CB and ENOSF1 mRNA expression (Figure 8C). Numerous studies have demonstrated the protective role of inhibiting the PI3K/Akt signaling pathway and MAPK signaling pathway in retinopathy. For instance, some researchers have found that arctigenin exhibited anti-inflammatory effects by inhibiting the TNF-α-mediated NF-κB/p38MAPK pathway, thus preventing endothelial cell junction destruction and preserving BRB function.63 Additionally, some scholars have discovered that the inhibition of PI3K/Akt and MEK/ERK signaling pathways using MEK and PI3K inhibitors could reduce the formation of tubular structures induced by VEGF.64 Furthermore, mTOR inhibitors acting on targets downstream of the PI3K/Akt signaling pathway had been shown to suppress several growth factors crucial for pathological angiogenesis induction. In clinical trials targeting ocular conditions, a lead mTOR inhibitor demonstrated favorable safety profiles and sustained ocular pharmacokinetics following a single dose, making it an attractive candidate for DR treatment.65 Based on the evidence, it could be concluded that the positive expression of AO in the treatment of ME was attributed to its inhibition of the PI3K/Akt signaling pathway and MAPK signaling pathway.
The PCR experiment data from the research drug group revealed that alisol A exerted inhibitory effects on the expression of PIK3CB and ENOSF1. Notably, compared to the positive drugs, the A-H group exhibited more potent inhibition on the expression of PIK3CB. Therefore, based on the analysis, it could be inferred that alisol A possessed the ability to inhibit the PI3K/Akt/eNOS pathway, and higher concentration of alisol A exhibited superior inhibitory effects. The conducted experiments provided compelling evidence on the inhibitory effects of Alisol A on the proliferation of vascular endothelial cells.
Discussion
According to the basic theory of TCM, AO had the effect of promoting water and dampness, reducing turbidity and lipids, and was the main medicinal material in many traditional Chinese medicine prescriptions for the treatment of ME. It was inferred that it had the effect of treating ME but lacked a theoretical basis. This study aimed to investigate the potential of AO in the treatment of ME by employing an integrative approach to identify its targets and mechanism.
A UPLC-Triple-TOF/MS experiment was conducted to analyze the main components of AO extract and the ocular tissues of zebrafish administered with AO extract, resulting in the identification of two primary drug components, alisol A and 16-oxo-alisol A, along with five metabolites. Based on this analysis, the findings from swissADME provided additional support that M4 possessed the permeability through BRB, thereby exerting their therapeutic effects within the eye. To unravel the mechanism of action, a network pharmacology analysis was performed on the constituents of AO, leading to the identification of key targets TNF, as well as vital signaling pathways including MAPK and PI3K/Akt. Subsequent molecular docking analysis and molecular dynamics simulation were conducted to evaluate the binding affinity between the active ingredients of AO and the identified target proteins, revealing a satisfactory interaction. We speculated the mechanism of action might be that alisol A was absorbed into ocular tissue and transformed into M4, then the M4 inhibited the edema by regulating the expression of PIK3CB, and ENOSF1 through binding with TNF-α (Figure 9).
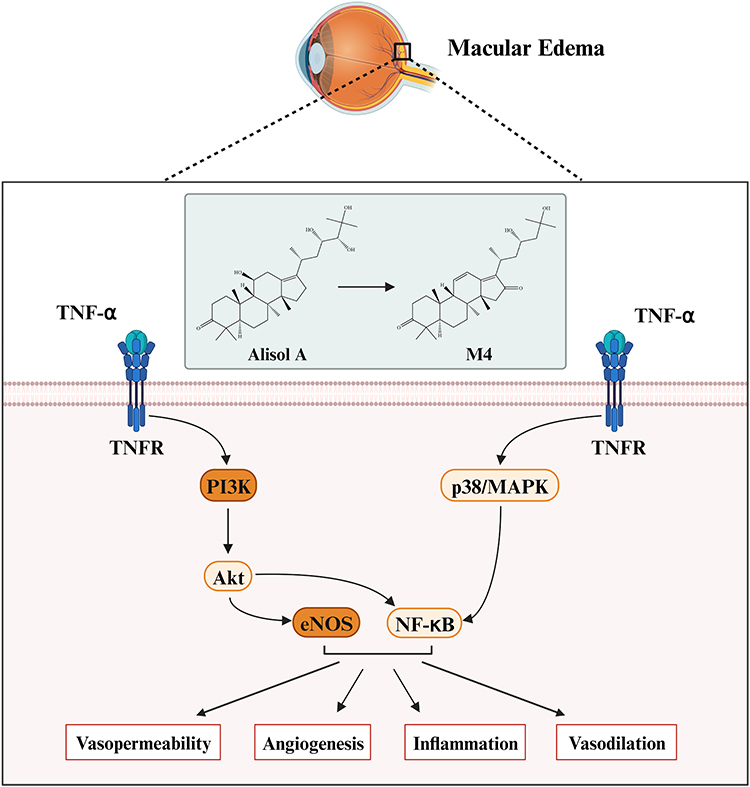 |
Figure 9 Overview of the target-pathway effects of AO active ingredients against ME. |
Confocal experiments revealed that alisol A in medium and high doses demonstrated a more pronounced inhibitory effect on fundus angiogenesis. Retinal neovascularization inherently possessed abnormal structure and functionality, resulting in increased vasopermeability, leading to the occurrence of lesions such as exudation and hemorrhage, as well as ME. In addition, the formation of retinal neovascularization disrupts the BRB, which is crucial in maintaining retinal stability and regulating the flow of fluids and molecules into and out of the retina. The impairment of the BRB was closely associated with the development of ME. HE staining results indicated that medium and high concentrations of alisol A were effective in the elimination or reduction of retinal edema. Although the zebrafish eye structure resembled that of the human eye, with components such as the lens, retinal ganglion cell layer, inner plexiform layer, inner nuclear layer, outer plexiform layer, and outer nuclear layer, there was no macular area in the zebrafish model due to its unique characteristics. Therefore, the experimental results cannot be directly interpreted. Nonetheless, as the pathological mechanism of ME was similar to that of fundus retinal edema, and since a significant portion of the edema in the zebrafish model corresponds to the macular area of the human eye, it could be inferred that alisol A exhibited favorable effects of reducing edema in the treatment. Results in the PCR experiment demonstrated that alisol A exhibited inhibitory effects on the expression of targets associated with the PI3K/Akt/eNOS signaling pathway. Furthermore, a high concentration of alisol A showed a significantly superior inhibitory effect. These findings were consistent with previous literature and experimental results, which indicated that the expression of PI3K/Akt/eNOS signaling pathway-related targets was markedly elevated in the model group, while the expression was diminished in the positive drug group. Based on these observations, it could be inferred that the inhibition of the PI3K/Akt/eNOS signaling pathway could effectively suppress the development of ME. Meanwhile, PI3K/Akt/eNOS signaling pathway affected MAPK signaling pathway and NF-κB signaling pathway, mediating vasopermeability, neovascularization, inflammatory response, and other processes.
All in all, the active ingredients found in AO had demonstrated promising inhibitory effects on fundus angiogenesis, as well as a significant therapeutic impact on retinal detumescence. Notably, alisol A had been identified as a key component that mediated robust anti-inflammatory responses, impeded retinal neovascularization, reduced vascular permeability, and modulated crucial cellular processes such as proliferation, apoptosis, and signaling. These effects were achieved through molecular interactions with important targets including TNF-α, as well as pivotal signaling pathways like PI3K/Akt/eNOS and MAPK. The multifaceted mechanisms of action exhibited by AO enabled the treatment of ME with remarkable efficacy.
Conclusion
In summary, the active triterpenoids of AO extract, alisol A and 11-dehydro-16-oxo-24-deoxy-alisol A, effectively controlled a series of pathophysiological processes of ME by acting on the closely intersecting PI3K/Akt/eNOS signaling pathway and MAPK signaling pathway in the complex communication network with TNF-α centered. These findings provided a certain theoretical and scientific basis for the clinical application of AO in the treatment of ME. However, there were some shortcomings and further research on the basis of this experiment was needed to verify our findings in the future.
Abbreviations
ADME, absorption, distribution, metabolism, and excretion; AO, Alisma orientale; BBB, blood–brain barrier; BC, betweenness centrality; BRB, blood-retinal barrier; CC, closeness centrality; CTD, compound-target-disease; DME, diabetic macular edema; DPF, day post fertilization; DR, diabetic retinopathy; GO, Gene Ontology; KEGG, Kyoto Encyclopedia of Genes and Genomes; ME, macular edema; PIP3, phosphatidylinositol-3,4,5-triphosphate; PPI, protein–protein interaction; PTEN, phosphatase and tensin homolog; PTU, propylthiouracil; RMSD, root-mean-square deviation; RMSF, root-mean-square fluctuation; RT-qPCR, real-time quantitative polymerase chain reaction; TC, topological coefficient; TCM, traditional Chinese medicine; TNF-α, tumor necrosis factor-α; TPSA, topological polar surface area; UPLC-Triple-TOF/MS, ultra-performance liquid chromatography coupled with triple quadrupole time-of-flight mass spectrometry; VEGF, vascular endothelial growth factor.
Acknowledgments
We sincerely appreciate the efforts of all authors who contributed to this study.
Funding
This work is supported by the Shanghai Scientific and Technological Committee (22S21902000, Z.H. Wu); Shanghai Municipal Health Commission (202140501, K.B. Cheng); Special fund for clinical research of Wu Jieping Medical Foundation (320.6750.2021-2-75, Z.H. Wu); Shanghai Songjiang District Science and technology research project (2020SJ277, Z.H. Wu).
Disclosure
The authors declare that they have no known competing financial interests or personal relationships that could have appeared to influence the work reported in this paper.
References
1. Makri OE, Georgalas I, Georgakopoulos CD. Drug-induced macular edema. Drugs. 2013;73:789–802. doi:10.1007/s40265-013-0055-x
2. Scholl S, Kirchhof J, Augustin AJ. Pathophysiology of macular edema. Ophthalmologica. 2010;224(1):8–15. doi:10.1159/000315155
3. Zelová H, Hošek J. TNF-α signalling and inflammation: interactions between old acquaintances. Inflam Res. 2013;62:641–651. doi:10.1007/s00011-013-0633-0
4. Kocabora MS, Telli ME, Fazil K, et al. Serum and aqueous concentrations of inflammatory markers in diabetic macular edema. Ocul Immunol Inflamm. 2016;24(5):549–554. doi:10.3109/09273948.2015.1034804
5. Capitão M, Soares R. Angiogenesis and inflammation crosstalk in diabetic retinopathy. J Cell Biochem. 2016;117(11):2443–2453. doi:10.1002/jcb.25575
6. Rangasamy S, McGuire PG, Das A. Diabetic retinopathy and inflammation: novel therapeutic targets. Middle East Afr J Ophthalmol. 2012;19(1):52–59. doi:10.4103/0974-9233.92116
7. Luo XS, Wu NL. Thought of syndrome differentiation and treatment method on macular edema. Chin J Ophthalmol. 2013;23:49–51. doi:10.13444/j.cnki.zgzyykzz.003086
8. Hu YC, Jie CH, Wu ZZ, Cai WJ, Wang JW. Administrative features of Chinese medicinals in treatment of diabetic macular edema. J Beijing Univ Tradit Chin Med. 2018;41:434–440. doi:10.3969/j.issn.1006-2157.2018.05.014
9. Liang JH, Chen YB, Zhai N, Zhang Y, Zeng DX, Hu S. Medication rule of macular edema treated by traditional Chinese medicine. Guangxi Med J. 2019;41(12):1514–1517. doi:10.11675/j.issn.0253-4304.2019.12.11
10. Yan X, Kang ZF, Guan RJ, Li L. Study on the rule of Traditional Chinese Medicine in treating age-related macular degeneration based on data mining. J Tradit Chin Ophthalmol. 2023;33(01):19–24. doi:10.13444/j.cnki.zgzyykzz.2023.01.004
11. Liu SS, Guo J, Li Z, et al. Advances in studies on chemical compositions of Alismatis Rhizoma and their biological activities. Chin J Chin Mater Med. 2020;45(7):1578–1595. doi:10.19540/j.cnki.cjcmm.20190616.201
12. Zhang LL, Xu W, Xu YL, Chen XP, Huang MQ, Lu JJ. Therapeutic potential of Rhizoma Alismatis: a review on ethnomedicinal application, phytochemistry, pharmacology, and toxicology. Ann N Y Acad Sci. 2017;1401(1):90–101. doi:10.1111/nyas.13381
13. Bailly C. Pharmacological properties and molecular targets of alisol triterpenoids from Alismatis rhizoma. Biomedicines. 2022;10(8):1945. doi:10.3390/biomedicines10081945
14. Xu W, Li XY, Lin N, et al. Pharmacokinetics and tissue distribution of five major triterpenoids after oral administration of Rhizoma Alismatis extract to rats using ultra high-performance liquid chromatography–tandem mass spectrometry. J Pharm Biomed Anal. 2017;146:314–323. doi:10.1016/j.jpba.2017.09.009
15. Zeng L, Tang WJ, Yin JJ, et al. Alisol A 24-acetate prevents hepatic steatosis and metabolic disorders in HepG2 cells. Cell Physiol Biochem. 2016;40(3–4):453–464. doi:10.1159/000452560
16. Zhang X, Li XY, Lin N, et al. Diuretic activity of compatible triterpene components of Alismatis rhizoma. Molecules. 2017;22(9):1459. doi:10.3390/molecules22091459
17. Jia XK, Huang JF, Huang XQ, et al. Alismatis rhizoma triterpenes alleviate high-fat diet-induced insulin resistance in skeletal muscle of mice. J Evid Based Complem Altern Med. 2021;2021. doi:10.1155/2021/8857687
18. Han WW, Xing WJ, Wang KC, Wang BJ, Bai KY. Alisol A attenuates malignant phenotypes of colorectal cancer cells by inactivating PI3K/Akt signaling. Oncol Lett. 2022;24(2):1–10. doi:10.3892/ol.2022.13369
19. Jang EY, Lee JH. Promising Anticancer Activities of Alismatis rhizome and its triterpenes via p38 and PI3K/Akt/mTOR Signaling Pathways. Nutrients. 2021;13(7):2455. doi:10.3390/nu13072455
20. Lu TT, Li HH, Zhou YJ, et al. Neuroprotective effects of alisol A 24-acetate on cerebral ischaemia–reperfusion injury are mediated by regulating the PI3K/AKT pathway. J Neuroinflammation. 2022;19(1):1–15. doi:10.1186/s12974-022-02392-3
21. Yu T, Zhang YX, Liu XJ, et al. Investigation of the pharmacological effect and mechanism of mountain-cultivated ginseng and garden ginseng in cardiovascular diseases based on network pharmacology and zebrafish experiments. Front Pharmacol. 2022;13:920979. doi:10.3389/fphar.2022.920979
22. Jia Z, Zhao CJ, Wang MS, et al. Hepatotoxicity assessment of Rhizoma Paridis in adult zebrafish through proteomes and metabolome. Biomed Pharm. 2020;121:109558. doi:10.1016/j.biopha.2019.109558
23. Han Q, Zou DX, Li EW, et al. Exploration on Similar Evaluation and Mechanism of Hepatotoxicity of Water Extract from Genkwa Flos in Adult Zebrafish and SD Rats. World Chin Med. 2020;15(13):1872–1878. doi:10.3969/j.issn.1673-7202.2020.13.005
24. Yue LN, Xiang P, Shen B, Xu DQ, Song FY, Yan H. Metabolism of 4F‐MDMB‐BICA in zebrafish by liquid chromatography–high resolution mass spectrometry. Drug Test Anal. 2021;13(6):1223–1229. doi:10.1002/dta.3019
25. Ge Q, Zhang ZW, Cao ZM, et al. Exploration of the in vitro Antiviral Effects and the Active Components of Changyanning Tablets Against Enterovirus 71. Drug Des Devel Ther. 2024;18:651–665. doi:10.2147/DDDT.S444625
26. Guo J, Yang SQ, Zhai WF, et al. Network Pharmacology with Metabolomics Study to Reveal the Mechanisms of Bushen Huoxue Formula in Intervertebral Disc Degeneration Treatment. Drug Des Devel Ther. 2024;18:493–512. doi:10.2147/DDDT.S451197
27. Morris GM, Huey R, Lindstrom W, et al. AutoDock4 and AutoDockTools4: automated docking with selective receptor flexibility. J Comput Chem. 2009;30(16):2785–2791. doi:10.1002/jcc.21256
28. Maier JA, Martinez C, Kasavajhala K, Wickstrom L, Hauser KE, Simmerling C. ff14SB: Improving the Accuracy of Protein Side Chain and Backbone Parameters from ff99SB. J Chem Theory Comput. 2015;11(8):3696–3713. doi:10.1021/acs.jctc.5b00255
29. Wang JM, Wolf RM, Caldwell JW, Kollman PA, Case DA. Development and testing of a general amber force field. J Comput Chem. 2004;25(9):1157–1174. doi:10.1002/jcc.20035
30. Case DA, Cheatham TE III, Darden T, et al. The Amber biomolecular simulation programs. J Comput Chem. 2005;26(16):1668–1688. doi:10.1002/jcc.20290
31. Wu XW, Brooks BR. Force-momentum-based self-guided Langevin dynamics: a rapid sampling method that approaches the canonical ensemble. J Chem Phys. 2011;135(20):204101. doi:10.1063/1.3662489
32. Miyamoto S, Kollman PA. Settle: An analytical version of the SHAKE and RATTLE algorithm for rigid water models. J Comput Chem. 1992;13(8):952–962. doi:10.1002/jcc.540130805
33. Darden T, York D, Pedersen L. Particle mesh Ewald: An N⋅log(N) method for Ewald sums in large systems. J Chem Phys. 1993;98(12):10089–10092. doi:10.1063/1.464397
34. Lee I-S, Yu SY, Jung S-H, et al. Proanthocyanidins from Spenceria ramalana and their effects on AGE formation in vitro and hyaloid-retinal vessel dilation in larval zebrafish in vivo. J Nat Prod. 2013;76(10):1881–1888. doi:10.1021/np400442b
35. Singh A, Castillo HA, Brown J, Kaslin J, Dwyer KM, Gibert Y. High glucose levels affect retinal patterning during zebrafish embryogenesis. Sci Rep. 2019;9(1):4121. doi:10.1038/s41598-019-41009-3
36. Liu SS, Sheng WL, Li Y, et al. Chemical constituents from Alismatis Rhizoma and their anti-inflammatory activities in vitro and in vivo. Bioorg Chem. 2019;92:103226. doi:10.1016/j.bioorg.2019.103226
37. Xin N, Jiang Y, Liu S, Zhou YL, Cheng YB. Effects of prednisolone on behavior and hypothalamic–pituitary–interrenal axis activity in zebrafish. Environ Toxicol Pharmacol. 2020;75:103325. doi:10.1016/j.etap.2020.103325
38. Li Q, Qu HB. Study on the hypoglycemic activities and metabolism of alcohol extract of Alismatis Rhizoma. Fitoterapia. 2012;83(6):1046–1053. doi:10.1016/j.fitote.2012.05.009
39. Li S, Jin SN, Song CW, et al. The strategy for establishment of the multiple reaction monitoring based characteristic chemical profile of triterpenes in Alismatis rhizoma using two combined tandem mass spectrometers. J Chromatogr A. 2017;1524:121–134. doi:10.1016/j.chroma.2017.09.057
40. Yang N, Dong YQ, Wu MF, Li SZ, Yu HX, Yang SS. Establishing a rapid classification and identification method for the major triterpenoids of Alisma orientale. Phytochem Anal. 2020;31(3):384–394. doi:10.1002/pca.2907
41. Wang L, Li S, Li JX, et al. Comprehensive metabolic profiling of Alismatis Rhizoma triterpenes in rats based on characteristic ions and a triterpene database. J Pharm Anal. 2021;11(1):96–107. doi:10.1016/j.jpha.2020.03.010
42. Hitchcock SA, Pennington LD. Structure−Brain Exposure Relationships. J Med Chem. 2006;49(26):7559–7583. doi:10.1021/jm060642i
43. Klaassen I, Van Noorden CJ, Schlingemann RO. Molecular basis of the inner blood-retinal barrier and its breakdown in diabetic macular edema and other pathological conditions. Prog Retin Eye Res. 2013;34:19–48. doi:10.1016/j.preteyeres.2013.02.001
44. Liu YX, Ye Y, Xie GQ, et al. Pharmacological Mechanism of Sancao Yuyang Decoction in the Treatment of Oral Mucositis Based on Network Pharmacology and Experimental Validation. Drug Des Devel Ther. 2023;17:55–74. doi:10.2147/DDDT.S391978
45. Ji XY, Lei CJ, Kong S, et al. Hydroxy-Safflower Yellow A Mitigates Vascular Remodeling in Rat Pulmonary Arterial Hypertension. Drug Des Devel Ther. 2024;18:475–491. doi:10.2147/DDDT.S439686
46. Han CW, Kwun MJ, Kim KH, et al. Ethanol extract of Alismatis Rhizoma reduces acute lung inflammation by suppressing NF-κB and activating Nrf2. J Ethnopharm. 2013;146(1):402–410. doi:10.1016/j.jep.2013.01.010
47. Kalliolias GD, Ivashkiv LB. TNF biology, pathogenic mechanisms and emerging therapeutic strategies. Nat Rev Rheumatol. 2016;12(1):49–62. doi:10.1038/nrrheum.2015.169
48. Zhang W, Liu HT. MAPK signal pathways in the regulation of cell proliferation in mammalian cells. Cell Res. 2002;12(1):9–18. doi:10.1038/sj.cr.7290105
49. Sabio G, Davis RJ. TNF and MAP kinase signalling pathways. Semin Immunol. 2014 26(3):237–245 doi:10.1016/j.smim.2014.02.009
50. Xie MS, Zheng YZ, Huang LB, Xu GX. Infliximab relieves blood retinal barrier breakdown through the p38 MAPK pathway in a diabetic rat model. Int J Ophthalmol. 2017;10(12):1824. doi:10.18240/ijo.2017.12.06
51. Huang XJ, Liu GH, Guo J, Su ZQ. The PI3K/AKT pathway in obesity and type 2 diabetes. Int J Biol Sci. 2018;14(11):1483. doi:10.7150/ijbs.27173
52. Valverde A, Benito M, Lorenzo M. The brown adipose cell: a model for understanding the molecular mechanisms of insulin resistance. Acta Physiol Scand. 2005;183(1):59–73. doi:10.1111/j.1365-201X.2004.01384.x
53. Garcia-Ramírez M, Hernández C, Ruiz-Meana M, et al. Erythropoietin protects retinal pigment epithelial cells against the increase of permeability induced by diabetic conditions: essential role of JAK2/PI3K signaling. Cell Signal. 2011;23(10):1596–1602. doi:10.1016/j.cellsig.2011.05.011
54. Lin FX, Yang YY, Wei SY, et al. Hydrogen sulfide protects against high glucose-induced human umbilical vein endothelial cell injury through activating PI3K/Akt/eNOS pathway. Drug Des Devel Ther. 2020:621–633. doi:10.2147/DDDT.S242521
55. Maugeri G, D’Amico AG, Gagliano C, et al. VIP family members prevent outer blood retinal barrier damage in a model of diabetic macular edema. J Cell Physiol. 2017;232(5):1079–1085. doi:10.1002/jcp.25510
56. Agani F, Jiang B-H. Oxygen-independent regulation of HIF-1: novel involvement of PI3K/AKT/mTOR pathway in cancer. Curr Cancer Drug Targets. 2013;13(3):245–251. doi:10.2174/1568009611313030003
57. Glass AS, Dahm R. The zebrafish as a model organism for eye development. Ophthalmic Res. 2004;36(1):4–24. doi:10.1159/000076105
58. Richardson R, Tracey-White D, Webster A, Moosajee M. The zebrafish eye—a paradigm for investigating human ocular genetics. Eye. 2017;31(1):68–86. doi:10.1038/eye.2016.198
59. Campochiaro PA, Han YS, Mir TA, et al. Increased frequency of topical steroids provides benefit in patients with recalcitrant postsurgical macular edema. Am J Ophthalmol. 2017;178:163–175. doi:10.1016/j.ajo.2017.03.033
60. van Rooijen E, Voest EE, Logister I, et al. von Hippel-Lindau tumor suppressor mutants faithfully model pathological hypoxia-driven angiogenesis and vascular retinopathies in zebrafish. Dis Model Mech. 2010;3(5–6):343–353. doi:10.1242/dmm.004036
61. Aksamitiene E, Kiyatkin A, Kholodenko BN. Cross-talk between mitogenic Ras/MAPK and survival PI3K/Akt pathways: a fine balance. Biochem Soc Trans. 2012;40(1):139–146. doi:10.1042/BST20110609
62. Wang J, Ran Q, Zeng HR, Wang L, Hu CJ, Huang QW. Cellular stress response mechanisms of Rhizoma coptidis: a systematic review. Chin Med. 2018;13:1–14. doi:10.1186/s13020-018-0184-y
63. Hidaka Y, Nakamura S, Nishinaka A, et al. Arctigenin Prevents Retinal Edema in a Murine Retinal Vein Occlusion Model. Biol Pharm Bull. 2023;46(3):473–481. doi:10.1248/bpb.b22-00846
64. Jin J, Yuan F, Shen MQ, Feng YF, He QL. Vascular endothelial growth factor regulates primate choroid-retinal endothelial cell proliferation and tube formation through PI3K/Akt and MEK/ERK dependent signaling. Mol Cell Biochem. 2013;381:267–272. doi:10.1007/s11010-013-1710-y
65. Jacot JL, Sherris D. Potential Therapeutic Roles for Inhibition of the PI3K/Akt/mTOR Pathway in the Pathophysiology of Diabetic Retinopathy. J Ophthalmol. 2011;2011:589813. doi:10.1155/2011/589813
 © 2024 The Author(s). This work is published and licensed by Dove Medical Press Limited. The
full terms of this license are available at https://www.dovepress.com/terms.php
and incorporate the Creative Commons Attribution
- Non Commercial (unported, v3.0) License.
By accessing the work you hereby accept the Terms. Non-commercial uses of the work are permitted
without any further permission from Dove Medical Press Limited, provided the work is properly
attributed. For permission for commercial use of this work, please see paragraphs 4.2 and 5 of our Terms.
© 2024 The Author(s). This work is published and licensed by Dove Medical Press Limited. The
full terms of this license are available at https://www.dovepress.com/terms.php
and incorporate the Creative Commons Attribution
- Non Commercial (unported, v3.0) License.
By accessing the work you hereby accept the Terms. Non-commercial uses of the work are permitted
without any further permission from Dove Medical Press Limited, provided the work is properly
attributed. For permission for commercial use of this work, please see paragraphs 4.2 and 5 of our Terms.