")
Back to Journals » Diabetes, Metabolic Syndrome and Obesity » Volume 17
Association of Midnight Cortisol Level with Bone Mineral Density in Chinese Patients with Type 2 Diabetes Mellitus: A Cross-Sectional Study
Authors Li S, Luo X, Lu Z, Chen N
Received 24 March 2024
Accepted for publication 26 July 2024
Published 5 August 2024 Volume 2024:17 Pages 2943—2953
DOI https://doi.org/10.2147/DMSO.S470391
Checked for plagiarism Yes
Review by Single anonymous peer review
Peer reviewer comments 2
Editor who approved publication: Prof. Dr. Antonio Brunetti
Shangjian Li, Xiumei Luo, Zhiqiang Lu, Ning Chen
Department of Endocrinology, Zhongshan Hospital (Xiamen), Fudan University, Xiamen, Fudan University, Xiamen, People’s Republic of China
Correspondence: Ning Chen, Department of Endocrinology, Zhongshan Hospital (Xiamen), Fudan University, No. 668 Jinhu Road, Xiamen, 361000, People’s Republic of China, Tel/Fax +86-0592-3569583, Email [email protected]
Objective: To investigate the association of the midnight cortisol level with bone mineral density (BMD) in patients with type 2 diabetes mellitus (T2DM).
Methods: This study included 249 T2DM patients (148 males with an average age of 53.8 years and 101 postmenopausal females with an average age of 63.6 years) admitted to Xiamen Hospital of Zhongshan Hospital Affiliated to Fudan University from January 2018 to April 2020. Baseline data were compared between patients with normal BMD and those with osteoporosis/osteopenia. The patients also were divided into groups according to the tertiles of midnight cortisol levels.
Results: Among all T2DM, 178 had osteoporosis/osteopenia, including 98 men and 80 women. The baseline data analysis showed that patients with osteoporosis/osteopenia were more likely to be older, female, and thin, and to have high cortisol. Additionally, elevated estradiol levels had a protective effect on bone; once osteoporosis/osteopenia occurred, the probability of severe osteoporotic fracture was significantly increased. The BMD of the femoral neck, hip joint and lumbar spine decreased with increasing midnight cortisol level in men, postmenopausal women, and all T2DM patients (P< 0.05). Multivariate logistic regression analysis identified body mass index, estradiol level, and midnight cortisol level as independent risk factors for osteoporosis/osteopenia in T2DM patients.
Conclusion: Higher midnight cortisol levels are significantly associated with increased risk of osteoporosis/osteopenia in T2DM patients. Thus, the midnight cortisol level represents a valuable marker for assessing osteoporosis/osteopenia risk in these patients.
Keywords: type 2 diabetes mellitus, midnight cortisol, bone mineral density, osteoporosis
With the urbanization and aging of China, the prevalence of overweight and obesity continues to increase, which is accompanied by a continual increase in the prevalence of type 2 diabetes mellitus (T2DM). The prevalence of T2DM among people aged 18 years and older has reached 11.2%.1 Studies investigating the mechanisms underlying T2DM have provided evidence that hypothalamic-pituitary-adrenal (HPA) axis function is closely related to blood glucose control and that patients with T2DM exhibit HPA axis dysfunction, which can manifest as increased cortisol secretion. Excessive cortisol production can lead to a series of clinical symptoms, such as a flushed and rounded facial appearance, abdominal obesity, osteoporosis, skin changes, hypertension, abnormal sex hormone levels, changes in mood, etc.2,3 The literature suggests that normal or elevated bone mineral density (BMD) are common in patients with T2DM, although T2DM patients are at increased risk for brittle fractures.4 Whether differences in cortisol levels affect BMD and brittle fracture risk in patients with T2DM is a topic worthy of further discussion. Recent studies have also found that both exogenous and endogenous cortisol increases lead to bone loss.5 Boro et al found that increased endogenous cortisol significantly reduces BMD in the lumbar spine, femoral neck, and hip joints as a whole.6 Another study showed that increased cortisol secretion is closely related to bone loss in postmenopausal women.7 García Alfaro et al found that high levels of cortisol are associated with lower BMD in the femoral neck, suggesting harmful effects of cortisol excess on cortical bone.8 Another study found that the degree and duration of cortisol increase are major factors affecting bone loss and fracture risk.9 Sorensen et al found that the increase of endogenous cortisol may lead to an increase in bone marrow fat, which may affect bone trabecula and lead to bone destruction.10 However, studies investigating whether BMD is affected by the HPA axis in patients with T2DM are lacking. Therefore, the present study aimed to characterize the relationship between the midnight serum cortisol level and BMD in patients with T2DM and to explore its clinical significance.
Data and Methods
Study Population
A total of 249 patients with T2DM admitted to the Department of Endocrinology, Xiamen Hospital, Zhongshan Hospital Affiliated to Fudan University from January 2018 to April 2020 were selected as the study population. All patients were admitted due to poor blood glucose control. All patients met the World Health Organization (WHO) criteria for the diagnosis and typing of diabetes mellitus in 199911 and were enrolled after testing negative for glutamate decarboxylase antibody. Osteoporosis was diagnosed based on dual-energy x-ray absorptiometry (DXA) measurement of BMD and application of the following diagnostic criteria recommended by the WHO in 1994: a BMD value within 1 standard deviation (SD) of the peak value for normal adults of the same sex and race was considered normal; BMD value decreased between 1.0 and 2.5 SDs was considered osteopenia; BMD value decreased by ≥2.5 SDs was classified as osteoporosis; and BMD value decreased by ≥2.5 SDs (diagnostic criterion for osteoporosis) accompanied by one or more fractures was regarded as severe osteoporosis.12
The following exclusion criteria were applied: (1) diagnosis of type 1 DM, gestational DM, or any special type of DM; (2) presence of mental illness, infectious disease, surgical trauma, stress state, abnormal function of important organs such as heart, liver, and kidney; (3) use of drugs affecting the cortisol level within 2 months of the study period; (4) presence of any disease known to cause abnormal cortisol levels (such as Cushing syndrome, etc).; (5) use of drugs affecting bone metabolism (steroid hormones, vitamin D, calcium agents, bisphosphonates); (6) diagnosis of any endocrine disease affecting bone metabolism (thyroid, parathyroid, adrenal and gonadal diseases), any autoimmune disease, any digestive tract or kidney disease affecting calcium and phosphorus metabolism, any malignant tumor, or any congenital and acquired bone metabolism disease. This study was approved by the Ethics Committee of Zhongshan Hospital Affiliated to Fudan University (Xiamen) on June 21, 2024 with approval number B2024-037. All enrolled patients and their families provided written informed consent for inclusion in this study.
Methods
Data Collection
For all patients, demographic information and past medical history, including the time of T2DM diagnosis and any T2DM complication, were collected. Age, height, body mass, waist circumference, hip circumference, and blood pressure were recorded, and body mass index (BMI) was calculated.
Sample Collection and Testing
Rhythm detection of serum cortisol levels: Blood samples for cortisol measurement were taken at 0:00 (midnight, 12:00 a.m), 8:00 (8:00 a.m), and 16:00 (4:00 p.m), and the serum cortisol level was measured by the chemiluminescence method. Reference value ranges for cortisol levels ranged from 50–138 nmol/l at midnight, 166–507 nmol/l at 8:00, and 143.7–208.8 nmol/L at 16:00. Chemiluminescence detection of cortisol has been shown to provide high sensitivity, specificity, precision and accuracy.13
Measurement of biochemical, bone metabolism and sex hormone indicators: Fasting plasma glucose (FPG), insulin, triglyceride (TG), total cholesterol (TC), high-density lipoprotein cholesterol (HDL-c), low-density lipoprotein cholesterol (LDL-c), glycosylated hemoglobin (HbA1c), alanine aminotransferase (ALT), aspartate aminotransferase (AST), blood urea nitrogen (BUN), and blood creatinine (CREA) levels were measured using blood samples collected at 6:00 a.m. after patients had fasted for at least 8 h. The glomerular filtration rate (eGFR) was calculated, and the uric acid (UA), calcium (Ca), phosphorus (P), parathyroid hormone (PTH), osteocalcin (OCN), amino-telopeptide of type I procollagen (PINP), carboxy-telopeptide beta cross-linked peptide of type I collagen (CTX-β), and other hormone levels also were measured. The plasma TG, TC, HDL-c, and LDL-c concentrations were detected using an automatic biochemical analyzer, and the FPG level was determined by the glucose oxidase method. The HbA1c level was determined by high-performance liquid chromatography. The homeostasis model assessment for insulin resistance (HOMA-IR) was used to estimate insulin resistance and calculated as FPG (mmol/L) × fasting insulin (μU/mL)/22.5.14
The 25-hydroxyvitamin D3[25 (OH) D] level and concentrations of bone turnover markers such as intact PTH, OCN, and PINP were measured using an automated chemiluminescence analyzer (Cobas e602, Roche). Estradiol (E2), luteinizing hormone (LH), follicle-stimulating hormone (FSH), progesterone (P), testosterone (T) and prolactin (PRL) also were measured by chemiluminescence immunoassay (Cobas e602, Roche Diagnostics). The detection sensitivity levels were 0.025 ng/mL for T, 0.100 mIU/mL for LH, and 0.100 mIU/mL for FSH. The intra- and interassay coefficients of variation were, respectively, 8% and 10% for T, 3% and 2.9% for LH, and 2.9% and 2.7% for FSH.
BMD measurement and diagnosis of osteoporosis: BMD was measured by DXA (QDR4500A, Hologic Inc., Waltham MA, USA) at three different sites: the lumbar spine, femoral neck (FN), and total hip joint (TH). Osteoporosis and osteopenia were defined based on BMD measurements at three different sites with a minimum T-score of −1.0 or less. The Fracture Risk Assessment Tool (FRAX) were used to estimate the probability of major osteoporotic fracture (MOF) and hip fractures (HF) occurring over a 10-year period.
Statistical Analysis
After normality testing, the measurement data were expressed as mean ± SD (x±SD) if they conformed to a normal distribution or as percentage if they did not conform to a normal distribution. Statistical differences in normal data were tested by t-test, and those in non-normal data were tested by t-test after ln transformation. The non-parameter test was used for data that could not be transformed into normal, and the χ2 test was used for measurement data. All statistical analyses were conducted using SPSS 25.0 software, and P<0.05 defined statistical significance.
Results
Comparison of Basic Data Between Patients with Normal BMD and Those with Osteoporosis/Osteopenia
All enrolled patients with T2DM were hospitalized patients who were admitted for adjustment of their blood glucose due to poor control of blood glucose (mean glycosylated hemoglobin >9%) in the clinic. Among the 249 T2DM patients included in this study, 148 were male and 101 were postmenopausal female. In addition, 71 patients had normal BMD measurements, and 178 patients had osteoporosis or osteopenia. The characteristics of the groups with normal BMD and osteoporosis/osteopenia are compared in Table 1. Age, OCN level, midnight cortisol, FRAX MOF score, FRAX HF score, and the percentage of female patients were significantly higher in the osteoporosis/osteopenia group than in the normal group (all P<0.05). Height, weight, BMI, waist circumference, hip circumference, E2 level, and P level were significantly lower in the osteoporosis/osteopenia group than in the normal BMD group (all P<0.05). No significant differences between the two groups were found for any of the other analyzed parameters.
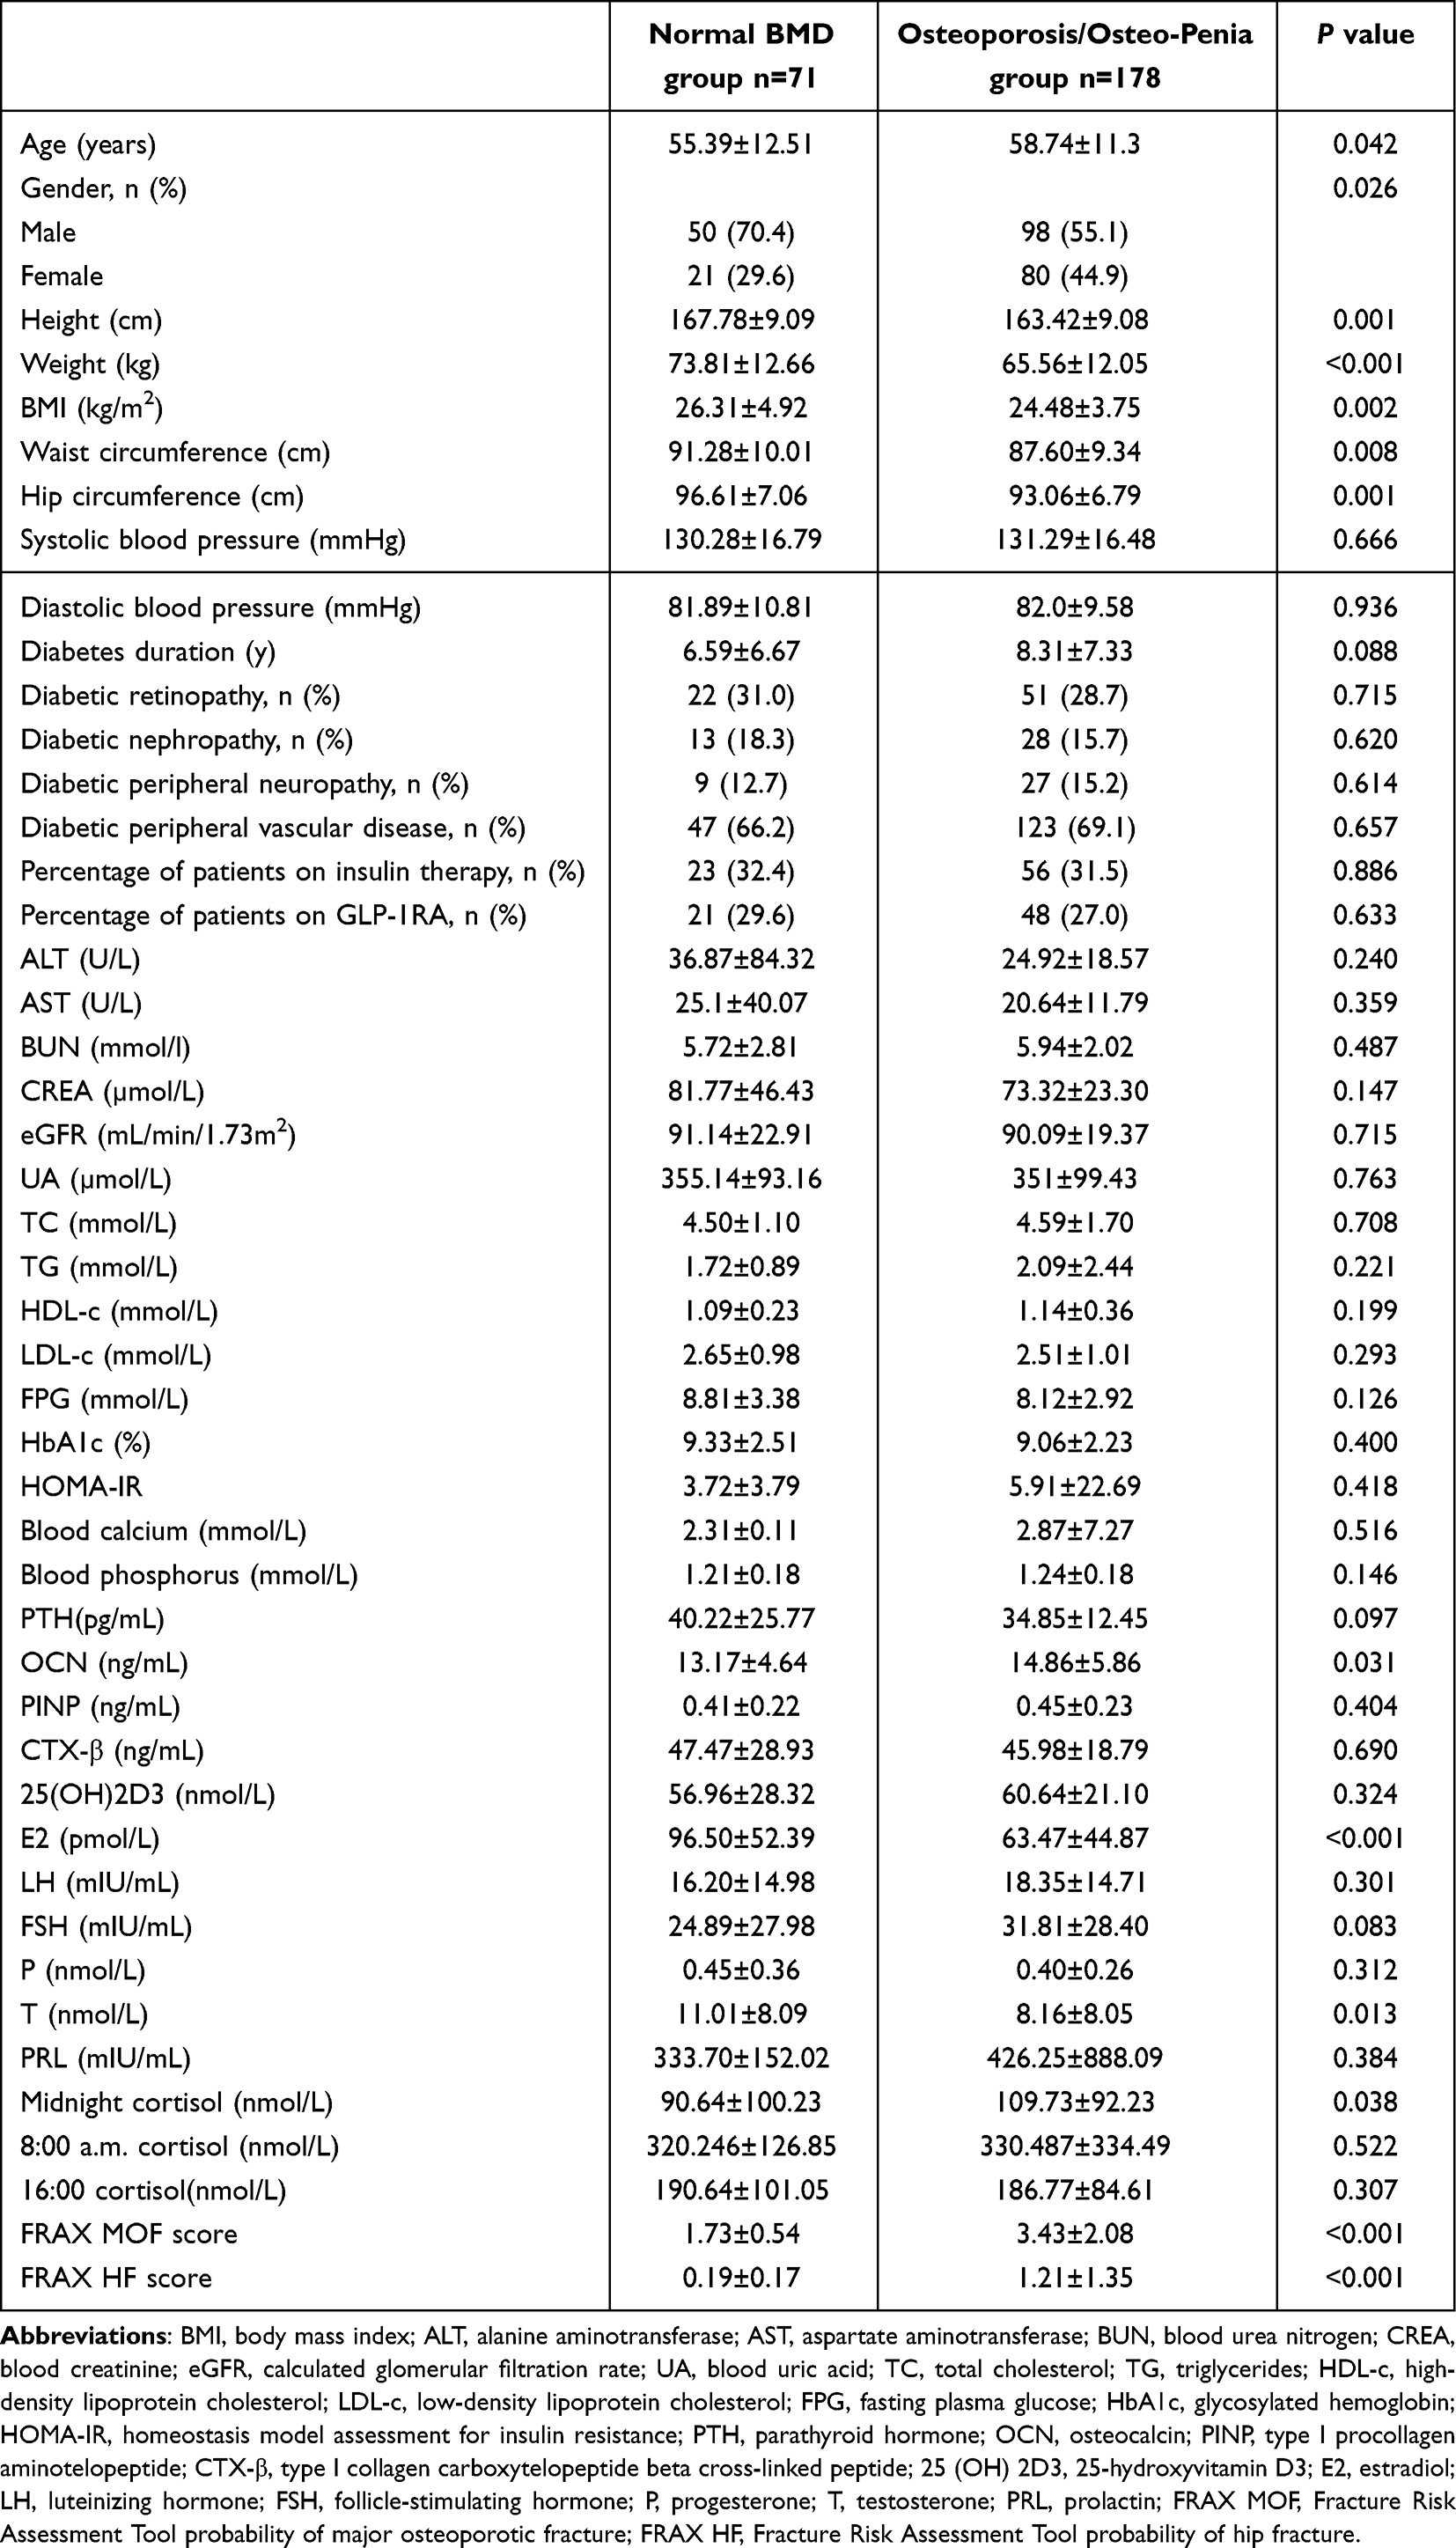 |
Table 1 Comparison of Basic Data Between Normal BMD and Osteoporosis/Osteopenia Groups of All T2DM Patients |
The basic data of T2DM patients were tabulated and analyzed by sex (Table 2). The study population included 98 cases of osteoporosis/osteopenia in male T2DM patients. Compared with male T2DM patients with normal BMD, those with osteoporosis/osteopenia had significantly lower values of height, weight, BMI, waist circumference, hip circumference, and E2, and significantly higher values of midnight cortisol, FRAX MOF score, and FRAX HF score (all P<0.05). The study included 80 cases of osteoporosis/osteopenia in postmenopausal women with T2DM. Compared with postmenopausal women with T2DM with normal BMD, those with osteoporosis/osteopenia had significantly lower values of weight, BMI, waist circumference, hip circumference and E2, and significantly higher values of midnight cortisol, FRAX MOF score, and FRAX HF score (all P<0.05).
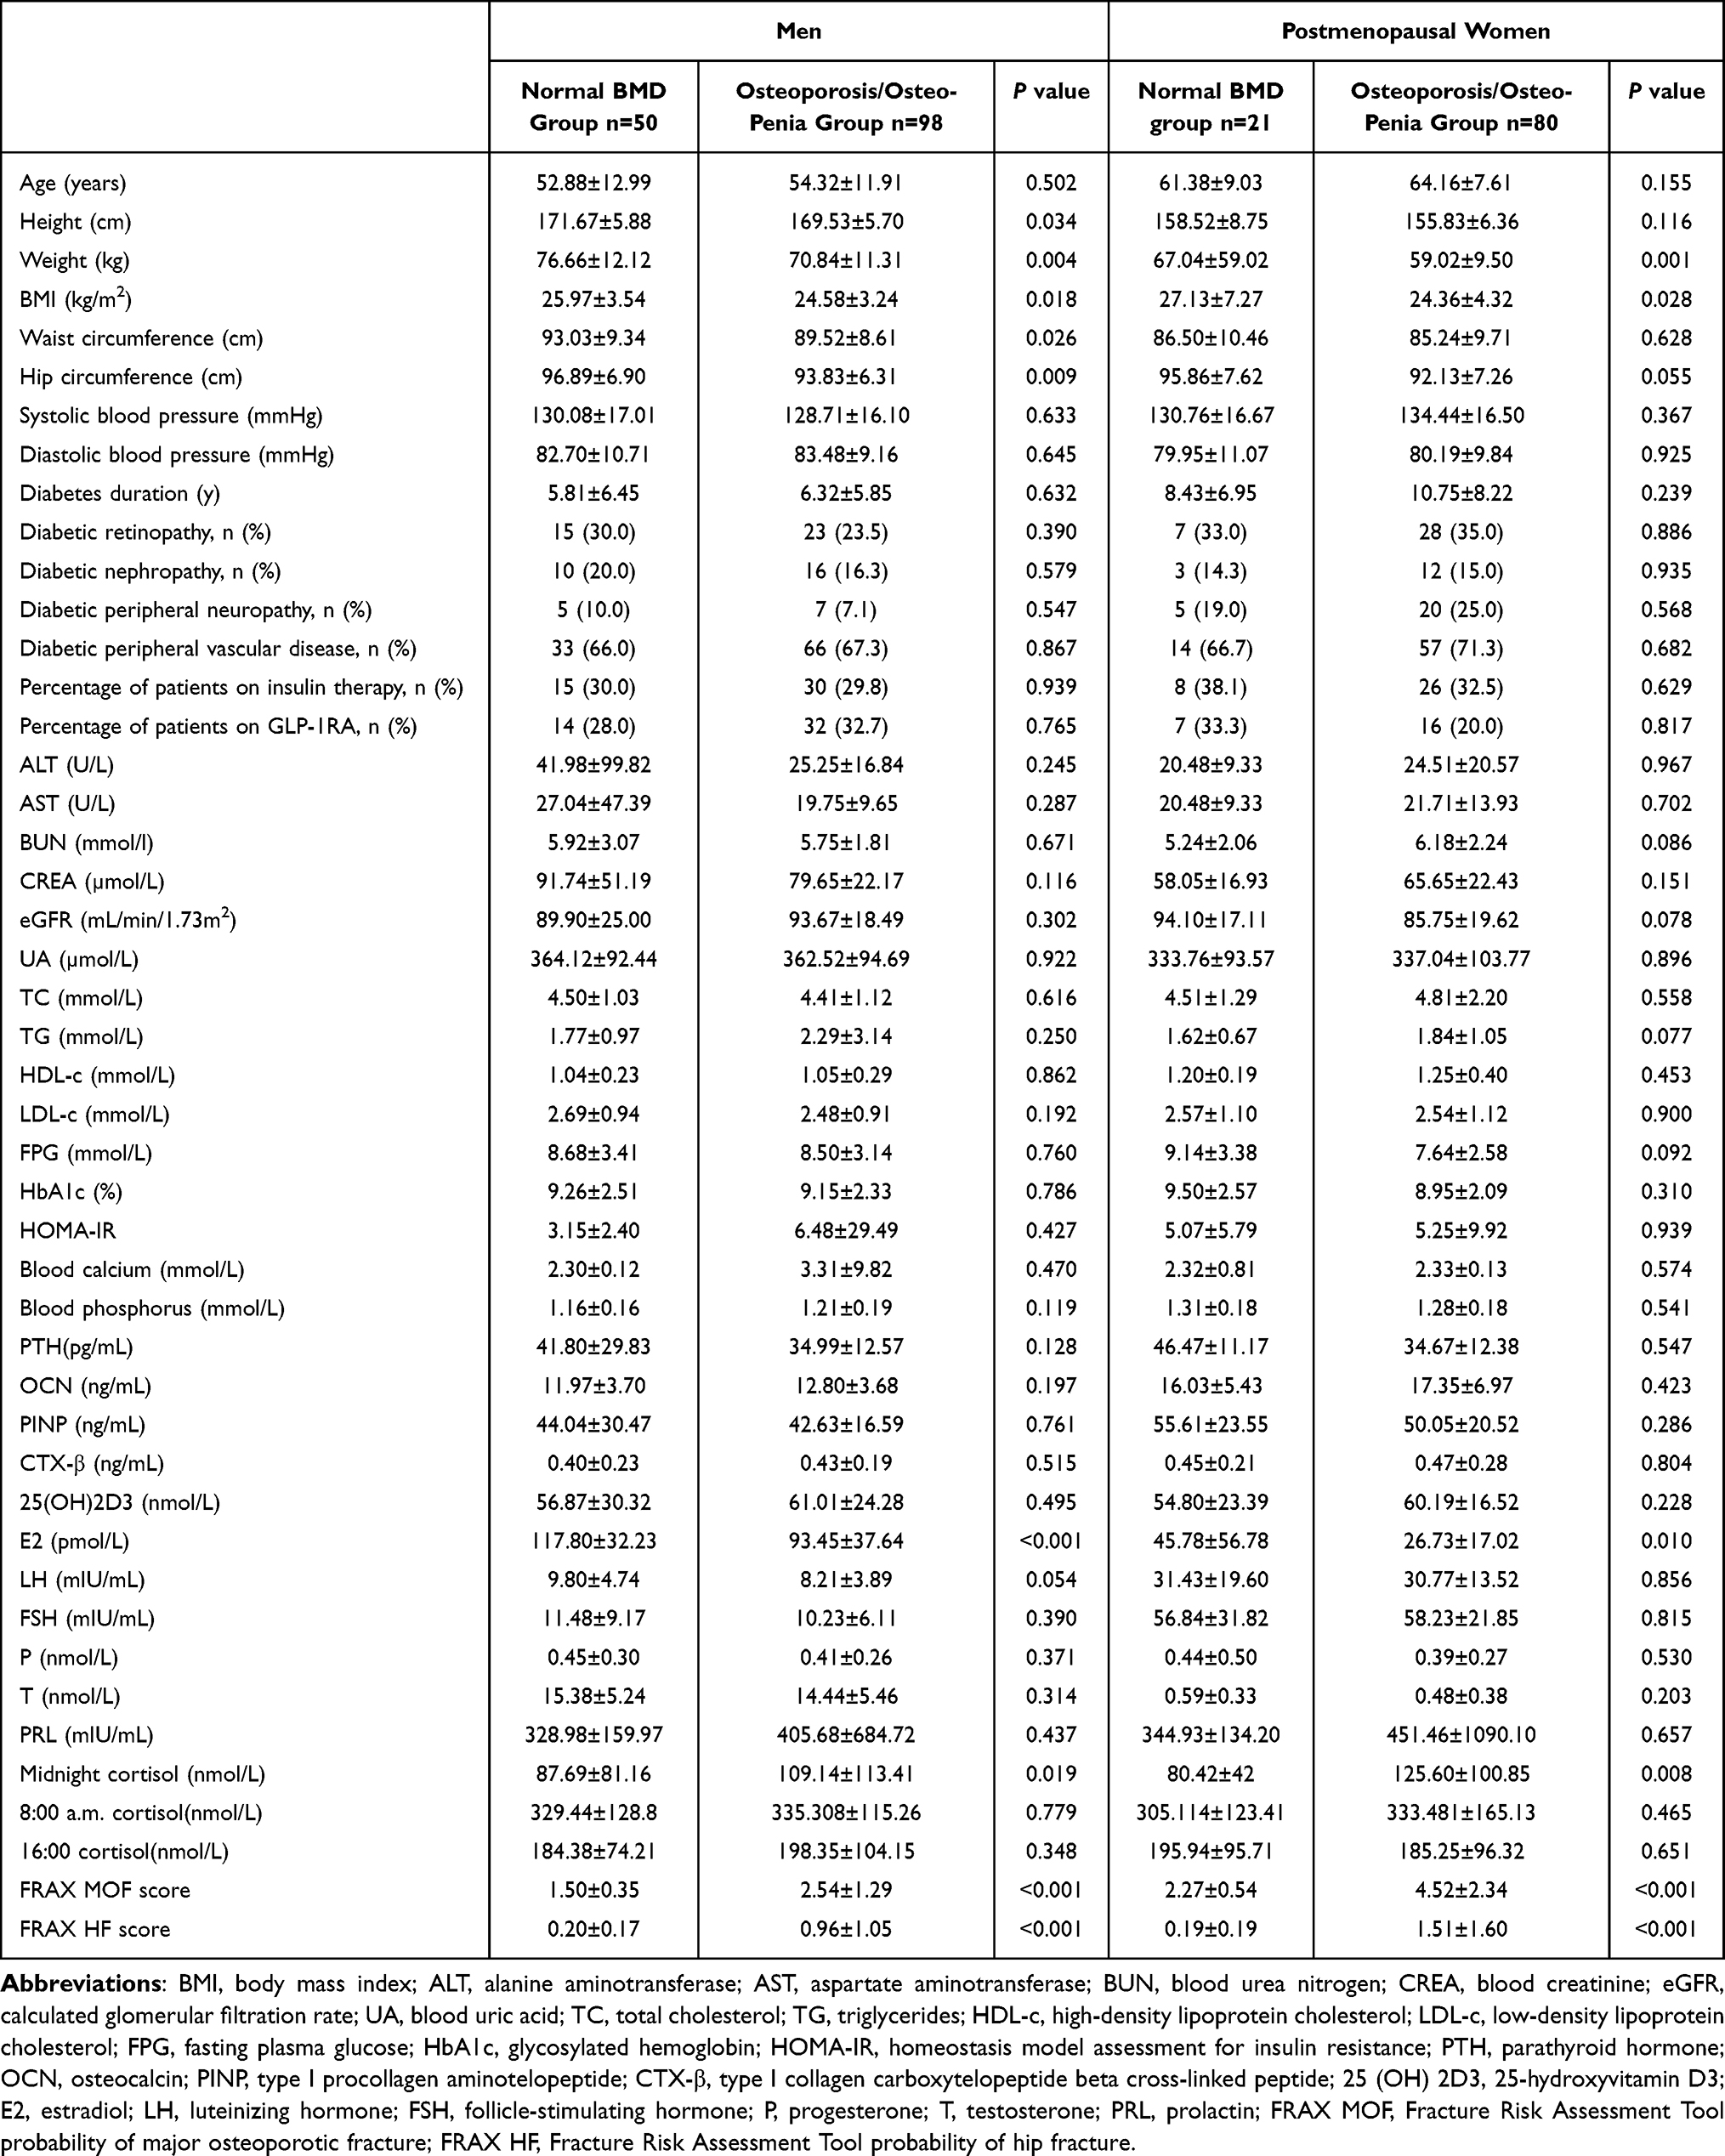 |
Table 2 Comparison of Basic Data Between Normal BMD and Osteoporosis/Osteopenia Groups Among Men and Postmenopausal Women with T2DM |
Overall, these results indicate that T2DM patients with older age, female sex, lower BMI, and high midnight cortisol levels were more likely to develop osteoporosis/osteopenia; elevated E2 levels have protective effects on bone; and once osteoporosis/osteopenia occurs, the probability of MOF is significantly increased.
Comparison of BMD Among Patients with Cortisol Levels in Different Tertiles
To investigate the association of BMD with cortisol levels, the all T2DM patients were divided into three groups according to the tertiles of different cortisol measurements. The BMD values at different locations are compared among the groups divided by the tertiles of different cortisol measurements in Table 3. The 249 T2DM patients were grouped according to the tertiles of midnight cortisol into group A1 (midnight cortisol ≤52.2 nmol/l, n=83 patients), group B1 (midnight cortisol between 52.2 nmol/l and 103.7 nmol/l, n=83 patients), and group C1 (midnight cortisol ≥103.7 nmol/l, n=83 patients). The results showed that BMD measurements at the femoral neck, hip joint, and lumbar spine decreased with increasing midnight cortisol level (all P<0.05). The patients also were grouped according to the tertiles of the 8:00 (8:00 a.m). cortisol level into three groups: group A2 (8:00 cortisol ≤261.6 nmol/l, n=83 patients), group B2 (8:00 cortisol between 261.6 nmol/l and 82.6 nmol/l, n=83 patients), and group C2 (8:00 cortisol ≥382.6 nmol/l, n=83 patients). No significant difference in BMD values at the femoral neck, hip joint, or lumbar spine were detected among the groups with different 8:00 cortisol levels (all P>0.05). Additionally, the patients were grouped according to the tertiles of the 16:00 (4:00 p.m) cortisol level into three groups: group A3 (16:00 cortisol ≤143.7 nmol/l, n=83 patients), group B3 (16:00 cortisol between 143.7 nmol/l and 208.8 nmol/l, n=83 patients), and group C3 (16:00 cortisol ≥208.8 nmol/l, n=83 patients). No significant difference in BMD values at the femoral neck, hip joint, or lumbar spine were detected among the groups with different 16:00 cortisol levels (all P>0.05).
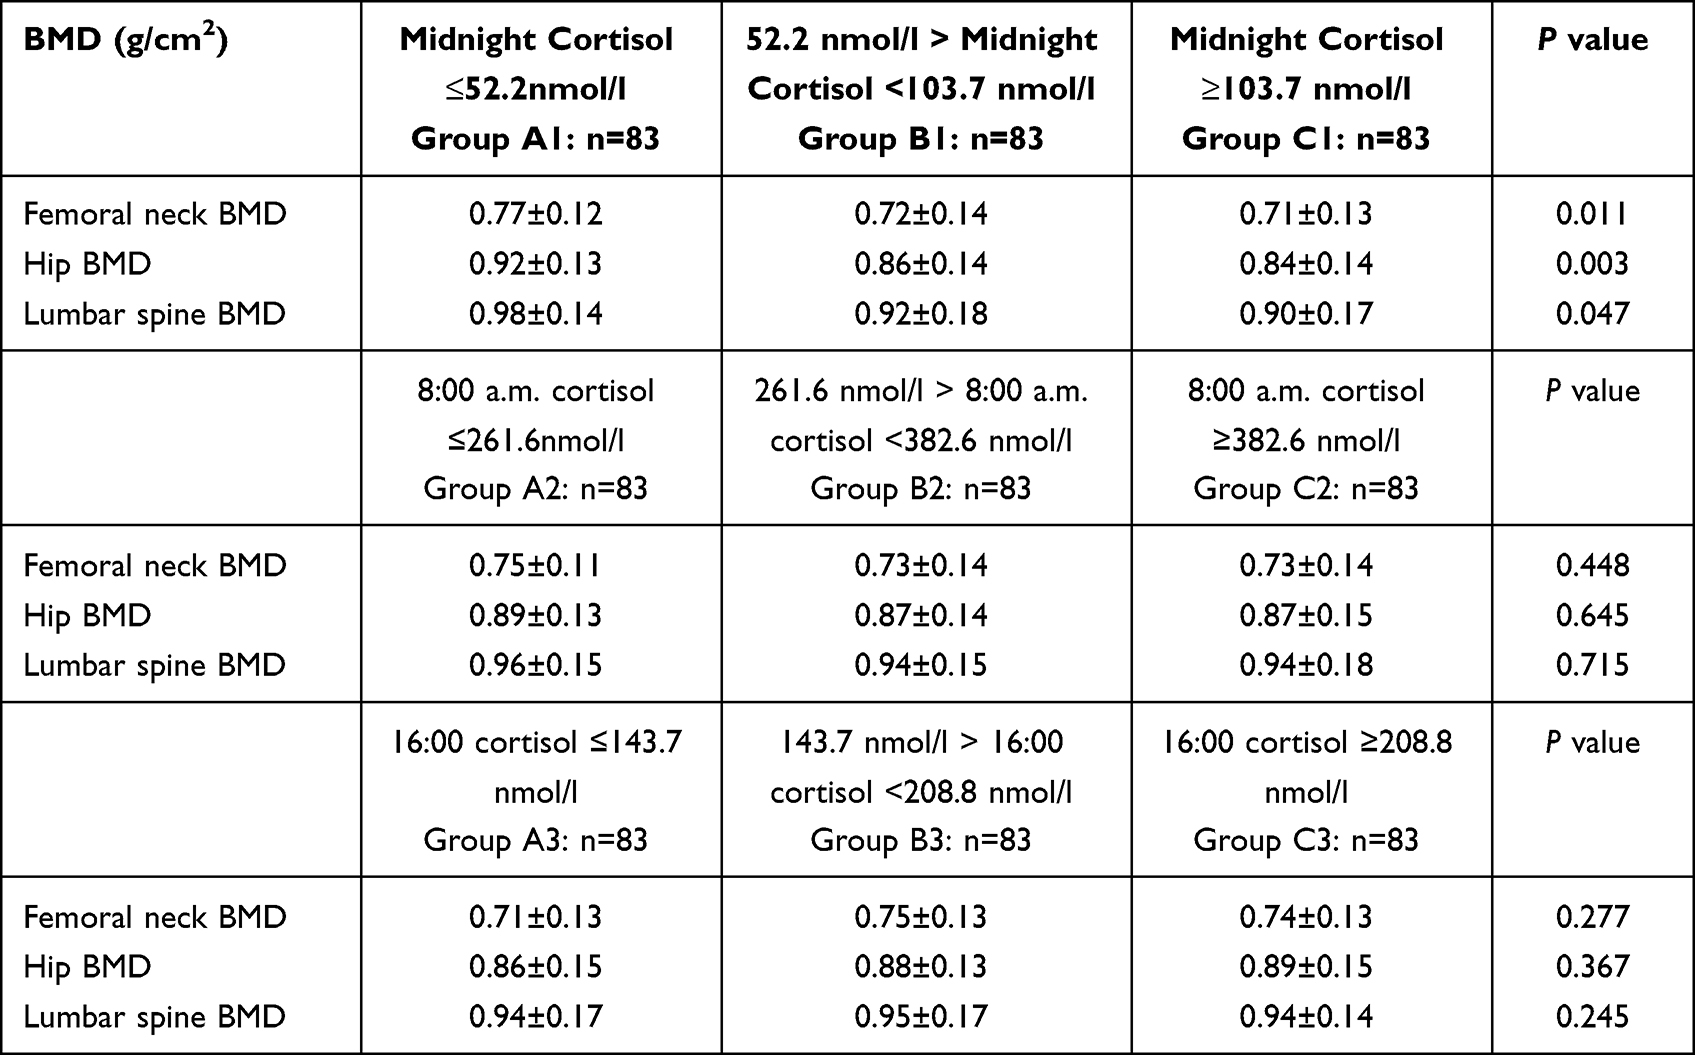 |
Table 3 Comparison of BMD Among All T2DM Patients with Different Cortisol Levels at Different Times (by Tertile) |
The male T2DM patients were divided into three groups according to the tertiles of cortisol measurements at the three different time points, and BMD values at different locations were compared among the groups (Table 4). The results showed that BMD measurements at the femoral neck, hip joint, and lumbar spine decreased with increasing midnight cortisol level (all P<0.05). No significant differences in BMD values at the femoral neck, hip joint, or lumbar spine were detected among the groups with different 8:00 cortisol levels or different 16:00 cortisol levels (all P>0.05).
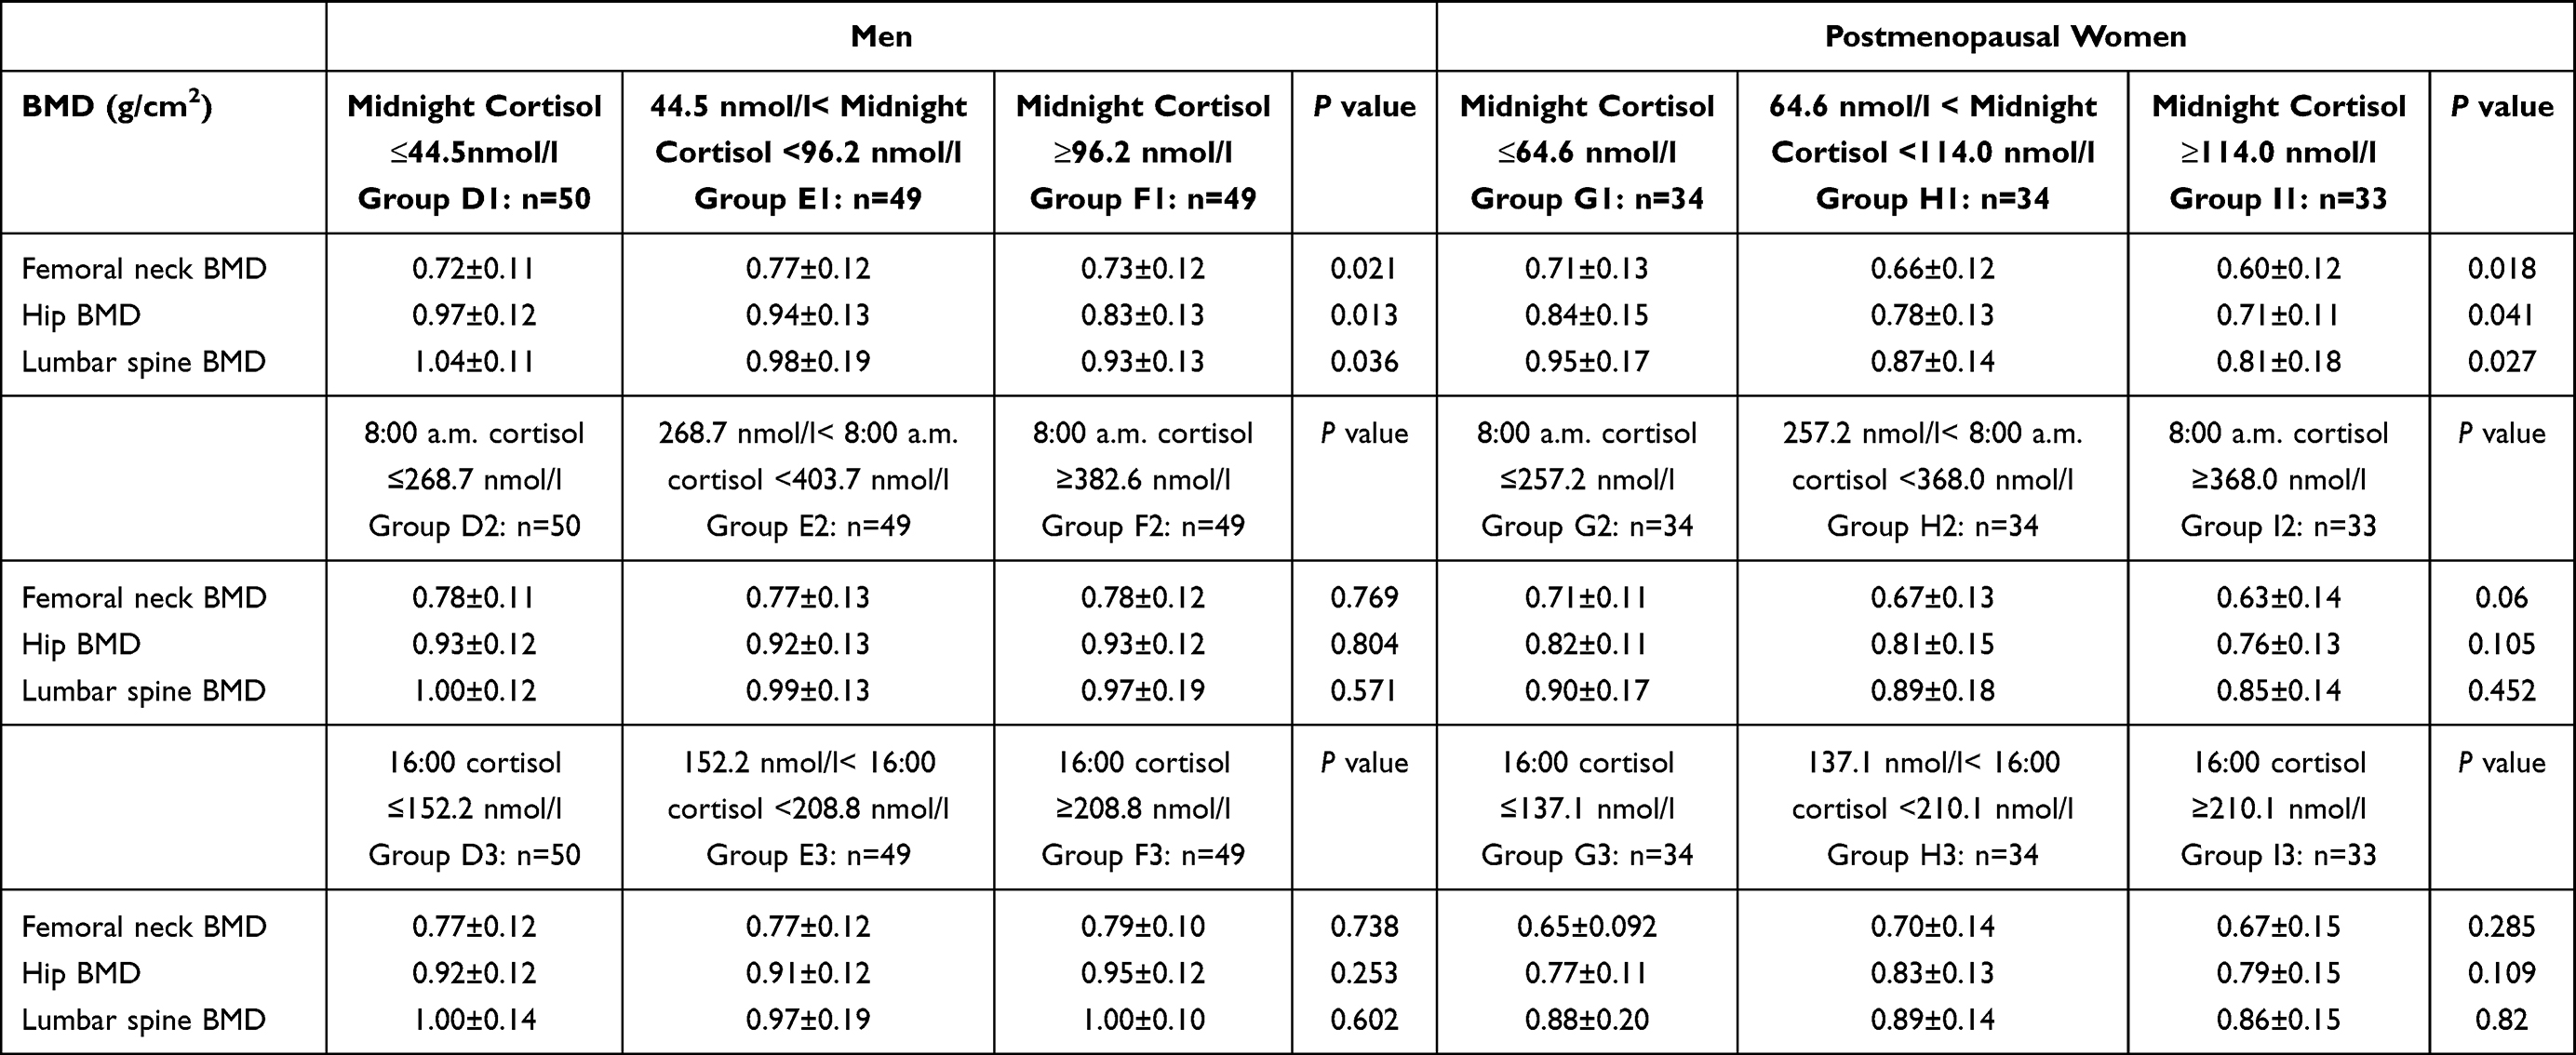 |
Table 4 Comparison of BMD Among Male and Postmenopausal Female Patients with Different Cortisol Levels at Different Times (by Tertile) |
The postmenopausal female T2DM patients also were divided into three groups according to the tertiles of cortisol measurements at the three different time points, and BMD values at different locations were compared among the groups (Table 4). The results showed that BMD measurements at the femoral neck, hip joint, and lumbar spine decreased with increasing midnight cortisol level (all P<0.05). However, as observed in male patients also, no significant differences in BMD values at the femoral neck, hip joint, or lumbar spine were detected among the groups with different 8:00 cortisol levels or different 16:00 cortisol levels (all P>0.05).
Risk Factors for Osteoporosis/Osteopenia in T2DM Patients
Multivariate logistic regression analysis of variables independently associated with osteoporosis/osteopenia in all T2DM patients identified age, sex, BMI, diabetes duration, HbA1c, E2 level, and midnight cortisol level (Table 5). In this analysis, age, BMI, diabetes duration, HbA1c, E2 level, and midnight cortisol level were continuous variables, while sex was a binary variable (male and female). Among these factors, BMI and the midnight cortisol level were negatively correlated with osteoporosis/osteopenia risk, and the E2 level was positively correlated with osteoporosis/osteopenia risk.
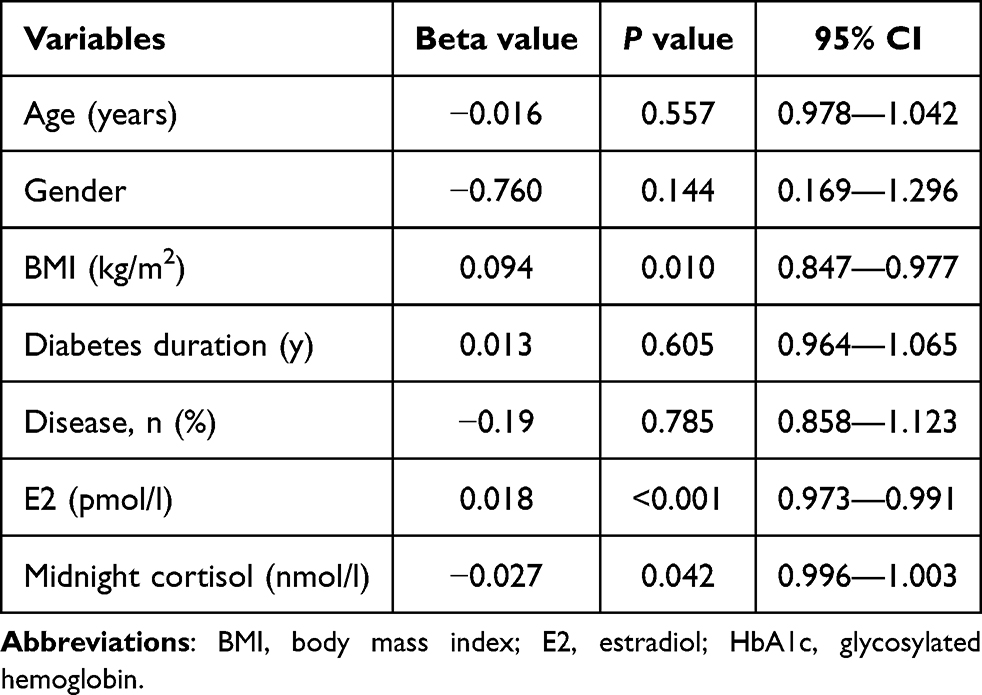 |
Table 5 Multivariate Logistic Regression Analysis of Independent Risk Factors for Osteoporosis/Osteopenia in All T2DM Patients |
Discussion
In a total sample of 249 patients with T2DM, the prevalence of osteoporosis/osteopenia was 66.1% in men and 79% in postmenopausal women, and midnight cortisol levels were significantly higher in patients with osteoporosis/osteopenia than in patients with normal BMD. Further statistical analyses of data from men with T2DM showed that men with osteoporosis/osteopenia also had elevated cortisol levels at midnight compared with those with normal bone mass, and the same relationship was observed in postmenopausal women with T2DM. Studies have shown that normal or increased bone mineral density are common in patients with T2DM, but patients with T2DM have an increased risk of brittle fracture.4,15 Some scholars put forward that even in the presence of normal or increased BMD, other factors, including poor glycemic control, abnormal bone turnover, and bone loss, may explain the increased risk of fractures in T2DM patients.16 Therefore, whether differences in cortisol levels in patients with T2DM have an impact on BMD and brittle fracture risk is a topic worthy of investigation. The HPA axis is the hub of the neuroendocrine immune network, playing an important role in feedback regulation.17 In healthy individuals, cortisol levels follow a pulse-type secretion pattern, obviously in accordance with the circadian rhythm, with the lowest values occurring at midnight and peak values occurring at approximately 8:00 a.m. The rhythm of blood cortisol concentrations is usually measured by the three-point method, with blood samples drawn at the 8:00, 16:00, and 0:00 hours for cortisol measurement.18 Chronic hyperglycemia and sleep disturbance are common among T2DM patients. These chronic stresses affect the function of the HPA axis, resulting in circadian rhythm disorder, which corresponds to an increase in the cortisol level at midnight.19 Studies have shown that higher midnight cortisol levels, in turn, further increase the risk of sleep apnea in patients with T2DM and thus affect sleep quality in these patients.20 It has been reported that the hippocampus, as an important component of the limbic system, participates in negative feedback regulation of the HPA axis and plays an important role in regulating cortisol secretion. In T2DM patients, long-term poor blood glucose control or chronic complications can trigger a series of chronic stress reactions, resulting in structural and functional damage to the hippocampus, resulting in weakened inhibition of the HPA axis. On the one hand, this can cause resting-state HPA axis circadian rhythm disorder, such that the midnight cortisol level is increased. On the other hand, this can cause hippocampal stress-related dysfunction, resulting in persistent activation of the HPA axis-mediated stress response.21 Studies have shown that high levels of cortisol can negatively affect bone metabolism, possibly through several pathways, including: 1. inhibition of bone formation: In the process of bone formation, mesenchymal progenitor cells mature into osteoblasts after several stages of differentiation. Osteoblasts at different stages of maturation may be affected by excessive endogenous or therapeutic cortisol. High levels of cortisol can inhibit the proliferation and differentiation of osteocytes and reduce collagen synthesis and mineralization during bone formation, resulting in slower bone metabolism and reduced bone formation ability;22 2. promotion of bone resorption: Cortisol can promote the bone resorption process and increase the risk of osteoporosis. Conaway et al found that cortisol can directly regulate RANKL-stimulated osteoclast formation and activity by mouse bone marrow macrophages, thus inhibiting apoptosis of bone resorption cells (osteoclasts) and increasing the number and activity of osteoclasts, resulting in bone destruction;23 or 3. induction of calcium imbalance: Cortisol can interfere with calcium absorption in the gut as well as its reabsorption by the kidneys, resulting in increased calcium excretion. This may lead to calcium deficiency in the body, which in turn affects the maintenance of bone density.24 We found that changes in cortisol levels at 8:00 and 16:00 had no significant effect on femoral neck BMD, hip BMD, or lumbar BMD, whereas an increased cortisol level at 0:00 correlated with decreases in femoral neck BMD, hip BMD, and lumbar BMD, suggesting that monitoring of midnight cortisol levels offers a more sensitive measurement than cortisol at other times for predicting an increased risk of osteoporosis/osteopenia in patients with T2DM. In addition, BMI, E2 level, and midnight cortisol level were found to be independent risk factors for predicting osteoporosis/osteopenia risk in T2DM patients by multivariate logistic regression analysis. Among these factors, BMI has already been shown to be negatively correlated with osteoporosis/osteopenia risk,25 and E2 level to be positively correlated with osteoporosis/osteopenia risk.26 As with estrogen deficiency, elevated glucocorticoid levels are associated with an increased risk of osteoporosis. Glucocorticoids inhibit periosteal cell proliferation and reduce the number of osteoblasts, thereby inhibiting bone formation.27 The present study observed a negative correlation between the midnight cortisol level and the osteoporosis/osteopenia risk. Therefore, screening midnight cortisol levels is important for assessing the risk of osteoporosis/osteopenia in patients with T2DM, and lowering the midnight cortisol level may have a protective effect on bone in clinical practice.
The present study has the advantage of the scientific detection of the cortisol rhythm and provides new insight into whether the midnight cortisol level is related to BMD in T2DM patients, which has not been determined in previous studies. In this study, data were analyzed from multiple angles and support the conclusion that detection of the midnight cortisol level is beneficial for guiding clinical strategies for the prevention and treatment of osteoporosis. However, the present study has some limitations also. The number of included cases was small, and the study was a cross-sectional study, which limits the strength of the evidence. The study’s lack of a control group of non-diabetic individuals and lack of information on the study population’s history of fragility fractures are also limitations. Future observational or interventional studies with large sample sizes are needed to confirm the findings of the present study.
Conclusion
Higher midnight cortisol levels are significantly associated with increased risk of osteoporosis/osteopenia in T2DM patients. Thus, the midnight cortisol level represents a valuable marker for assessing osteoporosis/osteopenia risk in these patients. Decreasing midnight cortisol levels may have a protective effect on bone mass in patients with T2DM.
Ethical Approval
All procedures performed in studies involving human participants were in accordance with the ethical standards of the institutional and/or national research committee and with the Helsinki Declaration and its later amendments or comparable ethical standards.
Acknowledgments
We are grateful to all the patients for their participation.
Author Contributions
All authors made a significant contribution to the work reported, whether that is in the conception, study design, execution, acquisition of data, analysis and interpretation, or in all these areas; took part in drafting, revising or critically reviewing the article; gave final approval of the version to be published; have agreed on the journal to which the article has been submitted; and agree to be accountable for all aspects of the work.
Disclosure
The authors declare that they have no conflicts of interest in this work.
References
1. Yan Y, Wu T, Zhang M, Li C, Liu Q, Li F. Prevalence, awareness and control of type 2 diabetes mellitus and risk factors in Chinese elderly population. BMC Public Health. 2022;22(1):1382. doi:10.1186/s12889-022-13759-9
2. Raff H, Magill SB. Is the hypothalamic-pituitary-adrenal axis disrupted in type 2 diabetes mellitus? Endocrine. 2016;54(2):273–275. doi:10.1007/s12020-016-1108-1
3. Gadelha M, Gatto F, Wildemberg LE, Fleseriu M. Cushing’s syndrome. Lancet. 2023;402(10418):2237–2252. doi:10.1016/S0140-6736(23)01961-X
4. Li G, Prior JC, Leslie WD, et al. Frailty and risk of fractures in patients with type 2 diabetes. Diabetes Care. 2019;42(4):507–513. doi:10.2337/dc18-1965
5. Hardy RS, Zhou H, Seibel MJ, Cooper MS. Glucocorticoids and bone: consequences of endogenous and exogenous excess and replacement therapy. Endocr Rev. 2018;39(5):519–548.
6. Boro H, Mannar V, Malhotra R, et al. Trabecular bone score and bone mineral density as indices of skeletal fragility in endogenous Cushing’s syndrome. Clin Endocrinol. 2023;99(3):253–261. doi:10.1111/cen.14944
7. Osella G, Ventura M, Ardito A, et al. Cortisol secretion, bone health, and bone loss: a cross-sectional and prospective study in normal non-osteoporotic women in the early postmenopausal period. Eur J Endocrinol. 2012;166(5):855–860. doi:10.1530/EJE-11-0957
8. Garcia-Alfaro P, Garcia S, Rodriguez I, Pascual MA, Perez-Lopez FR. Association of endogenous hormones and bone mineral density in postmenopausal women. J Midlife Health. 2023;14(3):196–204. doi:10.4103/jmh.jmh_115_23
9. Trementino L, Appolloni G, Ceccoli L, et al. Bone complications in patients with Cushing’s syndrome: looking for clinical, biochemical, and genetic determinants. Osteoporos Int. 2014;25(3):913–921. doi:10.1007/s00198-013-2520-5
10. Sorensen NN, Andreasen CM, Jensen PR, et al. Disturbed bone marrow adiposity in patients with Cushing’s syndrome and glucocorticoid- and postmenopausal- induced osteoporosis. Front Endocrinol. 2023;14:1232574.
11. Consultation WH. Definition, diagnosis and classification of diabetes mellitus and its complications. Part 1_ diagnosis and classification of diabetes mellitus provisional report of a WHO consultation; 1999.
12. Kanis JA, Kanis JA. Assessment of fracture risk and its application to screening for postmenopausal osteoporosis_ synopsis of a WHO report. WHO study group. Osteoporosis Int. 1994;4:368–381. doi:10.1007/BF01622200
13. Kohen F, Pazzagli M, Kim JB, Lindner HR. An immunoassay for plasma cortisol based on chemiluminescence. Steroids. 1980;36(4):421–437. doi:10.1016/0039-128X(80)90030-6
14. Jiang X, Gruner M, Tremollieres F, et al. Diagnostic accuracy of FRAX in predicting the 10-year risk of osteoporotic fractures using the USA treatment thresholds: a systematic review and meta-analysis. Bone. 2017;99:20–25. doi:10.1016/j.bone.2017.02.008
15. Ma W, Zhou X, Huang X, Xiong Y. Causal relationship between body mass index, type 2 diabetes and bone mineral density: Mendelian randomization. PLoS One. 2023;18(10):e0290530. doi:10.1371/journal.pone.0290530
16. Oei L, Zillikens MC, Dehghan A, et al. High bone mineral density and fracture risk in type 2 diabetes as skeletal complications of inadequate glucose control: the Rotterdam Study. Diabetes Care. 2013;36(6):1619–1628. doi:10.2337/dc12-1188
17. Segner H, Verburg-van Kemenade BML, Chadzinska M. The immunomodulatory role of the hypothalamus-pituitary-gonad axis: proximate mechanism for reproduction-immune trade offs? Dev Comp Immunol. 2017;66:43–60. doi:10.1016/j.dci.2016.07.004
18. Liyanarachchi K, Ross R, Debono M. Human studies on hypothalamo-pituitary-adrenal (HPA) axis. Best Pract Res Clin Endocrinol Metab. 2017;31(5):459–473. doi:10.1016/j.beem.2017.10.011
19. Hackett RA, Dal Z, Steptoe A. The relationship between sleep problems and cortisol in people with type 2 diabetes. Psychoneuroendocrinology. 2020;2020:117.
20. Gan L, Li N, Heizhati M, et al. Diurnal cortisol features and type 2 diabetes risk in patients with hypertension and obstructive sleep apnea: a cohort study. J Clin Endocrinol Metab. 2023;108(9):e679–e686. doi:10.1210/clinem/dgad184
21. Szeszko PR, Lehrner A, Yehuda R. Glucocorticoids and hippocampal structure and function in PTSD. Harv Rev Psychiatry. 2018;26(3):142–157. doi:10.1097/HRP.0000000000000188
22. Chen JH, Shen C, Oh HR, Park JH. Glucocorticoids inhibit the maturation of committed osteoblasts via SOX2. J Mol Endocrinol. 2022;68(4):195–207. doi:10.1530/JME-21-0213
23. Conaway HH, Henning P, Lie A, Tuckermann J, Lerner UH. Activation of dimeric glucocorticoid receptors in osteoclast progenitors potentiates RANKL induced mature osteoclast bone resorbing activity. Bone. 2016;93:43–54. doi:10.1016/j.bone.2016.08.024
24. Ferrari P. Cortisol and the renal handling of electrolytes: role in glucocorticoid-induced hypertension and bone disease. Best Pract Res Clin Endocrinol Metab. 2003;17(4):575–589. doi:10.1016/S1521-690X(03)00053-8
25. Goltzman D. The aging skeleton. Adv Exp Med Biol. 2019;1164:153–160.
26. Lu W, Zheng S, Zhou J, Huang S, Chen N, Li Z. Association of plasma sex-related hormones levels with bone mineral densities and risk of osteoporosis and osteopenia in men and menopausal women with type 2 diabetes mellitus. Diabetes Metab Syndr Obes. 2023;16:457–468. doi:10.2147/DMSO.S401397
27. DeLoughery EP, Dow ML. Decreased bone mineral density and reproductive axis dysfunctio. Neth J Med. 2020;78:50–54.
 © 2024 The Author(s). This work is published and licensed by Dove Medical Press Limited. The
full terms of this license are available at https://www.dovepress.com/terms.php
and incorporate the Creative Commons Attribution
- Non Commercial (unported, v3.0) License.
By accessing the work you hereby accept the Terms. Non-commercial uses of the work are permitted
without any further permission from Dove Medical Press Limited, provided the work is properly
attributed. For permission for commercial use of this work, please see paragraphs 4.2 and 5 of our Terms.
© 2024 The Author(s). This work is published and licensed by Dove Medical Press Limited. The
full terms of this license are available at https://www.dovepress.com/terms.php
and incorporate the Creative Commons Attribution
- Non Commercial (unported, v3.0) License.
By accessing the work you hereby accept the Terms. Non-commercial uses of the work are permitted
without any further permission from Dove Medical Press Limited, provided the work is properly
attributed. For permission for commercial use of this work, please see paragraphs 4.2 and 5 of our Terms.