")
Back to Journals » Diabetes, Metabolic Syndrome and Obesity » Volume 17
Association of Questionnaire-Based Physical Activity Analysis and Body Composition Dynamics in Type 2 Diabetes: A Cross-Sectional Study
Authors Li DD , Yang X, Yang Y, Zhao LH, Zhang TT, Wang YN, Su JB , Wang LH, Shi HY
Received 12 January 2024
Accepted for publication 30 July 2024
Published 8 August 2024 Volume 2024:17 Pages 2955—2966
DOI https://doi.org/10.2147/DMSO.S459356
Checked for plagiarism Yes
Review by Single anonymous peer review
Peer reviewer comments 2
Editor who approved publication: Prof. Dr. Muthuswamy Balasubramanyam
Dan-Dan Li,1,* Xue Yang,1,* Yang Yang,2,* Li-Hua Zhao,1 Tian-Tian Zhang,3 Yi-Nan Wang,1 Jian-Bin Su,1 Li-Hua Wang,4 Hai-Yan Shi3
1Department of Endocrinology, Affiliated Hospital 2 of Nantong University, and First People’s Hospital of Nantong City, Nantong, 226006, People’s Republic of China; 2Department of General Practice, Affiliated Hospital 2 of Nantong University, and First People’s Hospital of Nantong City, Nantong, 226006, People’s Republic of China; 3Department of Hepatobiliary Surgery, Affiliated Hospital 2 of Nantong University, and First People’s Hospital of Nantong City, Nantong, 226006, People’s Republic of China; 4Department of Nursing, Affiliated Hospital 2 of Nantong University, and First People’s Hospital of Nantong City, Nantong, 226006, People’s Republic of China
*These authors contributed equally to this work
Correspondence: Li-Hua Wang, Department of Nursing, Affiliated Hospital 2 of Nantong University, and First People’s Hospital of Nantong City, Nantong, 226006, People’s Republic of China, Email [email protected] Hai-Yan Shi, Department of Hepatobiliary Surgery, Affiliated Hospital 2 of Nantong University, and First People’s Hospital of Nantong City, Nantong, 226006, People’s Republic of China, Email [email protected]
Background: Physical activity (PA) exerts an important influence on glycemic control in type 2 diabetes (T2D) patients. Alterations in body composition in patients with T2D may be involved in the overall pathophysiologic process, but PAs and alterations in body composition have been poorly studied.
Methods: A total of 615 patients with T2D were selected by convenient sampling. The patients were investigated with the International Physical Activity Questionnaire (IPAQ-S). Moreover, biochemical indices were collected, and the progression of the body composition of the subjects was determined via dual-energy X-ray absorptiometry (DXA). The variables included lumbar bone mineral density (LSBMD), femoral neck bone mineral density (FNBMD), hip bone mineral density (HBMD), whole-body bone mineral density (TBMD), limb skeletal muscle mass index (ASMI), whole-body fat percentage (B-FAT) and trunk fat percentage (T-FAT). Moreover, the levels of physical activity (high level of physical activity [H-PA], medium level of physical activity [M-PA] and low level of physical activity [L-PA]) were divided into three groups to analyze the changes in patient body composition with changes in physical activity level.
Results: One-way analysis of variance showed that β-CTX, TP1NP, HbA1c, B-FAT and T-FAT increased significantly (p< 0.05), while 25(OH)D, LSBMD, FNBMD, HBMD, TBMD and ASMI decreased significantly (p< 0.001) with the decrease of physical activity. However, there was no significant difference in serum lipids between lnHOMA-ir and lnHOMA-β (p> 0.05). Multiple linear regression model was established to gradually adjust for clinical confounding factors. It was found that physical activity level was independently positively correlated with LSBMD, FNBMD, HBMD, TBMD, and ASMI, and was independently negatively correlated with B-FAT and T-FAT in patients with type 2 diabetes.
Conclusion: A lack of physical activity is an independent risk factor for decreased bone mineral density, decreased skeletal muscle content and increased fat content in patients with T2D.
Keywords: type 2 diabetes, physical activity, body composition, correlation
Introduction
The composition of the body primarily consists of bone, muscle, and fat, with a balanced proportion being the fundamental prerequisite for maintaining optimal health. Due to the effects of abnormal glucose metabolism in T2D patients, bone metabolism and lipid metabolism are altered, and the body composition is out of balance.1,2 In T2D, in the presence of insulin resistance, skeletal muscle metabolic dysfunction leads to an increase in protein catabolism and a decrease in synthesis, causing a decrease in muscle strength and a decrease in muscle mass, which in turn leads to the development of sarcopenia.3,4 Studies have shown that diabetic osteoporosis (DOP) can be comorbid in approximately 50% of diabetic patients,5 which increases the risk of falls and fractures.6 Seventy-two percent of the T2D population has high abdominal fat deposition, and hypertension, dyslipidemia, and insulin resistance are the main factors that cause abdominal visceral adipose tissue (VAT) accumulation.7,8 T2DM patients with abdominal obesity exhibit more severe lipid metabolism disorders, and the degree of insulin resistance and dyslipidemia becomes increasingly pronounced as the body mass index rises.9
Previous studies have shown that insufficient physical activity and sedentary behavior are the main factors leading to obesity and insulin resistance in T2D.10,11 Insufficient long-term Physical Activity (PA) has a direct impact on bone mineral content and skeletal muscle mass,12,13 and is closely related to the morbidity and mortality of T2D.14 Studies on physical activity and body composition in T2D patients have received much attention, but whether there is a quantitative relationship between physical activity and body composition in T2D patients has yet to be investigated. Therefore, this study investigated whether there is a relationship between different levels of physical activity and changes in body composition.
Materials and methods
Participants
T2D patients hospitalized from June 2020 to July 2022 in the Department of Endocrinology and Metabolism of a tertiary hospital in Nantong city were sampled via convenience sampling.
The inclusion criteria for individuals were as follows: (1) met the World Health Organization (WHO) 1999 diagnostic criteria;15 (2) aged 25–75 years; (3) had diabetes for a duration of ≥6 months; (4) had a glucose-lowering regimen unchanged for 3 months prior to enrollment; and (5) voluntarily participated in this study and maintained the same basic lifestyle for 6 months.
Exclusion criteria: (1) Type 1 diabetes, gestational diabetes, and other special type; (2) history of metabolic diseases such as hyperthyroidism, hypothyroidism, and rheumatoid arthritis; (3) combination of serious diabetic complications, such as diabetic ketoacidosis, diabetic hyperosmolar coma; (4) the presence of long-term glucocorticoids and sex hormones; (5) patients with pacemakers or metal plates installed in the body.16 This study was reviewed and approved by the Ethics Committee of the Second Affiliated Hospital of Nantong University in accordance with the Declaration of Helsinki. In addition, all participants provided informed consent when recruited for the study.
Data Collection
The International Physical Activity Questionnaire (IPAQ-S) was used in this study to assess physical activity levels and sedentary behavior, which was developed by the International Consensus Group on Physical Activity Measurement in 2001,17 with 7 items and 4 dimensions, 3 categories of physical activity, namely, high intensity and moderate intensity, and low intensity, and 3 categories of physical activity and sedentary behavior. The questionnaire asked patients to review the number of days they had been physically active in the past 7 days, the length of activity per day, and the length of sedentary time per day; only activities and sedentary time over 10 min were considered relevant physical activities and sedentary time. The metabolic equivalent value of high-intensity physical activity was 8.0 MET, moderate-intensity physical activity was 4.0 MET, and low-intensity physical activity was 3.3 MET.18 Physical activity levels are reported as medians and quartiles. Individuals’ weekly level of physical activity of a certain intensity was calculated as follows: metabolic equivalent (MET), corresponding to physical activity × weekly frequency (d/w) × time per day (min/d); total physical activity level (MET-min/w), high-intensity physical activity level + moderate-intensity physical activity level + low-intensity physical activity level. The patients were grouped according to physical activity level: low, moderate, or high.
The diabetes treatment regimens in this study included insulin injection therapy, oral insulinotropic agents, insulin sensitizers, bisphosphonates, α-glucosidase inhibitors, DDP-4 inhibitors, SGLT-2 inhibitors, GLP-1 receptor agonists, and lifestyle intervention alone. Lifestyle alone was defined as only dietary control or physical activity in the last three months without receiving any diabetes medication.
In this study, the body composition of T2D patients was determined using DXA from Hologic Discovery Wi (S/N 86856), which was introduced into the Department of Nuclear Medicine of our hospital. The body composition measurements included lumbar spine (L1~L4) bone mineral density (LSBMD), femoral neck bone mineral density (FNBMD), hip bone mineral density (H-BMD), and total body mineral density (T-BMD); trunk bone mineral salt content, lean tissue mass, and fat mass; total body bone mineral salt content, lean tissue mass, and fat mass; and extremity skeletal muscle mass (ASM). In this study, trunk fat percentage (%) = trunk fat mass (g)/ [trunk bone mineral salt mass (g) + trunk lean tissue mass (g) + trunk fat mass (g)]; whole body fat percentage (%) = whole body fat mass (g)/ [whole body bone mineral salt mass (g) + whole body lean tissue mass (g) + whole body fat mass (g); and extremity skeletal muscle mass index (ASMI) were used to assess limb skeletal muscle mass, ie, ASMI = limb skeletal muscle mass (kg)/height2 (m2).
For the collection of blood samples, elbow venous blood was drawn from each patient by the ward nurse early the following morning for the determination of biochemical markers after an overnight fast of 8 hours. Fasting insulin levels (FINS, two-site sandwich immunoassay with direct chemiluminescence) were measured using a fully automated chemiluminescence immunoassay analyzer (UniCel DxI800, Beckman Coulter) with automated detection steps; fasting glucose levels (FPG, oxidase assay), triglyceride levels (TGS, colorimetric assay), total cholesterol levels (TC, cholesterol oxidase assay), LDL cholesterol, and LDL cholesterol were determined by the ward nurse. Total cholesterol (TC, cholesterol oxidase method), low-density lipoprotein cholesterol (LDLC, selective melting method), and high-density lipoprotein cholesterol (HDLC, enzyme-modified method) were measured with an automated biochemical instrument (Model 7600, Hitachi, Ltd). The serum N-terminal osteocalcin (N-MID), β-collagen specific sequence (β-CTX), and total type I precollagen amino-terminal extended peptide (TP1NP) were measured via electrochemiluminescence immunoassay; the levels of 25-hydroxyvitamin D and parathyroid hormone (PTH) were measured via liquid chromatography-tandem mass spectrometry; and glycosylated hemoglobin (HbA1c) was measured via ion exchange high-performance liquid chromatography. All biochemical indices were measured by professional physicians in the Department of Medical Laboratory of our hospital. In this study, the insulin resistance index and pancreatic β-cell secretion function were assessed by the Homeostasis Model Assessment (HOMA):19 insulin resistance index (HOMA-IR) = FPG × FINS/22.5; and the pancreatic β-cell secretion index (HOMA-β) = 20 × FINS/(FPG-3.5).
Statistical Analysis
The general data, biochemical indices and body composition parameters of T2D patients were analyzed according to physical activity level (H-PA, M-PA, and L-PA); one-way ANOVA was used for normally distributed data; the χ2 test was used for count data, which are presented as the mean ± standard deviation ( ) and frequency or constitutive ratio; and the use of a scatter plot to demonstrate the differences in body composition parameters among patients with different physical activity levels and body composition parameters among patients with different levels of physical activity.
A multiple linear regression model was further developed to explore the differences in the mean values of the body composition parameters (LSBMD, FNBMD, HBMD, TBMD, ASMI, B-FAT, and T-FAT) between the M-PA and L-PA subgroups by stepwise correction for other clinical confounders (B [95% CI]), with the H-PA group serving as the reference.
The data were statistically analyzed using SPSS 22.0 and GraphPad Prism 9.0.2; The alpha values were taken as 0.05 as the test level, and the p values were all two-sided probabilities, with p<0.05 indicating a statistically significant difference.
Results
Clinical Characteristics of Patients
Table 1 categorizes 615 patients with T2D into three groups according to their level of physical activity: H-PA, M-PA, and L-PA; 173 (28.2%), 232 (37.7%), and 210 (34.1%) of these patients, respectively. Differences among the three groups were statistically significant in terms of the number of females, age, duration of diabetes mellitus, history of previous falls, regular consumption of seafood, consumption of strong tea and coffee, and administration of alpha-glucosidase inhibitors, SGLT-2 inhibitors, and GLP-1 receptor agonists (p<0.05); however, no differences existed in the other clinical fundamentals (p>0.05).
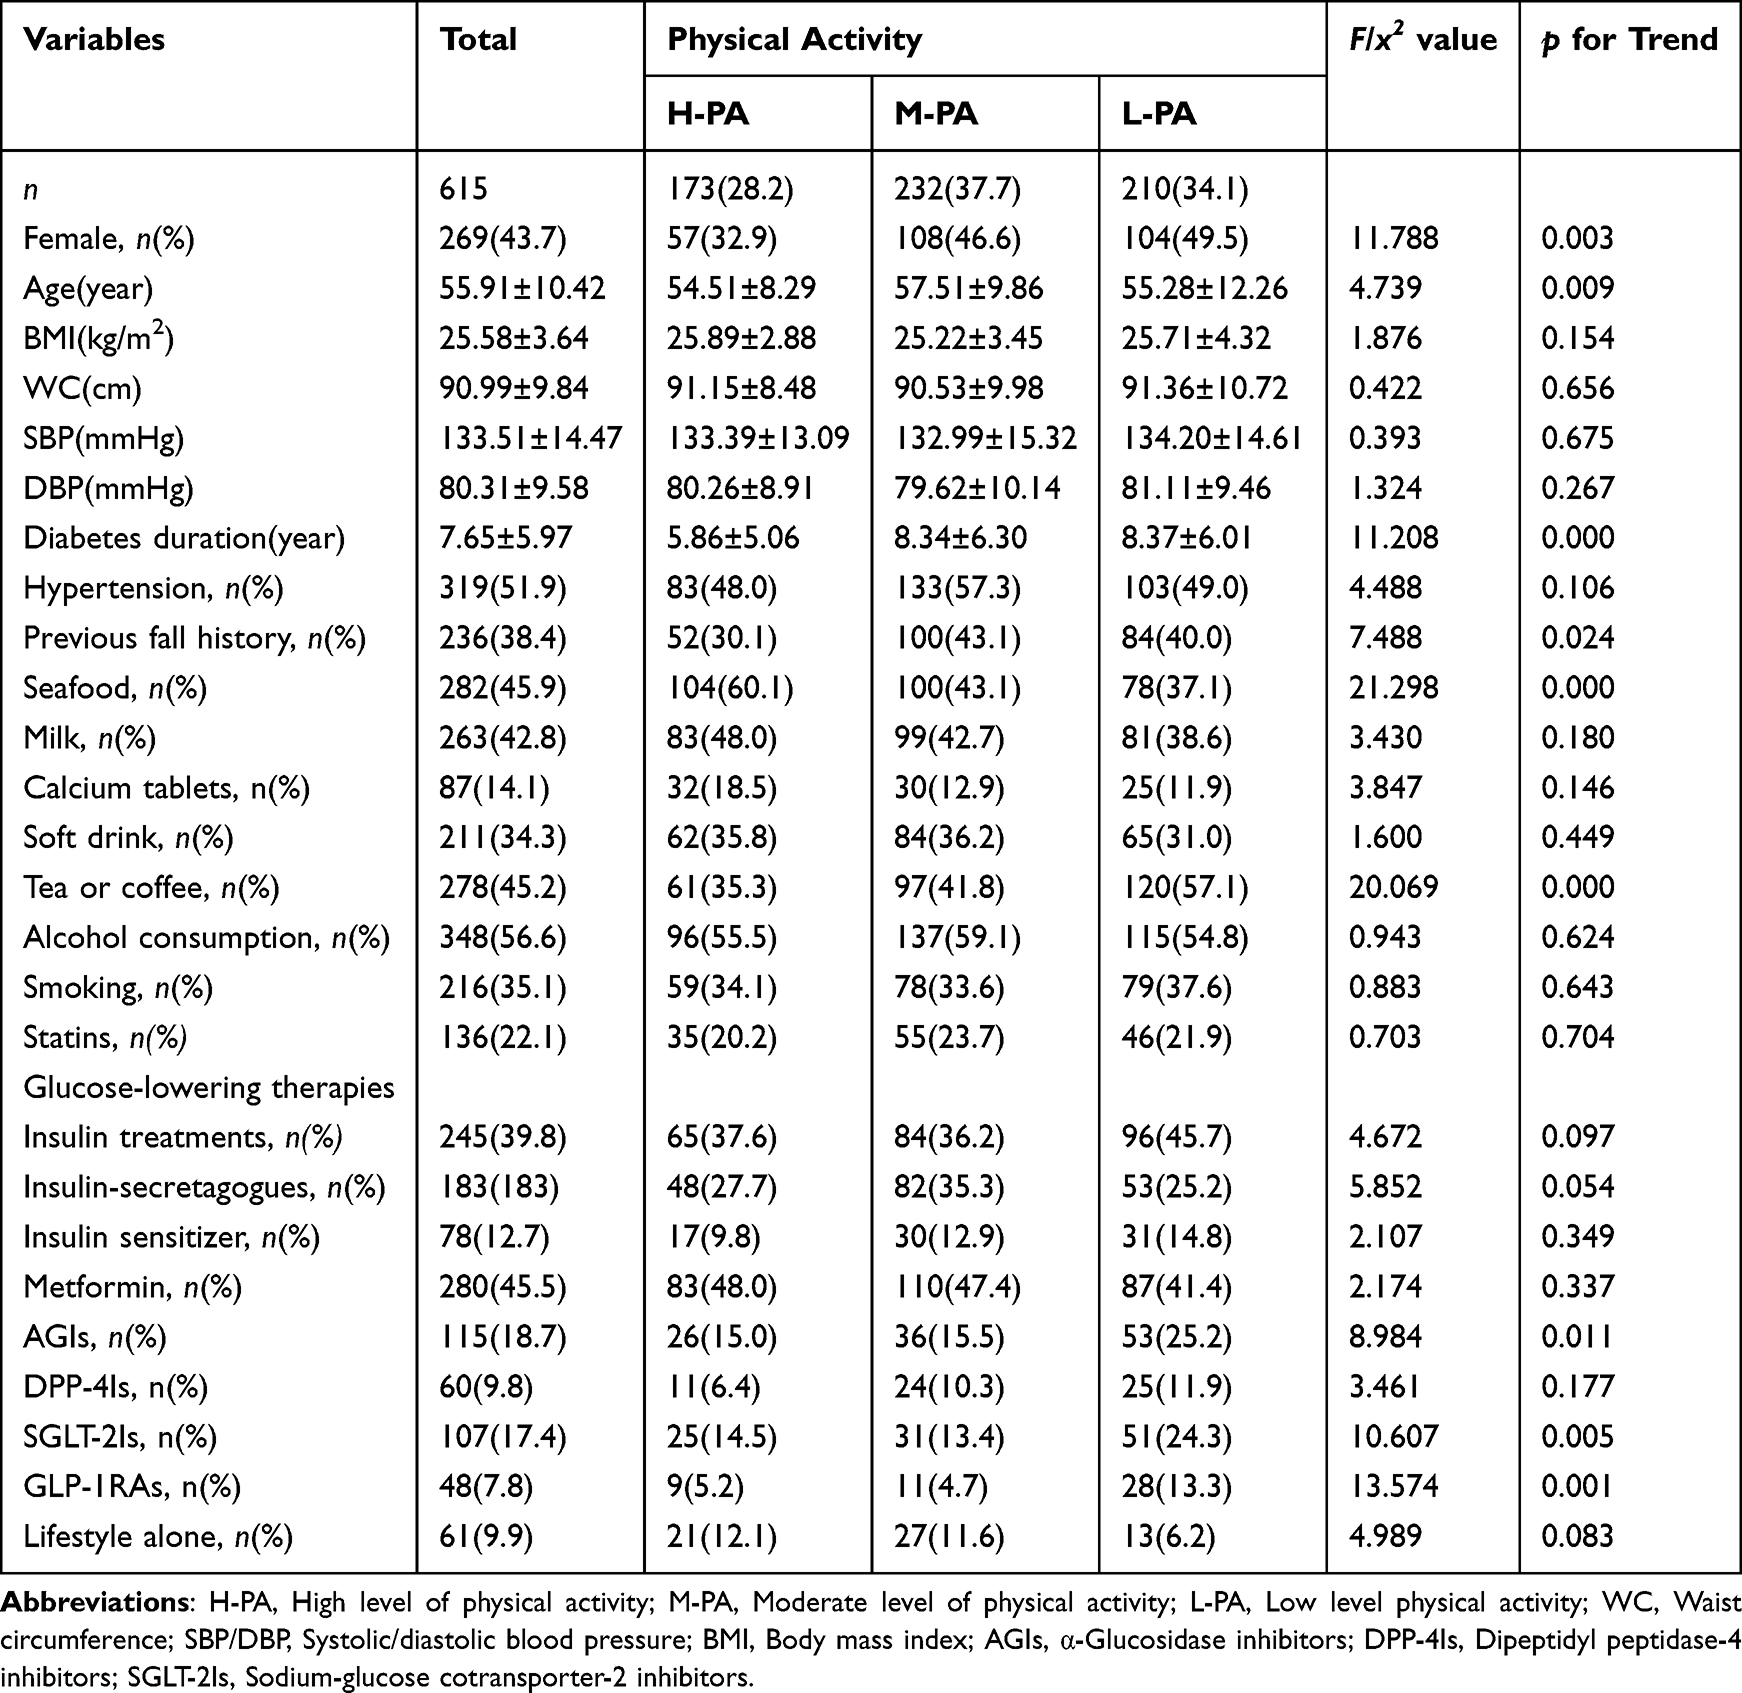 |
Table 1 Comparison of Basic Data Among Subgroups of Physical Activity Level |
Table 2 shows the differences in biochemical indices and body composition parameters among the three subgroups after grouping by physical activity. The β-CTX, TP1NP, HbA1c, B-FAT and T-FAT were significantly greater (p<0.05), and the 25(OH)D, LSBMD, FNBMD, HBMD, TBMD, and ASMI were significantly lower (p<0.001) with decreasing physical activity. However, in terms of lipids, lnHOMA-IR and lnHOMA-β did not significantly differ (p>0.05). In contrast, Figure 1 presents the comparison of bone mineral density, muscle, and fat parameters across tertiles of physical activity levels in Table 2 as a scatter plot.
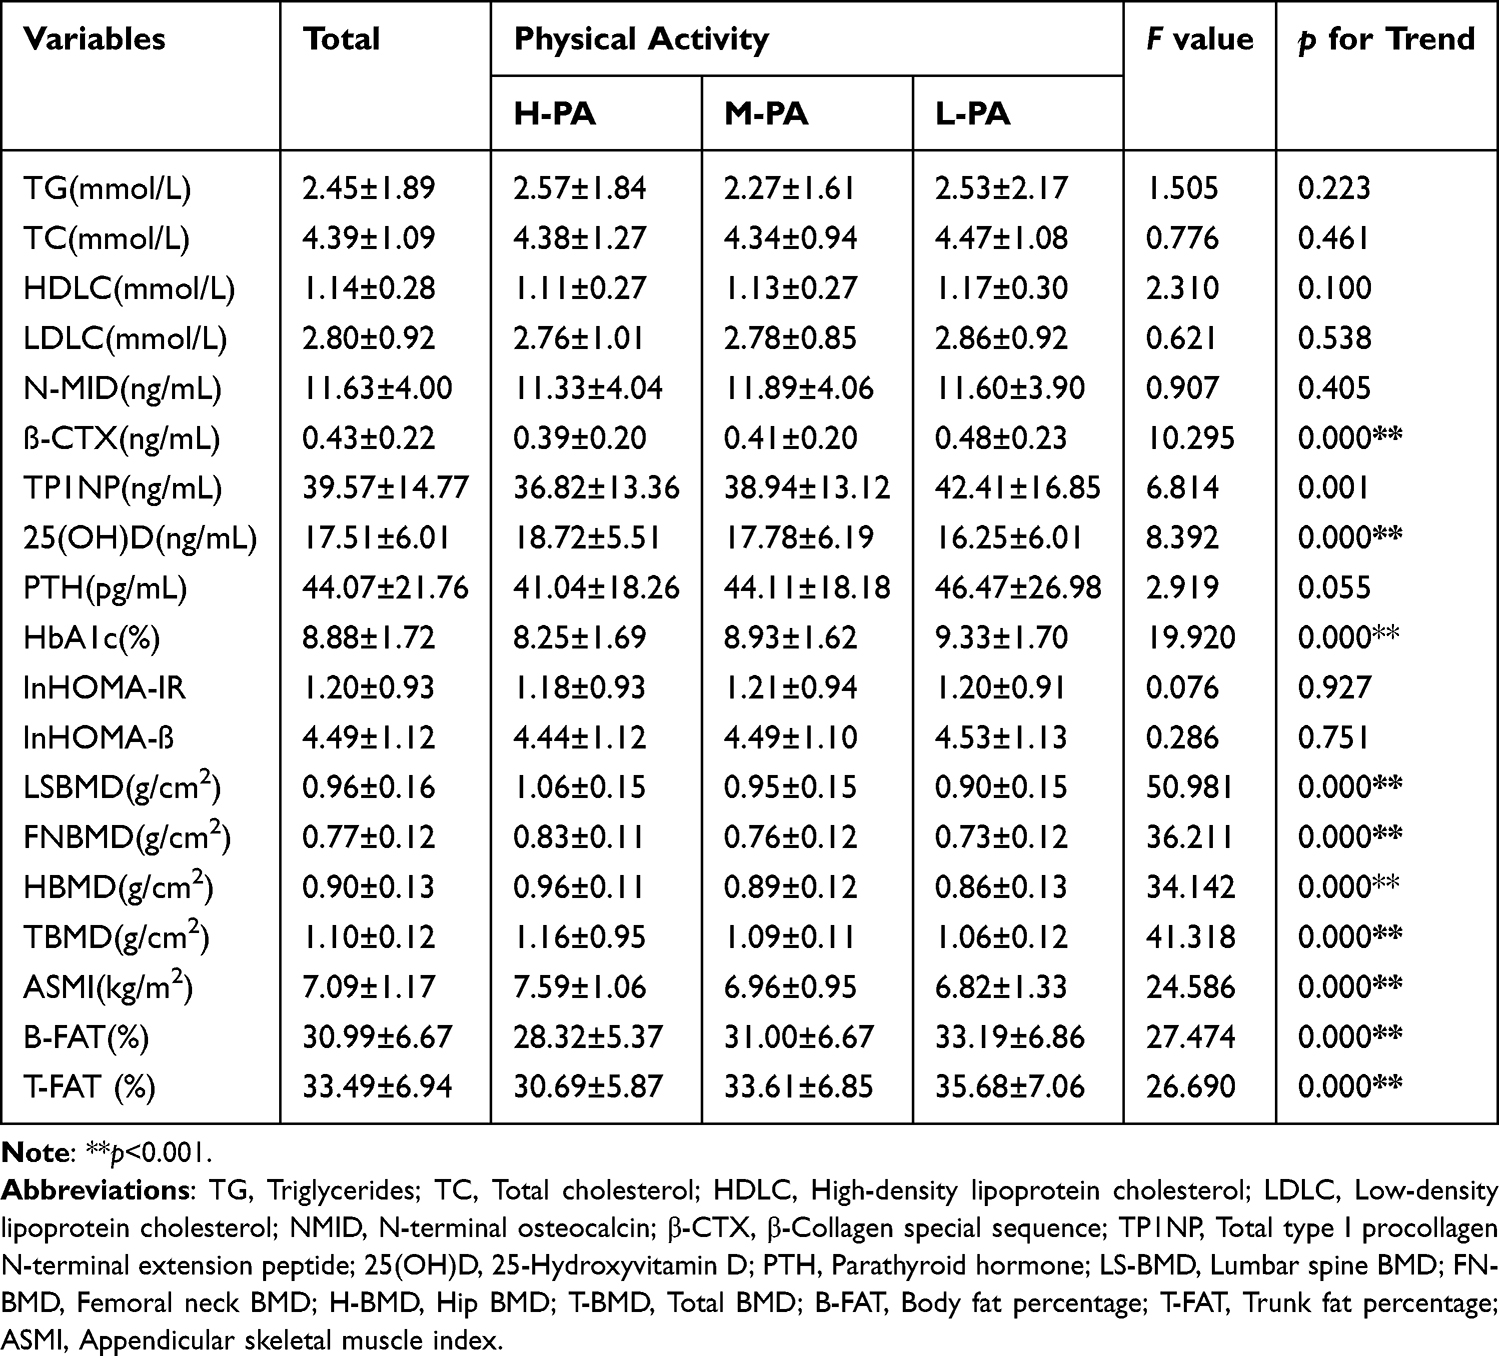 |
Table 2 Comparison of Biochemical Indexes and Body Composition Parameters of Physical Activity Level Among Subgroups |
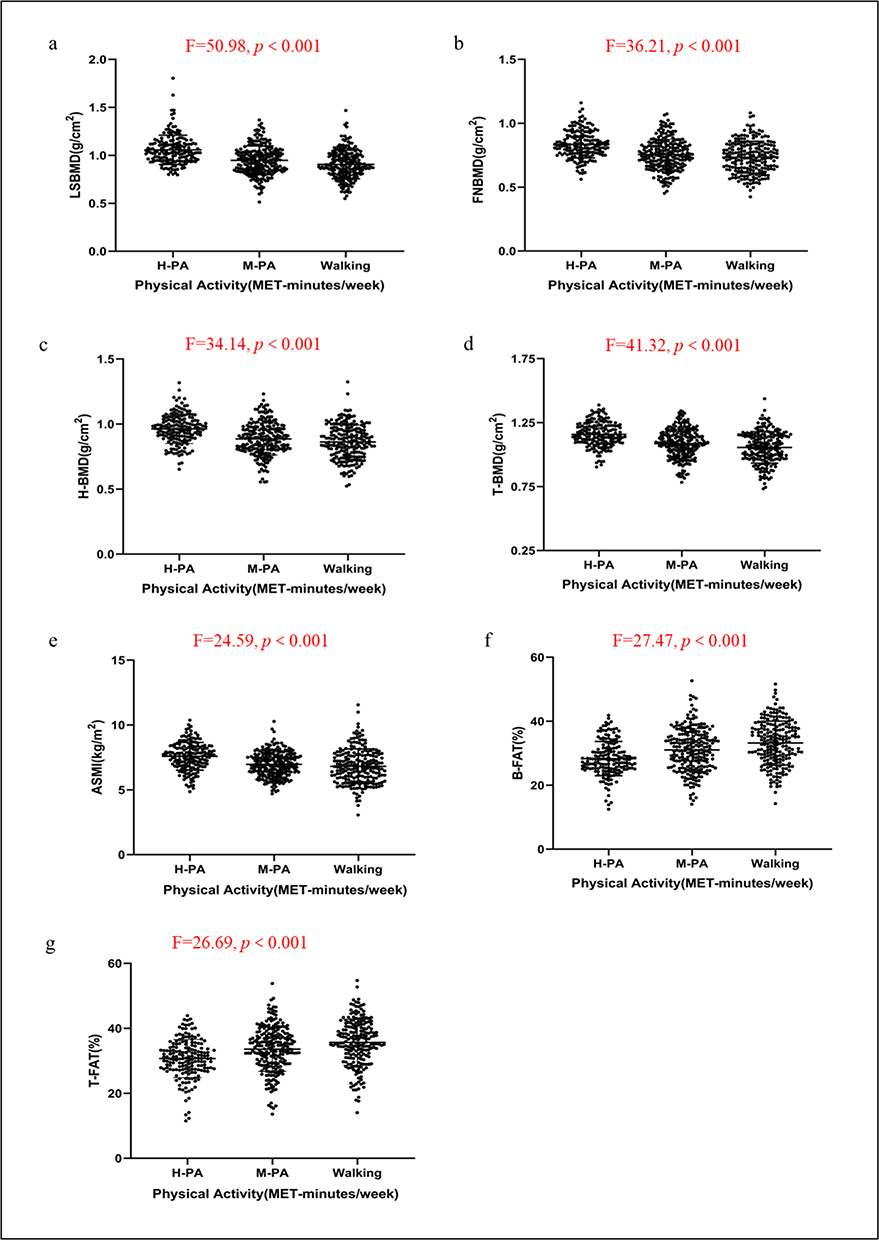 |
Figure 1 Scatter plots of body composition indices in three subgroups with high level of physical activity(H-PA), moderate level of physical activity(M-PA) and Walking. (a) lumbar spine bone mineral density (LSBMD); (b) femoral neck bone mineral density (FNBMD); (c) hip bone mineral density (H-BMD); (d) total bone mineral density (T-BMD); (e) appendicular skeletal muscle index (ASMI); (f) body fat pertencage (B-FAT); (g) trunk fat pertencage (T-FAT). |
Table 3 shows that the total physical activity level of 2708 (2033, 3674) MET-min/w was significantly greater in males than in females (p<0.001); however, for moderate-intensity physical activity, the physical activity level was significantly greater in females than in males (p=0.026). Similarly, the average sedentary time per day in the total population was 6.76 ± 2.08 h, with females spending more time sedentary per day than males (t = −3.557, p<0.001). Similarly, in terms of body composition parameters, both bone density and muscle content were significantly greater in men than in women, while the opposite was true for fat content (p<0.001).
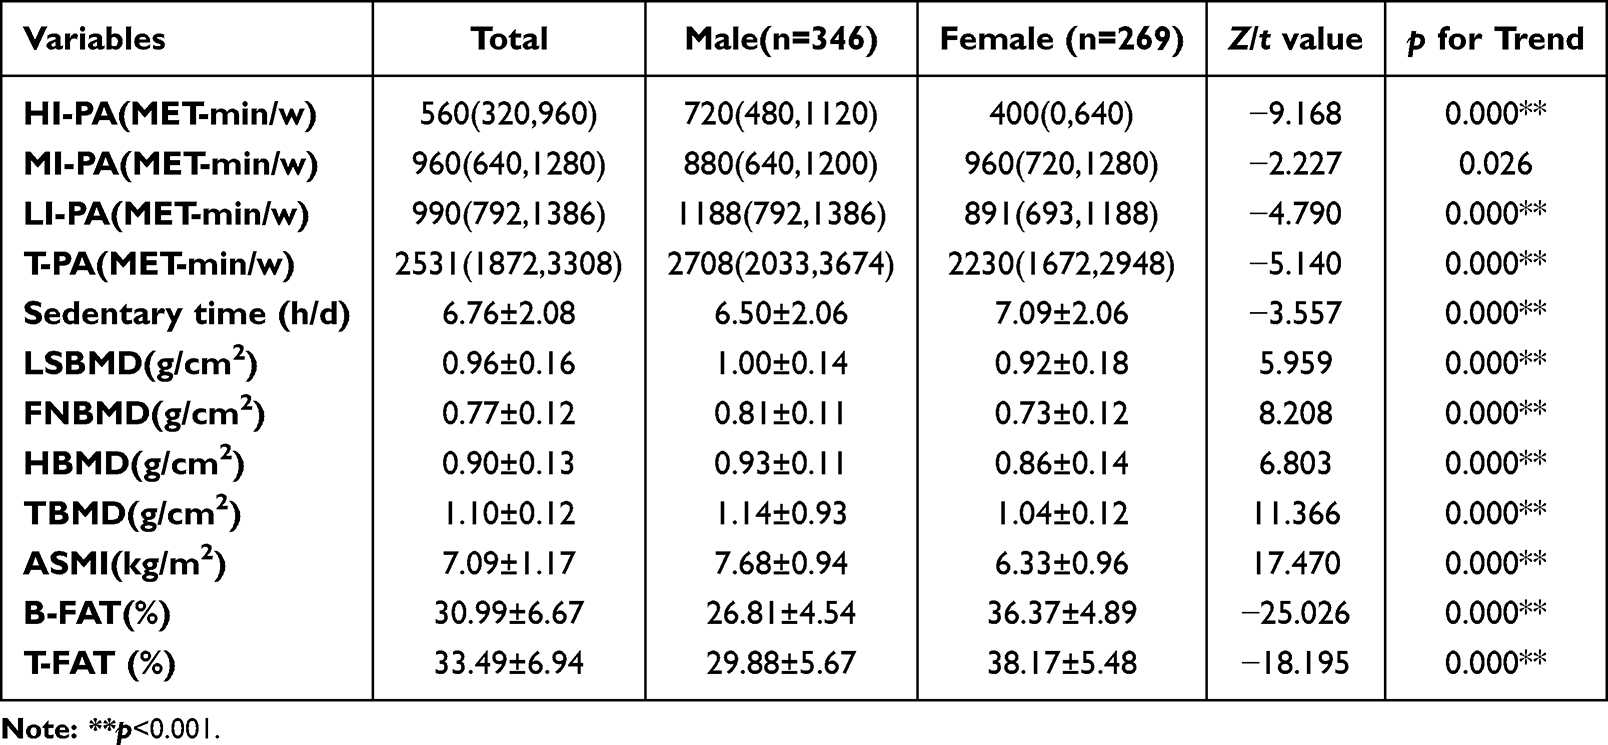 |
Table 3 Comparison of Physical Activity Level, Sedentary Time and Body Composition Parameters in Different Sex Patients |
Table 4 categorizes 615 type 2 diabetic patients according to age group criteria. Specifically, high-intensity and moderate-intensity physical activity, as well as overall activity levels, were greater in T2D patients aged 45–59 years than in patients in other age groups (p<0.05); in terms of body composition parameters, bone mineral density progressively decreased with patient age (p<0.01), whereas there was no significant difference between the B-FAT and T-FAT groups (p> 0.05).
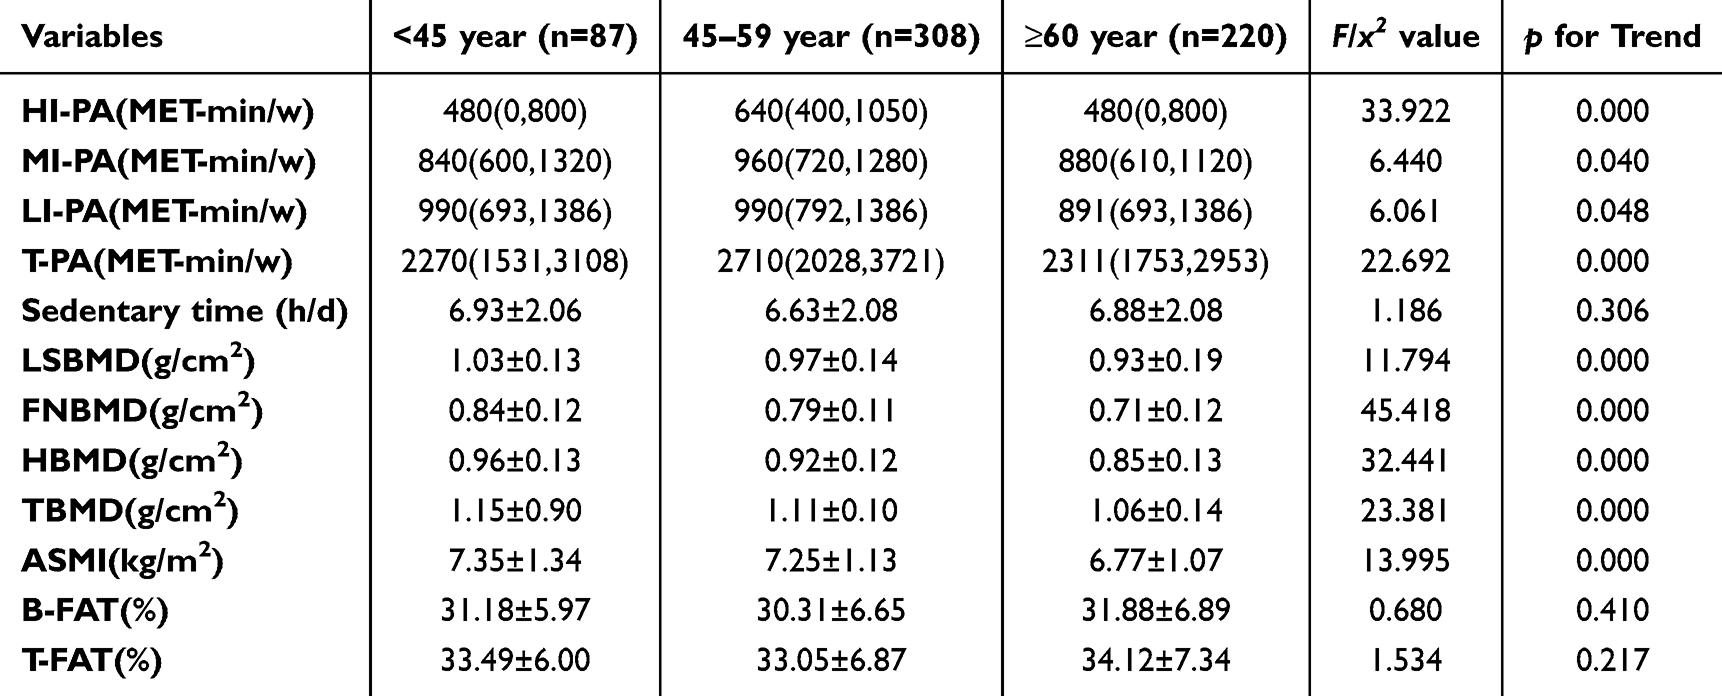 |
Table 4 Comparison of Physical Activity Level, Sedentary Time and Body Composition Parameters in Different Age Groups |
Mean Differences in Body Composition Parameters Among the Three Physical Activity Groups
Tables 5 and 6 compare the mean differences in BMD, muscle and fat mass between M-PA and L-PA patients by stepwise correction for confounders, using H-PA as a reference (B [95% CI]). After correcting for patients’ general information, lifestyle information, biochemical indices, and sedentary duration, the mean differences in LSBMD, FNBMD, HBMD, TBMD, ASMI, B-FAT, and T-FAT between the H-PA and L-PA groups were −0.098 (−0.136 to −0.061) g/cm2, −0.048 (−0.075 to −0.021) g/cm2, −0.063 (−0.090 to −0.035) g/cm2, −0.035 (−0.060 to −0.009) g/cm2, −0.178 (−0.327 to −0.029) kg/m2, 1.487 (0.587 to 2.386)%, and 1.905 (0.785 to 3.026)%, respectively. Physical activity levels were independently and positively correlated with LSBMD, FNBMD, HBMD, TBMD, and the ASMI and independently and negatively correlated with the B-FAT and T-FAT in T2D patients.
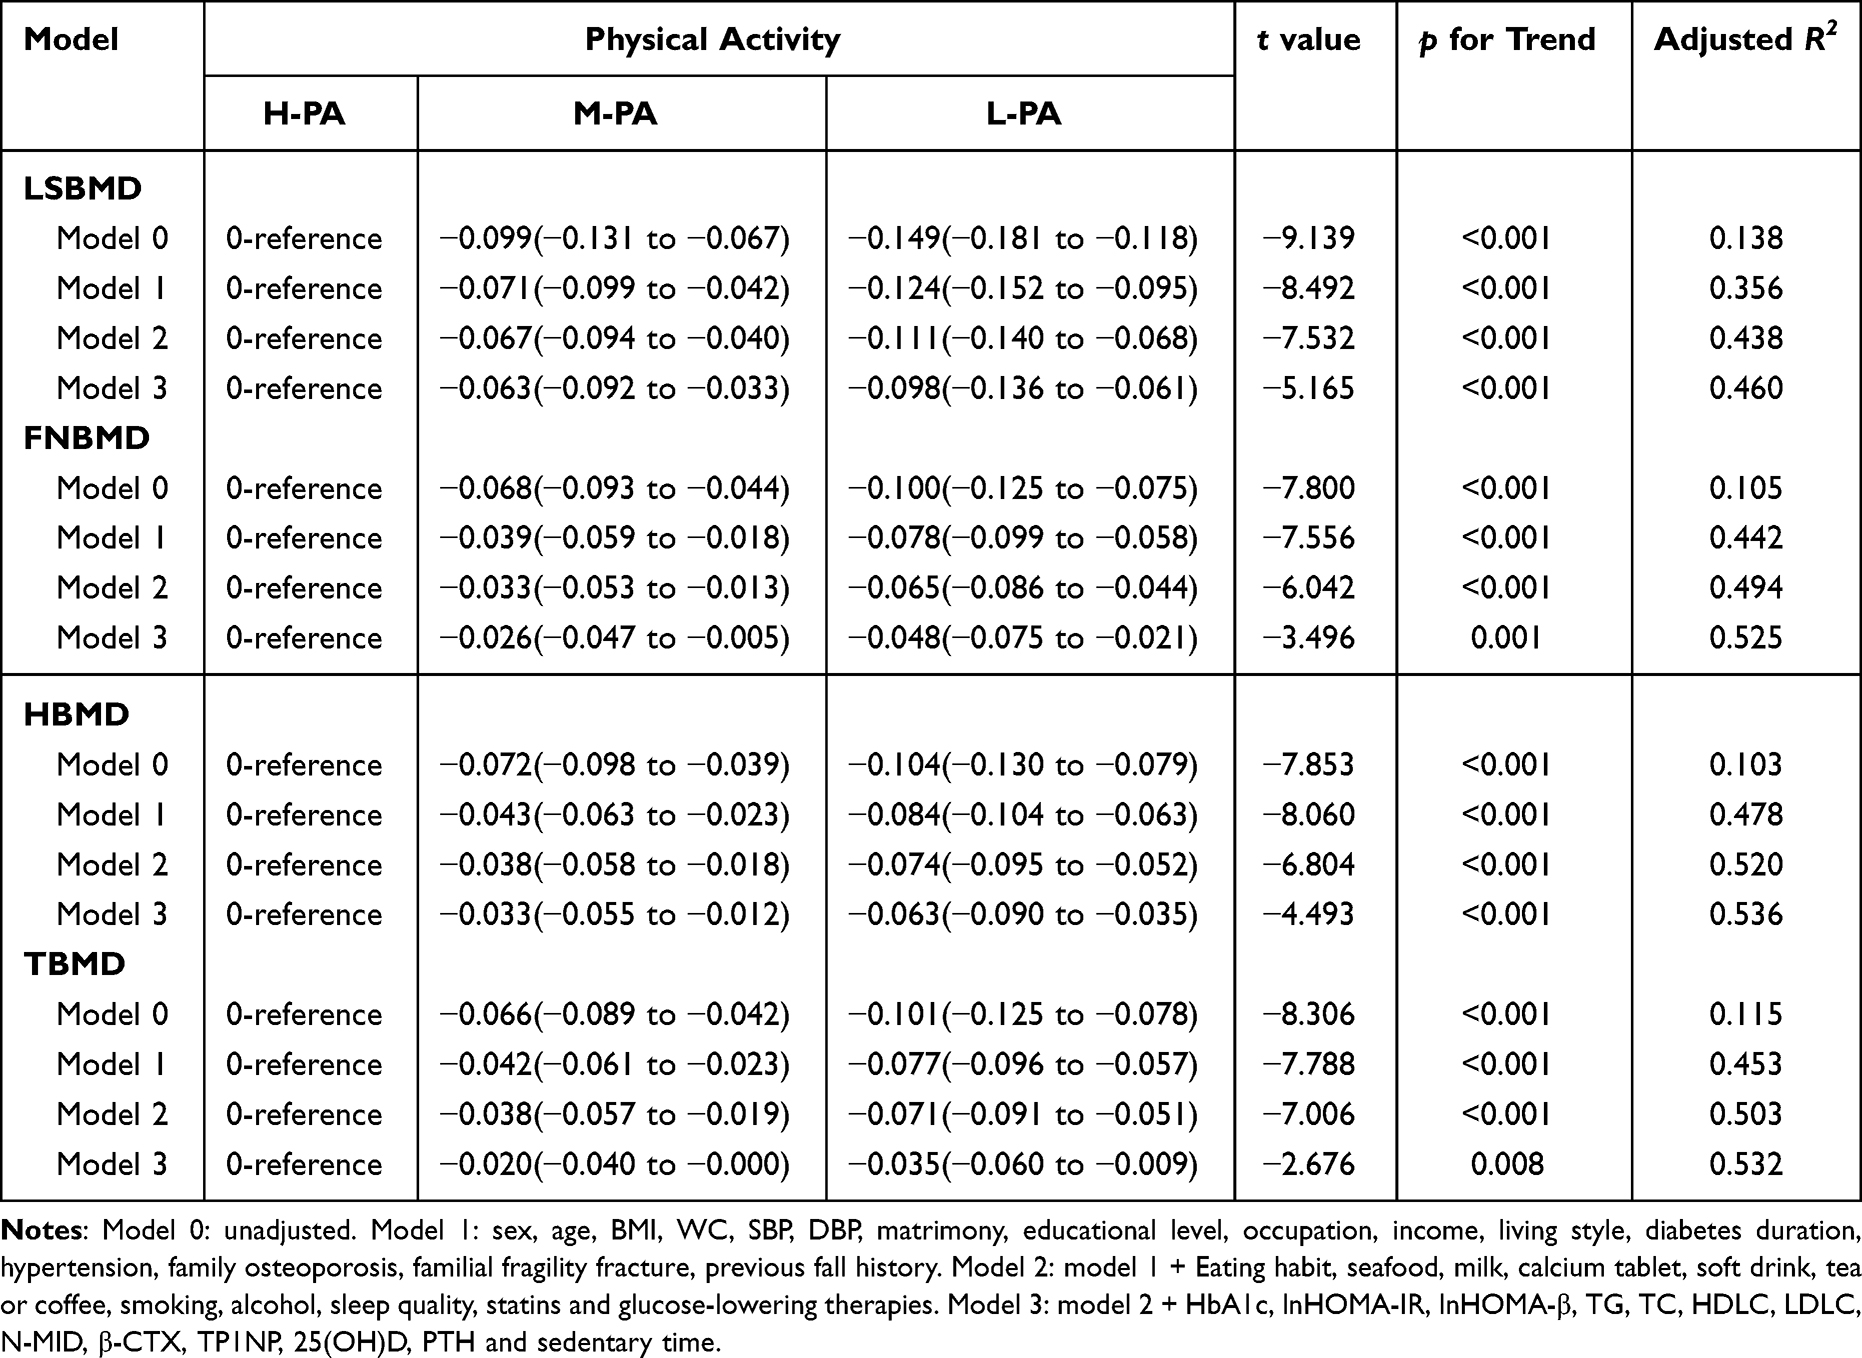 |
Table 5 Mean Difference in Bone Mineral Density Between Subgroups at the Physical Activity Level (B[95% CI]) |
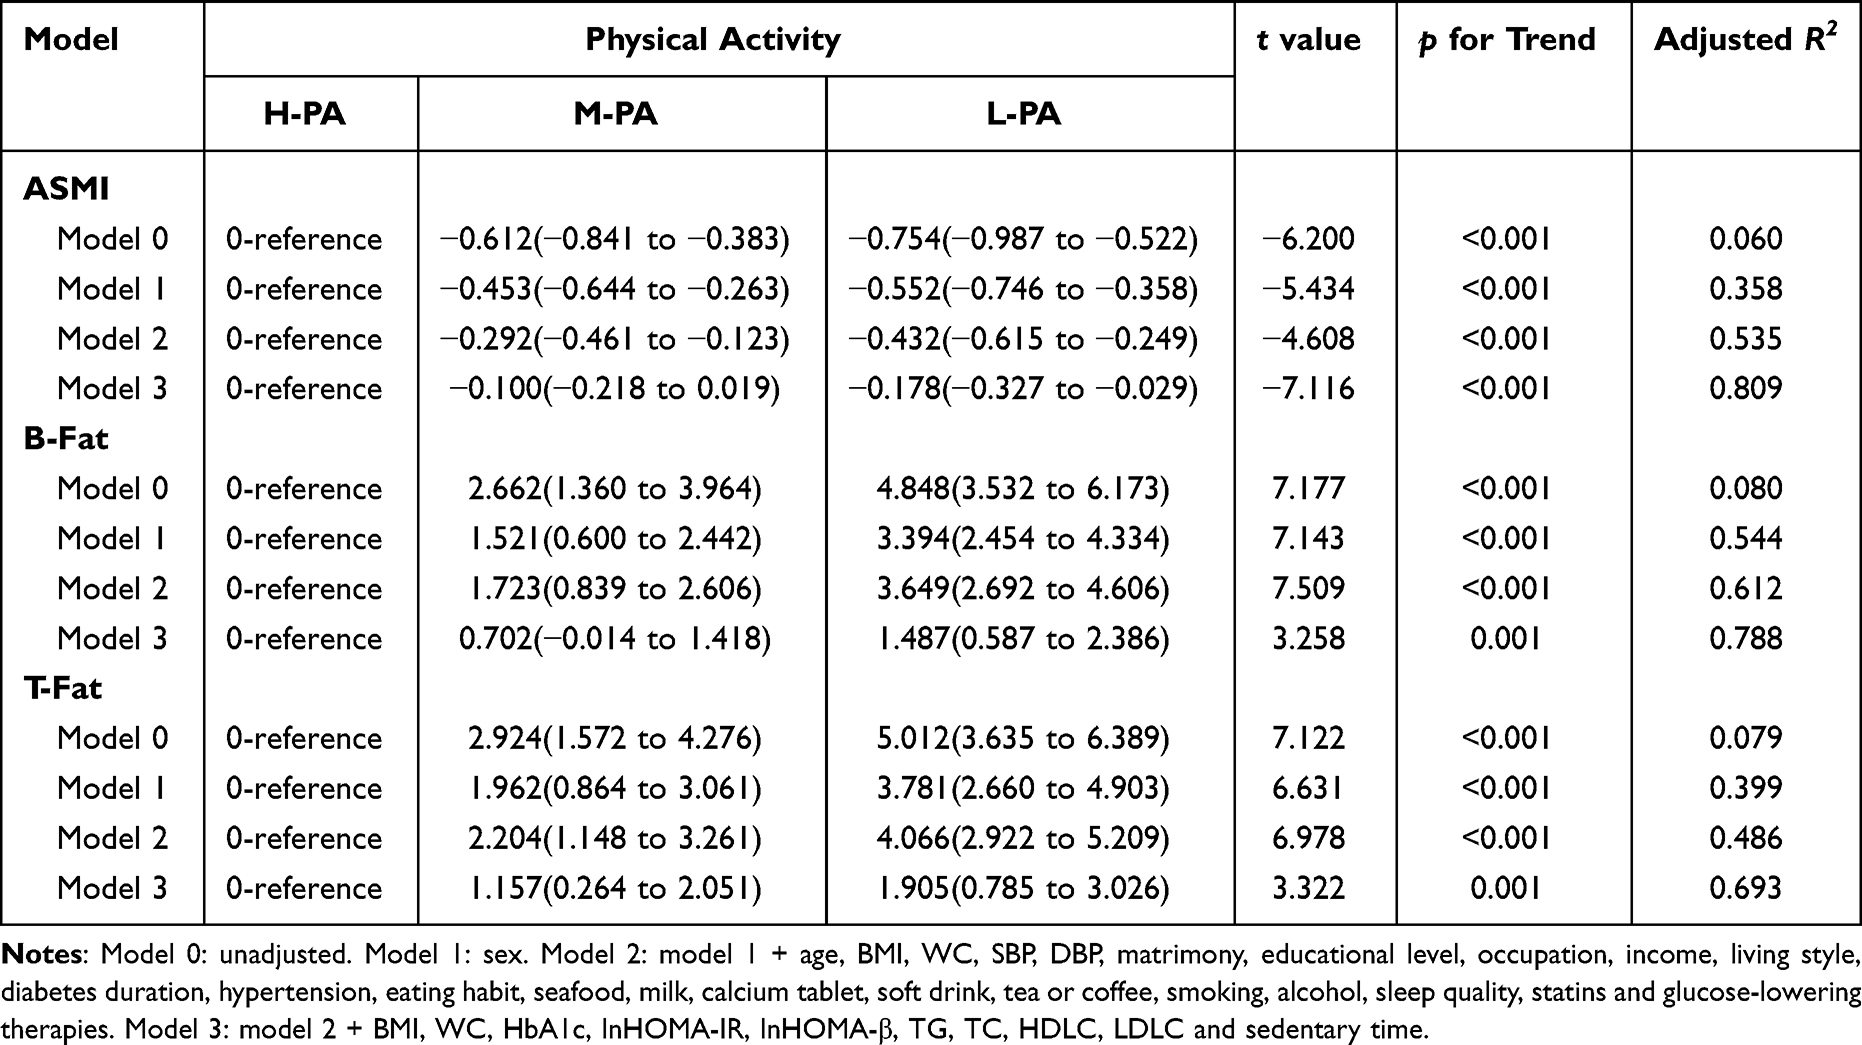 |
Table 6 Mean Differences in Physical Activity Levels of Skeletal Muscle and Fat Between Subgroups (B[95% CI]) |
Discussion
In this study, the total physical activity level of the 615 study subjects was 2531 (1872, 3308) MET-minutes/week. Among the different levels of physical activity, high, medium and low accounted for 28.2%, 37.7% and 34.1%, respectively, of the total number of study subjects. Patients with T2D are mostly characterized by a low level of physical activity, and there is insufficient physical activity.20
Studies have proven that physical inactivity is a risk factor for lower bone density. A lack of physical activity leads to a reduction in direct stimulation of bone tissue, muscle pulling, and muscle vibration, which reduces bone loading and affects bone strength and bone biomechanical properties.21 Primary osteoporosis markers (β-CTX and TP1NP) as well as HbA1c were significantly greater (p<0.05), and secondary osteoporosis markers 25(OH)D and BMD parameters (LSBMD, FNBMD, HBMD, and TBMD) were significantly lower (p<0.001) with decreasing physical activity levels in this study; even after adjusting for confounders, the relationship remained after adjustment for confounders. Studies have confirmed that various forms of physical activity has positive effect on big rotor and femoral neck bone mineral density, the biggest benefit of lumbar spine.22 Studies have shown that as type 2 diabetic patients age, inflammatory factor and oxidative stress products increase in the body, prolong the duration of the disease, leading to insufficient insulin secretion, decreased synthesis of osteoblast nucleosides and collagen, and decreased calcium content in the bones.23 In the present study, the bone mineral density decreased significantly (p<0.001) as the age of the study subjects increased. More than one-third of them were elderly people for whom walking was an acceptable exercise, had a low risk of accidents, and could be practiced in a variety of settings throughout the year, as opposed to high-intensity or moderate-intensity physical activity. Walking or jogging to achieve high enough mechanical stress to create a counterforce that stimulates the bones is effective in maintaining BMD levels.24 In this study, women had significantly lower BMD levels than men did (p<0.001). For perimenopausal and postmenopausal women, a dramatic decrease in estrogen levels in the body affects osteoblast proliferation and collagen synthesis, predisposing them to high-transformation osteoporosis.25 In women older than 50 years of age in the United States, 30 minutes of low-intensity physical activity was associated with a 12% lower risk of lumbar spine osteoporosis than was sedentary activity.26 Therefore, it is recommended that older women with T2D be encouraged to engage in multiple forms of low-intensity physical activity to ensure that their BMD increases or at least remains unchanged.27
With the progression of T2D, the body’s skeletal muscle function and muscle mass gradually decrease, and the prevalence of sarcopenia is much greater than that in the nondiabetic population.28 Studies have shown that stimulating skeletal muscle through exercise can effectively improve muscle mass and strength and is an effective way to treat sarcopenia.29,30 The skeletal muscle content of the extremities decreased significantly (p<0.001) as the level of physical activity decreased in this study. After correcting for age, sex, and sedentary duration, physical activity level remained an independent influence on limb skeletal muscle mass (95% CI: −0.327 to −0.029). Exercise of various intensities has been proven to improve myocyte mass and muscle protein synthesis; high-intensity resistance exercise has more prominent advantages in improving muscle mass and muscle function31,32 and is currently the most effective intervention for the treatment of diabetic sarcopenia.33 Liao34 conducted a 12-week intervention study in which elastic band resistance training was used in elderly women with muscle loss. An intervention study revealed an increase in total skeletal muscle mass and significant beneficial effects on muscle mass and physical function in the intervention group. Resistance exercise in patients with diabetes mellitus combined with sarcopenia was effective at increasing skeletal muscle type II fibers and reducing skeletal muscle cell apoptosis.31 Additionally, aerobic exercise is an effective intervention for improving skeletal muscle mass in the body. In a Japanese study, 42 patients with T2D were treated with aerobic exercise (aerobics) twice a day, and the rate of decrease in skeletal muscle mass index in the intervention group (46.7%) was significantly lower than that in the control group (85.2%) compared with that in the control group that did not perform the exercise, which effectively prevented the decrease in skeletal muscle mass.35
The prevalence and growth rate of overweight and obesity in China are the highest in the world.36 In this study, the average BMI of the 615 T2D patients was 25.61±3.67 kg/m2, the average waist circumference was 91.02±9.82 cm, the body fat content reached 30.99±6.67%, and the trunk fat content was also high. Overall, these patients reached the level of overweight or even obesity, reflecting the general phenomenon of overweight or obesity in T2D patients. Insufficient physical activity reduces the body’s energy consumption, which increases lipid deposition in the body and decreases insulin secretion. Exercise, on the other hand, can improve insulin secretion by decreasing adipokines and thus improving insulin secretion.37 High-intensity physical activity promotes rapid glucose uptake and improves insulin resistance; long-term exercise training improves mitochondrial function and increases the expression of metabolic genes such as glucose transporter proteins.38 In this study, the insulin resistance indices of the study subjects were high, and one-way ANOVA showed that as physical activity decreased, body fat content and trunk fat content increased significantly, while glycated hemoglobin (HbA1c) levels increased significantly (p<0.001); after correcting for various confounders, a decrease in physical activity was found to be an independent risk factor. An increasing number of studies have confirmed that physical activity is one of the most important measures for treating abnormalities in lipid metabolism. Various physical activities increase the body’s energy expenditure and reduce body weight, fasting insulin levels, and triglyceride (TG) synthesis in the liver.39 A meta-analysis that included 48 studies indicated that among 2990 participants with at least three metabolic syndromes, the group that performed moderate-intensity aerobic exercise training showed significant improvement in lipid metabolism; reductions in TG, TC, and LDLC; and an increase in HDLC.40 In the present study, none of the differences in lipid metabolism-related indices (TG, TC, HDLC, LDLC) were significantly different among the physical activity subgroups (p>0.05). This may be related to the use of GLP-1 receptor agonists in diabetic patients. Multiple studies have shown that GLP-1-receptor agonists promote weight loss. A network meta-analysis comparing the efficacy of different drugs for weight loss on the basis of 143 RCTS included suggests that GLP-1 receptor agonists can effectively promote weight loss of more than 5% on the basis of lifestyle management, which is superior to orlistat, SGLT2i, and metformin.41 It also improves blood sugar and lowers blood pressure and total cholesterol levels.42 But the TG concentration was greater than the normal value (2.45±1.89) mmol/L, which may be related to the dietary tastes of the participants in the study and dietary combinations.
Limitations
In this study, the population evaluated was representative of patients with type 2 diabetes, which limits the generalizability of the study to some extent. This study is only a cross-sectional study, and long-term follow-up can be further conducted in the future to pay attention to the dynamic change process of population composition.
Conclusions
Physical inactivity is an independent influence on body composition changes in patients with T2D; the less physically active and the more sedentary the person is, the lower the bone density, the less skeletal muscle content, and the more fat content. In the future, intervention studies can be further carried out for patients with type 2 diabetes mellitus, such as insufficient physical activity and sedentary lifestyle, to guide screening and control the occurrence of secondary complications such as osteoporosis, sarcopenia and obesity in patients with type 2 diabetes mellitus, and to improve the quality of life.
Abbreviations
T2D, Type 2 diabetes; PA, Physical activity; H-PA, High level of physical activity; M-PA, Moderate level of physical activity; L-PA, Low level physical activity; HI-PA, High intensity physical activity; MI-PA, Moderate intensity physical activity; LI-PA, Low intensity physical activity; DXA, Dual energy X-ray absorptiometry; B-FAT, Body fat percentage; T-FAT, Trunk fat percentage; ASMI, Appendicular skeletal muscle index; BMD, Bone mineral density; LS-BMD, Lumbar spine BMD; FN-BMD, Femoral neck BMD; H-BMD, Hip BMD; T-BMD, Total BMD; WC, Waist circumference; SBP/DBP, Systolic/diastolic blood pressure; BMI, Body mass index; AGIs, α-Glucosidase inhibitors; DPP-4Is, Dipeptidyl peptidase-4 inhibitors; SGLT-2Is, Sodium-glucose cotransporter-2 inhibitors; ANOVA, One-way analysis of variance; TG, Triglycerides; TC, Total cholesterol; HDLC, High-density lipoprotein cholesterol; LDLC, Low-density lipoprotein cholesterol; HbA1c, Glycosylated hemoglobin A1c; IR, Insulin resistance; HOMA-IR, Homeostasis model assessment of insulin resistance; lnHOMA-IR, Natural log-transformed HOMA-IR; NMID, N-terminal osteocalcin; β-CTX, β-Collagen special sequence; TP1NP, Total type I procollagen N-terminal extension peptide; 25(OH)D, 25-Hydroxyvitamin D; PTH, Parathyroid hormone; OP, Osteoporosis; DOP, Diabetic osteoporosis.
Funding
The authors were supported by the 14th Five-Year Key Disciplines of Nantong City, the Clinical Medical Research Center of Nantong Science and Technology Bureau (HS2022004), the research project of Nantong Health Commission (MSZ2023019), and the Clinical Medicine Special Research Fund of Nantong University (2023HZ001).
Disclosure
The authors have stated that they have no conflicts of interest in this work.
References
1. Pi-Sunyer X. Changes in body composition and metabolic disease risk. Eur J Clin Nutr. 2019;73(2):231–235. doi:10.1038/s41430-018-0320-x
2. Bowden Davies KA, Pickles S, Sprung VS, et al. Reduced physical activity in young and older adults: metabolic and musculoskeletal implications. Ther Adv Endocrinol Metab. 2019;10:2042018819888824. doi:10.1177/2042018819888824
3. Nomura T, Kawae T, Kataoka H, Ikeda Y. Aging, physical activity, and diabetic complications related to loss of muscle strength in patients with type 2 diabetes. Phys Ther Res. 2018;21(2):33–38. doi:10.1298/ptr.R0002
4. Küçükdiler AHE, Varlı M, Yavuz Ö, et al. Evaluation of oxidative stress parameters and antioxidant status in plasma and erythrocytes of elderly diabetic patients with sarcopenia. J nutr health aging. 2019;23(3):239–245. doi:10.1007/s12603-018-1137-y
5. Lihua N. Research progress of the diabetic osteoporosis. J Clin Pathol R Es. 2020;40(07):1897–1901. doi:10.3969/j.issn.1006-2084.2007.03.026
6. Colón-Emeric C, Whitson HE, Berry SD, et al. AGS and NIA bench-to bedside conference summary: osteoporosis and soft tissue (muscle and fat) disorders. J Am Geriatr Soc. 2020;68(1):31–38. doi:10.1111/jgs.16248
7. Wang R, Li XN. [Different adipose tissue depots and metabolic syndrome in human]. Sheng Li Xue Bao. 2017;69(3):357–365.
8. Goossens GH. The metabolic phenotype in obesity: fat mass, body fat distribution, and adipose tissue function. Obesity Facts. 2017;10(3):207–215. doi:10.1159/000471488
9. Dexin Z. Relationship between obesity, insulin resistance and blood lipid in patients with type 2 diabetes mellitus. Chin Med Guidelines. 2021;19(17):87–88. doi:10.15912/j.cnki.gocm.2021.17.040
10. Smith AD, Crippa A, Woodcock J, Brage S. Physical activity and incident type 2 diabetes mellitus: a systematic review and dose-response meta-analysis of prospective cohort studies. Diabetologia. 2016;59(12):2527–2545. doi:10.1007/s00125-016-4079-0
11. Tremblay MS, Aubert S, Barnes JD, et al. Sedentary behavior research network (sbrn) - terminology consensus project process and outcome. Int J Behav Nutr Phys Act. 2017;14(1):75. doi:10.1186/s12966-017-0525-8
12. Rodríguez-Gómez I, Mañas A, Losa-Reyna J, et al. Associations between sedentary time, physical activity and bone health among older people using compositional data analysis. PLoS One. 2018;13(10):e0206013. doi:10.1371/journal.pone.0206013
13. Tremblay MS, Colley RC, Saunders TJ, Healy GN, Owen N. Physiological and health implications of a sedentary lifestyle. Appl Physiol Nut. Metab. 2010;35(6):725–740. doi:10.1139/h10-079
14. Colberg SR, Albright AL, Blissmer BJ, et al. Exercise and type 2 diabetes: American College of Sports Medicine and the American Diabetes Association: joint position statement. Exercise and type 2 diabetes. Med Sci Sports Exercise. 2010;42(12):2282–2303. doi:10.1249/MSS.0b013e3181eeb61c
15. Alberti KG, Zimmet PZ. Definition, diagnosis and classification of diabetes mellitus and its complications. Part 1: diagnosis and classification of diabetes mellitus provisional report of a WHO consultation. Diabetic Med. 1998;15(7):539–553. doi:10.1002/(sici)1096-9136(199807)15:7<539::Aid-dia668>3.0.Co;2-s
16. Kangdi L, Jinshan Z, Yun Y, Longxi C, Jiajie M. Accuracy assessment and application of bone mineral density measured by dual-energy X-ray absorptiometry. Chin J Osteoporos. 2019;25(05):683–689.
17. The IPAQ group. IPAQ scoring protocol - international physical activity questionnaire[EB]. 2017. Available from: http://www.ipaq.ki.se/.
18. Mengyu F, Jun L, Pingping H. Chinese guidelines for data processing and analysis concerning the international physical activity questionnaire. Chin J Epidemiol. 2014;35(8):961–964. doi:10.3760/cma.j.issn.0254-6450.2014.08.019
19. Kim D, Kim KJ, Huh JH, et al. The ratio of glycated albumin to glycated haemoglobin correlates with insulin secretory function. Clin Endocrinol. 2012;77(5):679–683. doi:10.1111/j.1365-2265.2011.04312.x
20. branch TCmaodl. Chinese guidelines for the prevention and treatment of type 2 diabetes (2020). Chin J Diabetes Mellitus. 2021;13(4):315–409. doi: 10.3760/cma.j.cn115791-20210221-00095
21. Picke AK, Sylow L, Møller LLV, et al. Differential effects of high-fat diet and exercise training on bone and energy metabolism. Bone. 2018;116:120–134. doi:10.1016/j.bone.2018.07.015
22. Howe TE, Shea B, Dawson LJ, et al. Exercise for preventing and treating osteoporosis in postmenopausal women. Cochrane Database Syst Rev. 2011;(7):Cd000333. doi:10.1002/14651858.CD000333.pub2
23. Moayeri A, Mohamadpour M, Mousavi SF, Shirzadpour E, Mohamadpour S, Amraei M. Fracture risk in patients with type 2 diabetes mellitus and possible risk factors: a systematic review and meta-analysis. Ther Clin Risk Manag. 2017;13:455–468. doi:10.2147/tcrm.S131945
24. Kelley GA, Kelley KS, Kohrt WM. Effects of ground and joint reaction force exercise on lumbar spine and femoral neck bone mineral density in postmenopausal women: a meta-analysis of randomized controlled trials. BMC Musculoskelet Disord. 2012;13(1):177. doi:10.1186/1471-2474-13-177
25. Xu H, Wang Z, Li X, et al. Osteoporosis and osteopenia among patients with type 2 diabetes aged ≥50: role of sex and clinical characteristics. J Clin Densitom. 2020;23(1):29–36. doi:10.1016/j.jocd.2019.04.004
26. Ricci C, Gervasi F, Havemann Nel L, Smuts CM, Kruger SH, Leitzmann MF. Substitution of sedentary time with light physical activity is related to increased bone density in U.S. women over 50 years old. An ISO-temporal substitution analysis based on the national health and nutrition examination survey. Eur J Sport Sci. 2019;19(10):1404–1413. doi:10.1080/17461391.2019.1600588
27. Hopewell S, Adedire O, Copsey BJ, et al. Multifactorial and multiple component interventions for preventing falls in older people living in the community. Cochrane Database Syst Rev. 2018;7(7):Cd012221. doi:10.1002/14651858.CD012221.pub2
28. Scott D, de Courten B, Ebeling PR. Sarcopenia: a potential cause and consequence of type 2 diabetes in Australia’s ageing population? Med J Aust. 2016;205(7):329–333. doi:10.5694/mja16.00446
29. Romanello V, Sandri M. The connection between the dynamic remodeling of the mitochondrial network and the regulation of muscle mass. Cell Mol Life Sci. 2021;78(4):1305–1328. doi:10.1007/s00018-020-03662-0
30. Vlietstra L, Hendrickx W, Waters DL. Exercise interventions in healthy older adults with sarcopenia: a systematic review and meta-analysis. Australas J Ageing. 2018;37(3):169–183. doi:10.1111/ajag.12521
31. Saeterbakken AH, Bårdstu HB, Brudeseth A, Andersen V. Effects of strength training on muscle properties, physical function, and physical activity among frail older people: a pilot Study. J Aging Res. 2018;2018:8916274. doi:10.1155/2018/8916274
32. Šarabon N, Kozinc Ž, Löfler S, Hofer C. Resistance exercise, electrical muscle stimulation, and whole-body vibration in older adults: systematic review and meta-analysis of randomized controlled trials. J Clin Med. 2020;9(9):2902. doi:10.3390/jcm9092902
33. Jing L, Li Y, Rao L. Review of exercise interventions for patients with diabetes mellitus complicated with sarcopenia. J Nurs. 2021;36(04):105–108.
34. Liao CD, Tsauo JY, Huang SW, Ku JW, Hsiao DJ, Liou TH. Effects of elastic band exercise on lean mass and physical capacity in older women with sarcopenic obesity: a randomized controlled trial. Sci Rep. 2018;8(1):2317. doi:10.1038/s41598-018-20677-7
35. Kimura T, Okamura T, Iwai K, et al. Japanese radio calisthenics prevents the reduction of skeletal muscle mass volume in people with type 2 diabetes. BMJ Open Diabetes Res Care. 2020;8(1):e001027. doi:10.1136/bmjdrc-2019-001027
36. Wang YF, Sun MX, Xue H, et al. Understanding the China blue paper on obesity prevention and control and policy implications and recommendations for obesity prevention and control in China. Chi J Prev Med. 2019;53(9):875–884. doi:10.3760/cma.j.issn.0253-9624.2019.09.003
37. Magalhães JP, Santos DA, Correia IR, et al. Impact of combined training with different exercise intensities on inflammatory and lipid markers in type 2 diabetes: a secondary analysis from a 1-year randomized controlled trial. Cardiovasc Diabetol. 2020;19(1):169. doi:10.1186/s12933-020-01136-y
38. Stanford KI, Goodyear LJ. Exercise and type 2 diabetes: molecular mechanisms regulating glucose uptake in skeletal muscle. Adv Physiol Educ. 2014;38(4):308–314. doi:10.1152/advan.00080.2014
39. Thyfault JP, Rector RS. Exercise combats hepatic steatosis: potential mechanisms and clinical implications. Diabetes. 2020;69(4):517–524. doi:10.2337/dbi18-0043
40. Wood G, Taylor E, Ng V, et al. Determining the effect size of aerobic exercise training on the standard lipid profile in sedentary adults with three or more metabolic syndrome factors: a systematic review and meta-analysis of randomised controlled trials. Br J Sports Med. 2021. doi:10.1136/bjsports-2021-103999
41. Shi Q, Wang Y, Hao Q, et al. Pharmacotherapy for adults with overweight and obesity: a systematic review and network meta-analysis of randomised controlled trials. Lancet. 2022;399(10321):259–269. doi:10.1016/s0140-6736(21)01640-8
42. Vilsbøll T, Christensen M, Junker AE, Knop FK, Gluud LL. Effects of glucagon-like peptide-1 receptor agonists on weight loss: systematic review and meta-analyses of randomised controlled trials. BMJ. 2012;344(jan10 2):d7771. doi:10.1136/bmj.d7771
 © 2024 The Author(s). This work is published and licensed by Dove Medical Press Limited. The
full terms of this license are available at https://www.dovepress.com/terms.php
and incorporate the Creative Commons Attribution
- Non Commercial (unported, v3.0) License.
By accessing the work you hereby accept the Terms. Non-commercial uses of the work are permitted
without any further permission from Dove Medical Press Limited, provided the work is properly
attributed. For permission for commercial use of this work, please see paragraphs 4.2 and 5 of our Terms.
© 2024 The Author(s). This work is published and licensed by Dove Medical Press Limited. The
full terms of this license are available at https://www.dovepress.com/terms.php
and incorporate the Creative Commons Attribution
- Non Commercial (unported, v3.0) License.
By accessing the work you hereby accept the Terms. Non-commercial uses of the work are permitted
without any further permission from Dove Medical Press Limited, provided the work is properly
attributed. For permission for commercial use of this work, please see paragraphs 4.2 and 5 of our Terms.