")
Back to Journals » International Journal of Chronic Obstructive Pulmonary Disease » Volume 19
Differences in the Quantitative HRCT Characteristics of Patients with Asthma, COPD and Asthma–COPD Overlap and Their Relationships with Pulmonary Function
Authors Lu D , Yu H, Chen L, Lin J, Chen S, Huang Y
Received 17 May 2024
Accepted for publication 22 July 2024
Published 1 August 2024 Volume 2024:19 Pages 1775—1789
DOI https://doi.org/10.2147/COPD.S469956
Checked for plagiarism Yes
Review by Single anonymous peer review
Peer reviewer comments 3
Editor who approved publication: Dr Richard Russell
Dongzhu Lu,1,* Huapeng Yu,2,* Lichang Chen,3 Jinlan Lin,1 Shijie Chen,1 Yunjian Huang1
1Department of Thoracic Oncology, Clinical Oncology School of Fujian Medical University, Fujian Cancer Hospital, Fuzhou, People’s Republic of China; 2Department of Respiratory Medicine, Shenzhen Hospital, Southern Medical University, Shenzhen, People’s Republic of China; 3Department of Pulmonary and Critical Care Medicine, Zhujiang Hospital, Southern Medical University, Guangzhou, People’s Republic of China
*These authors contributed equally to this work
Correspondence: Yunjian Huang, Department of Thoracic Oncology, Clinical Oncology School of Fujian Medical University, Fujian Cancer Hospital, Fuzhou, People’s Republic of China, Tel +86 13805099580, Email [email protected]
Purpose: We compared pulmonary function indices and quantitative CT parameters of airway remodeling, air trapping, and emphysema in asthmatic patients and patients with COPD and asthma–COPD overlap (ACO) and explored their relationships with airflow limitation.
Patients and Methods: Patients with asthma (n=48), COPD (n=52), and ACO (n=30) and controls (n=54) who completed pulmonary function tests and HRCT scans were retrospectively enrolled in our study. Quantitative CT analysis software was used to assess emphysema (LAA%), airway wall dimensions (wall area (WA), luminal area (LA), and wall area percentage (WA%)), and air trapping ((relative volume change of − 860 HU to − 950 HU (RVC− 860 to-950) and the expiration-to-inspiration ratio of the mean lung density (MLDE/I))). Differences in pulmonary function and HRCT parameters were compared among the groups. Spearman correlation analysis and regression analysis were utilized to explore structure‒function relationships.
Results: The LAA% in COPD and ACO patients was significantly greater than that in asthmatic patients and controls. The WA% and WA in COPD and ACO patients were greater than those in controls, whereas the WA% and LA between asthmatic patients and controls reached statistical significance. The RVC− 860 to − 950 levels decreased in the following order: ACO, COPD, and asthma. RVC− 860 to − 950 independently predicted FEV1% in asthmatic patients; LAA% and MLDE/I in COPD patients; and LAA%, WA% and RVC− 860 to − 950 in ACO patients.
Conclusion: Comparable emphysema was observed in patients with COPD and ACO but not in asthmatic patients. All patients exhibited proximal airway remodeling. The bronchi were thickened outward in COPD and ACO patients but are thickened inward in asthmatic patients. Furthermore, air trapping in ACO patients was the most severe among all the groups. Indirect lung densitometry measurements might be more predictive of the degree of airflow limitation than direct airway measurements in obstructive airway diseases.
Keywords: asthma, COPD, asthma-COPD overlap, quantitative HRCT, structure-function relationship
Introduction
Asthma and COPD are both considered chronic heterogeneous inflammatory disorders of the airway with different risk factors, pathogenesis and clinical manifestations; however, distinguishing between these two conditions in the clinical setting is challenging and difficult. There is a significant proportion of overlap between the two airway diseases, features with increased reversibility and persistent airway limitations, which is called the asthma-COPD overlap (ACO), making the diagnosis more problematic. Currently, ACO involves two main clinical phenotypes: patients with COPD demonstrating features of asthma and patients with asthma who develop persistent airflow limitations after long-term tobacco smoking.1,2 Depending on the different diagnostic criteria and sample sizes used, previous studies have reported that anywhere from 12 to 55% of patients diagnosed with COPD or asthma have ACO.3–5 The evidence has shown that patients with ACO experience more impaired lung function, more comorbidities, more severe and frequent exacerbations, greater economic burdens and a greater risk of death than those with either asthma or COPD alone.1,6–8 In asthma, inflammation is principally mediated by T helper 2 (Th2) cells, whereas in COPD, it is mediated by T helper 1 (Th1) cells.9 However, patients with ACO have higher FeNO concentrations and DLCO%, more elevated blood eosinophil counts, and higher reversibility, suggesting a possible difference in the underlying T2 pathophysiology between these patients and COPD patients.10 Anti-inflammatory therapy with inhaled corticosteroids (ICSs) is the cornerstone of treatment for asthma patients. ICSs in combination with long-acting beta-agonists (LABAs) and/or long-acting muscarinic antagonists (LAMAs) are recommended for ACO patients, but a bronchodilator alone is not recommended.11,12 In contrast, the addition of ICSs to LABAs and/or LAMAs should be used only when COPD patients still experience frequent or severe exacerbation events despite adequate and suitable maintenance bronchodilator treatment.11 ICS-containing therapy can control the disease and reduce the rate of acute exacerbations and death in patients with chronic inflammatory airway disease, but inappropriate use of ICSs increases the risk of respiratory infections.12,13 Hence, distinguishing among the different obstructive airway diseases is crucial for developing individualized and effective clinical management strategies.
Although spirometry is essential for evaluating the severity of obstructive airway disease, this test reflects only abnormal changes in the whole lung and cannot directly reveal the distribution of diseased airways. Fortunately, as an increasingly widely used noninvasive imaging method, quantitative high-resolution computed tomography (qHRCT) allows visualization of the lung parenchyma and bronchus and qualitative and quantitative analyses of changes in lung densitometry and morphometry in patients with chronic airway disease through CT analysis software. To our knowledge, the majority of studies have focused on asthma and COPD, with few studies on ACO. Currently, the differences in morphology and lung density changes among the three chronic airway diseases and their relationships with lung function are unclear.
Therefore, in this study, we aimed to compare the morphometric and densitometric changes in the airways of patients with three chronic airway diseases, which were measured by HRCT. Furthermore, we explored the relationships between quantitative HRCT parameters and lung function indices to form a basis for better clinical differentiation of asthma, COPD and ACO.
Materials and Methods
Participants
We retrospectively enrolled 184 participants: 52 patients with COPD, 48 asthma patients, 30 patients with ACO and 54 control participants from outpatient clinics who underwent chest HRCT scans and pulmonary function tests (IOS tests and spirometry) between August 2017 and December 2021. COPD and asthma were diagnosed according to the GOLD guidelines14 and the Global Initiative for Asthma (GINA)15 respectively. ACO was diagnosed when patients fulfilled the criteria for COPD14 plus (1) asthma-related symptoms (wheezing, shortness of breath, chest tightness or cough); (2) persistent airflow limitation (postbronchodilatation or improvement in FEV1> 12% and > 200 mL from baseline values)12; and (3) a history of smoking ≥10 pack-years or comparable indoor/outdoor harmful smoke exposure. All patients were in stable condition (no patients received intravenous/oral glucocorticoid therapy, no patients had upper/lower respiratory infections and no patients had exacerbations in the month preceding enrollment). The control participants were recruited from among patients undergoing health physical examinations conducted in our hospital outpatient clinic. They were nonsmokers or ex-smokers; had no respiratory symptoms; and had no history of acute/chronic respiratory diseases, including COPD, asthma, or ACO, with normal pulmonary function and chest imaging.
Pulmonary Function Tests
We performed pulmonary function tests [including impulse oscillation (IOS) and spirometry] with a Jaeger Master Screen IOS-Jaeger (Germany). We measured the following parameters: FEV1/forced vital capacity (FEV1/FVC) (%), FEV1 (%pred), FVC (%pred), forced expiratory flow at 25% of the FVC (FEF25%) (%pred), forced expiratory flow at 50% of the FVC (FEF50%) (%pred) and FEF25-75% (%pred). FEF 50%, FEF 75% and FEF25-75% are indicators of small airway function, and when at least two of these three indicators are less than 65%pred, the patient is diagnosed with small airway dysfunction (SAD). In addition, IOS was performed according to current standard recommendation16 and was calibrated daily. The resistances at 5 Hz (R5) and 20 Hz (R20) reflect the total and central airway resistances, respectively, and the peripheral airway resistance is obtained from their difference (R5–R20). The reactance at 5 Hz (X5) and the area under the reactance curve (AX) are considered indices of elastic recoil and the resistance of the peripheral airways, respectively. A minimum of 3 measurements were performed for each participant.
HRCT Scans
HRCT scans were performed within 24 hours of the pulmonary function tests using a multidetector CT scanner. (Brilliance iCT, Philips Healthcare) with the following parameters: collimation at 128×0.625 mm; 120 kVp; 100 mAs; rotation time at 0.5 s; and pitch at 0.915. The bronchial images were reconstructed using a high-spatial frequency (bone) algorithm, and the ratio of emphysema was evaluated with a soft tissue algorithm. The right upper lobe apical segmental bronchus (RB1) was selected as the target bronchial tube for detailed analysis. The 4th- to 6th-generation airways of RB1 were identified and analyzed.
HRCT Data Analysis
Quantification of Emphysema, Air Trapping and Airway Wall Dimensions
T quantitative analysis software (Philips Healthcare) was used to assess emphysema, air trapping and airway wall dimensions. The three lung density parameters were calculated automatically: the % area of low attenuation (LAA%) (shown in Figure 1), the relative volume change from −860 HU to −950 HU (RVC−860 to −950) and the expiration-to-inspiration ratio of the mean lung density (MLDE/I) (shown in Figure 2). LAA% was defined as the percentage of low-attenuation areas below −950 Hounsfield units (HUs) on inspiratory CT, known as CT emphysema. RVC−860 to −950 and MLDE/I were calculated with the following formulas: RVC−860 to −950 = (relative lung volume −860 HU to −950 HU on expiratory CT%) − (relative lung volume −860 HU to −950 HU on inspiratory CT%);17 MLDE/I = (the expiratory mean lung density in HU)/(the inspiratory mean lung density in HU);18. The above two measurement values allowed for an indirect quantitative evaluation of air trapping and reflected peripheral airway obstruction regardless of the severity of emphysema, as shown in previous studies.17,19 We also measured and recorded the bronchial parameters (luminal area (LA), wall area (WA= TA (total area)-LA), and wall area percentage (WA%=WA/TA×100%)) from the 4th-6th generations of RB1 to evaluate the airway wall dimensions (shown in Figures 3 and 4). To balance the effects of BSA, WA/BSA and LA/BSA were calculated. These quantitative HRCT parameters were measured by two independent radiologists who were blinded to the participants’ clinical histories and diagnoses, and the final data for each measurement were obtained by consensus.
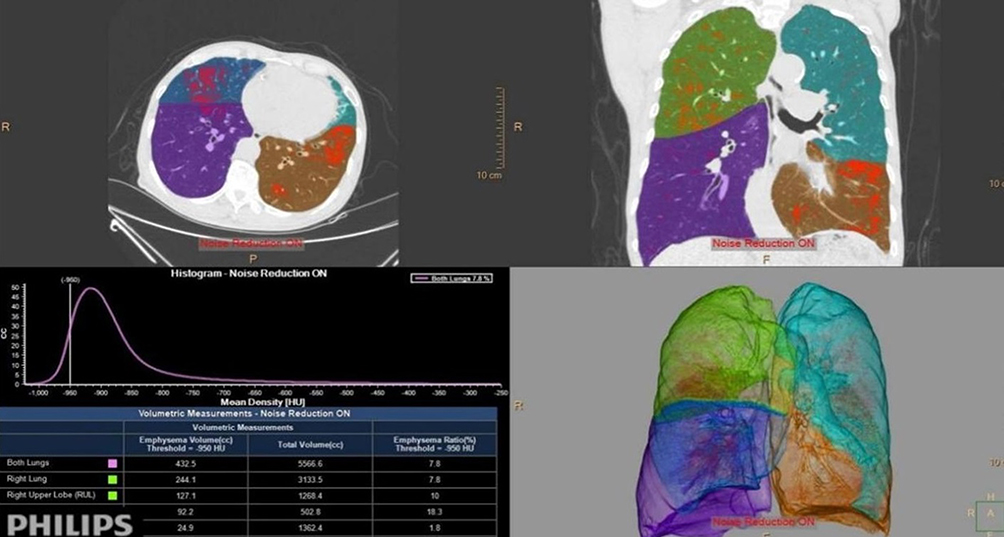 |
Figure 1 The measurement of emphysema by HRCT. |
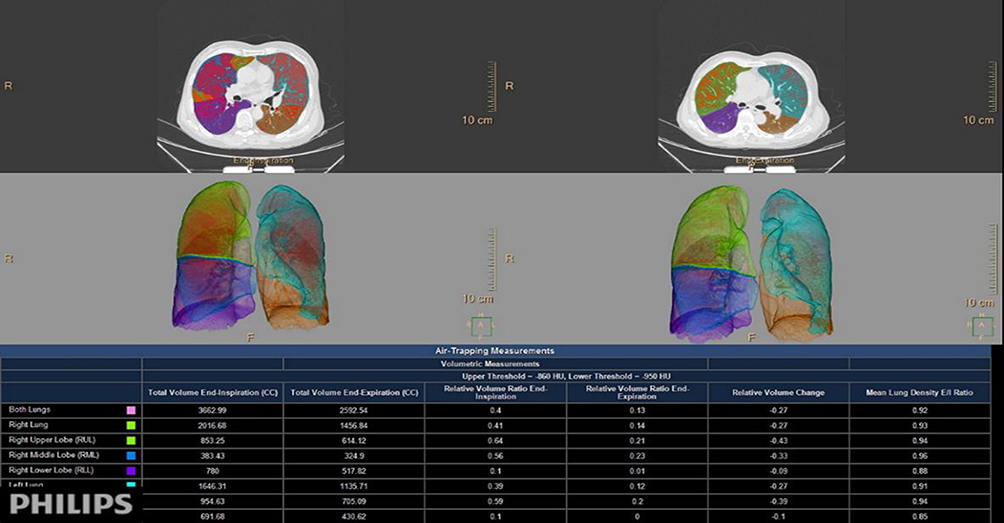 |
Figure 2 The measurement of air trapping by HRCT. |
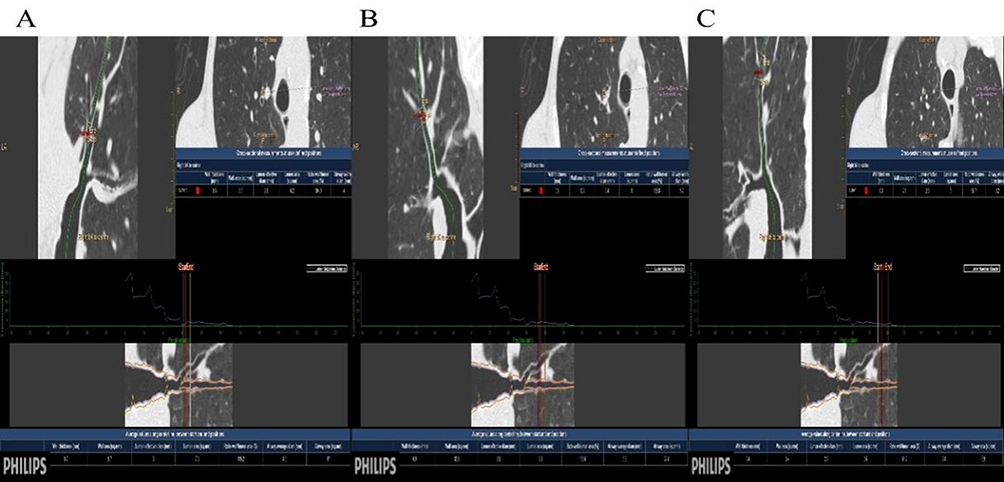 |
Figure 3 The measurement of airways by HRCT (4th-6th generation of RB1). (A) The airway measurement of 4th generation of RB1; (B) The airway measurement of 5th generation of RB1; (C) The airway measurement of 6th generation of RB1. |
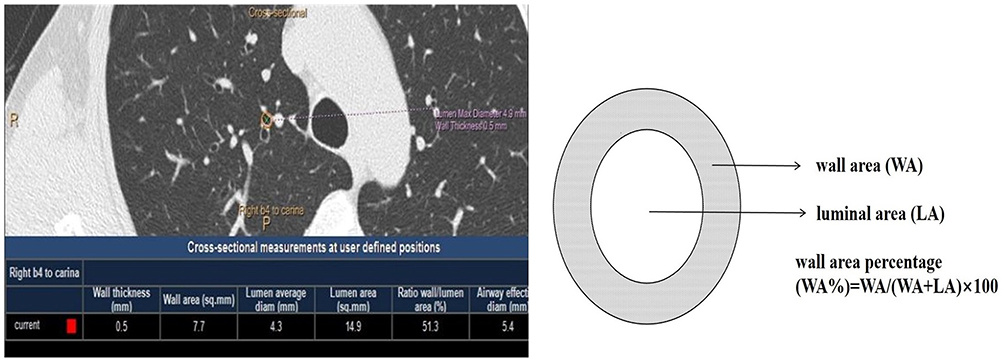 |
Figure 4 The measurement of WA, LA by quantitative CT software automatically and WA% is calculated as WA/(WA+LA)×100. |
Statistical Analysis
The distribution of the quantitative data was examined via the Kolmogorov–Smirnov method. Normally distributed data are reported herein as the mean (SD), whereas nonnormally distributed data are expressed as the median (range). To compare the differences in the parameters of the asthma, COPD, ACO and control groups, ANOVA and the Kruskal–Wallis test were used for normally and nonnormally distributed variables, respectively. Next, Pearson or Spearman correlation analysis was used to assess the relationships between the quantitative HRCT parameters (mean WA%, LAA%, and MLDE/I) and the pulmonary function indices (FEV1%pred and FEV1/FVC). Additionally, FEV1%pred, as the dependent variable, and the mean WA%, LAA%, MLDE/I and RVC−860 to −950 as the independent variables were included in the multiple linear regression analysis via stepwise regression, and the predictors of FEV1%pred were identified.
Results
Participant Characteristics
We included 184 participants; 54, 48, 52, and 30 participants were included in the control group, asthma group, COPD group and ACO group, respectively. Comparisons of the patient demographic information are shown in Table 1. Patients with COPD and ACO were older than those with asthma (P<0.001). The majority of the subjects in the COPD and ACO groups were male; however, the female proportion was significantly greater in the ACO group than in the COPD group (40% vs 21.15%). More than half of the patients with COPD and ACO had a smoking history, and the difference was not statistically significant. Patients with COPD and ACO were similar in terms of inhaled medications, and they inhaled more LAMA than did asthmatic patients (P<0.05). Furthermore, 66.67% of the ACO patients, 87.50% of the asthmatic patients and 67.31% of the COPD patients inhaled ICS/LABA. ACO patients had more exacerbations in the year preceding enrollment than did the other two groups (asthma: P<0.001; COPD: P= 0.005), whereas asthmatic patients had more upper respiratory tract complications than did patients with COPD and ACO.
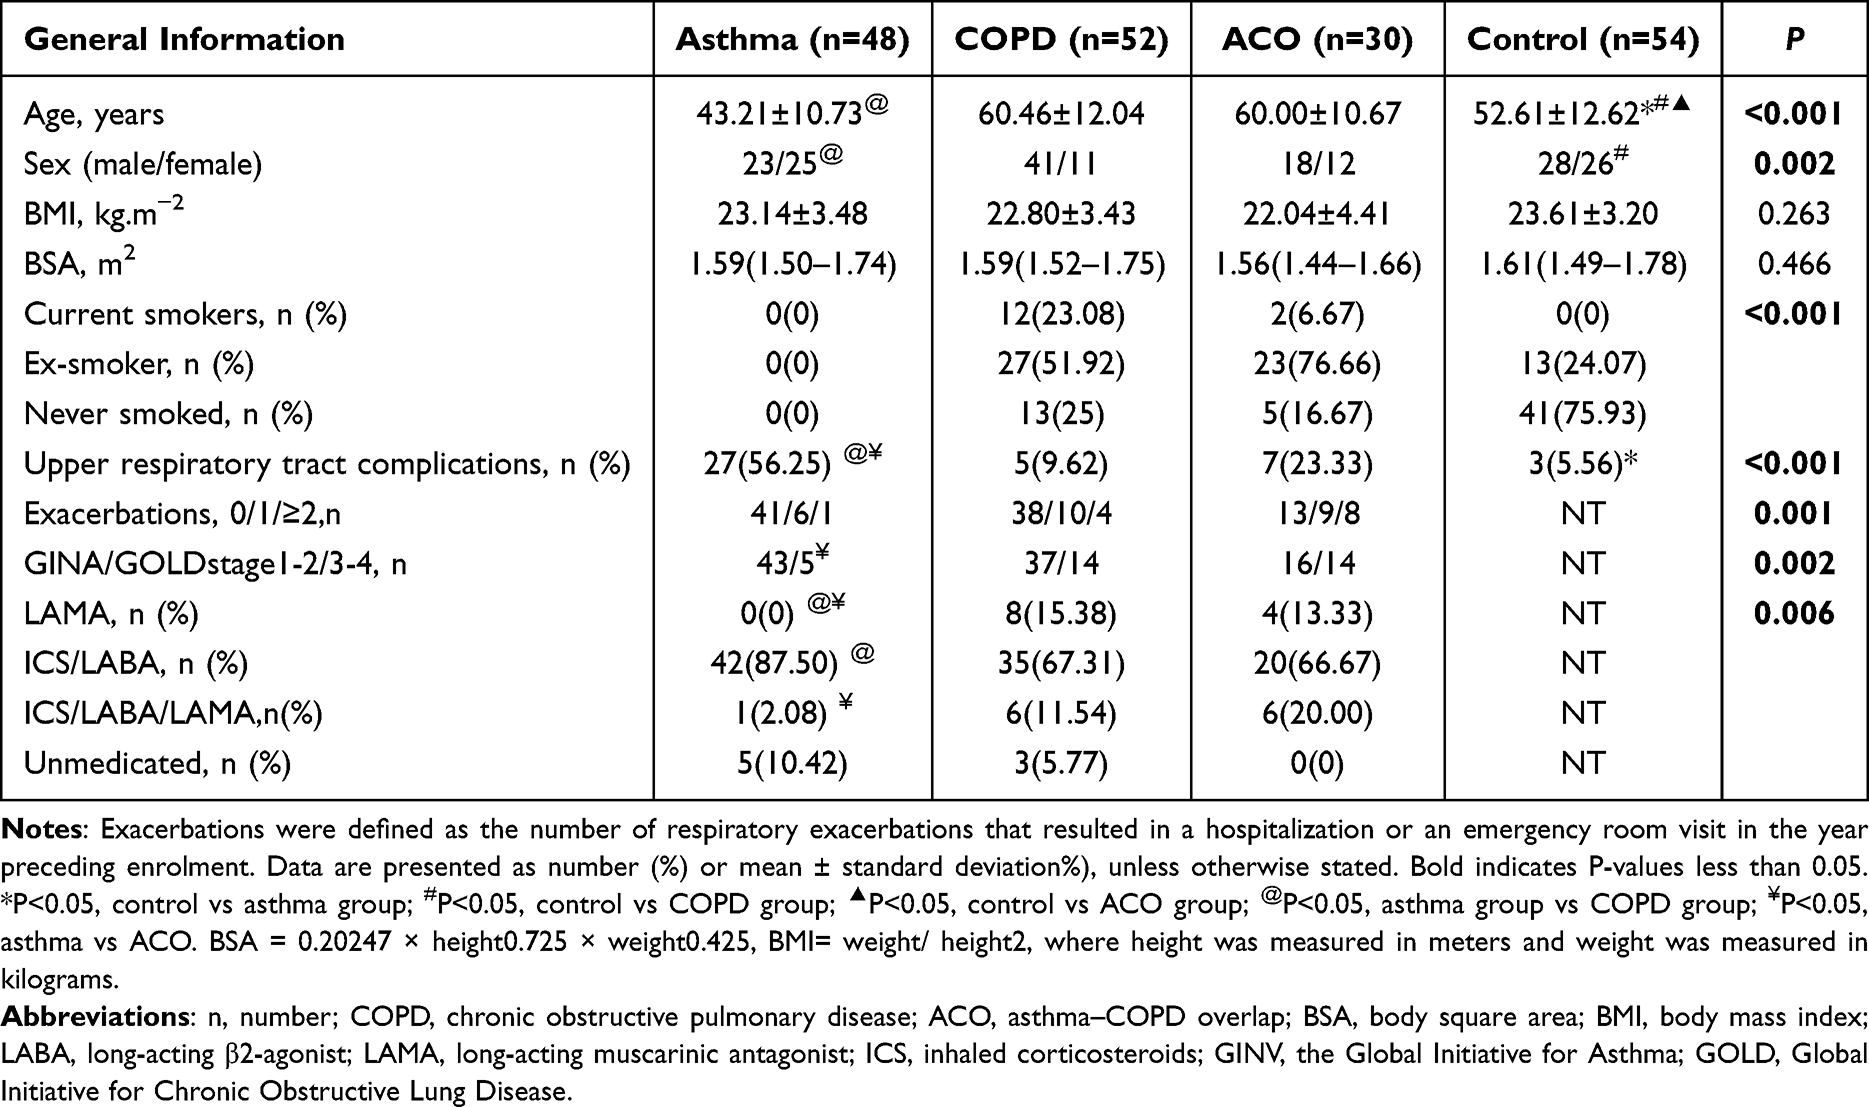 |
Table 1 Comparison of General Information Among Patients with Asthma, COPD and ACO, and Controls |
Differences in the Spirometry and IOS Indices Among the Control, Asthmatic Patients, COPD Patients, and ACO Patients
The pulmonary function test results (spirometry and IOS) are presented in Table 2 and Figure 5. All spirometry indices were significantly lower in the asthma, COPD and ACO groups than in the control group (P<0.001). After pairwise comparisons, we observed that the COPD group had significantly lower spirometry indices than did the asthma group (FEV1pred: 89.85% vs 66.70%, P<0.05; FEV1/FVC: 75.18% vs 60.75%, P<0.05). The median small airway indices (FEF 50, FEF 75, and FEF25-75) were less than 65% pred among the three patient groups. FEF50 (25.50 vs 59.25, P<0.05), FEF75 (46.50 vs 49.00, P<0.05) and FEF25-75 (25.80 vs 50.60, P<0.05) were lower in patients with COPD than in those with asthma. When we compared the IOS indices between groups, we found that, except for R20, all IOS values were greater in patients with both COPD and ACO than in those without COPD. The highest values (R5, R5-R20, X5, and AX) were observed in patients with ACO (P<0.001, P<0.001, P =0.006, and P =0.031, respectively).
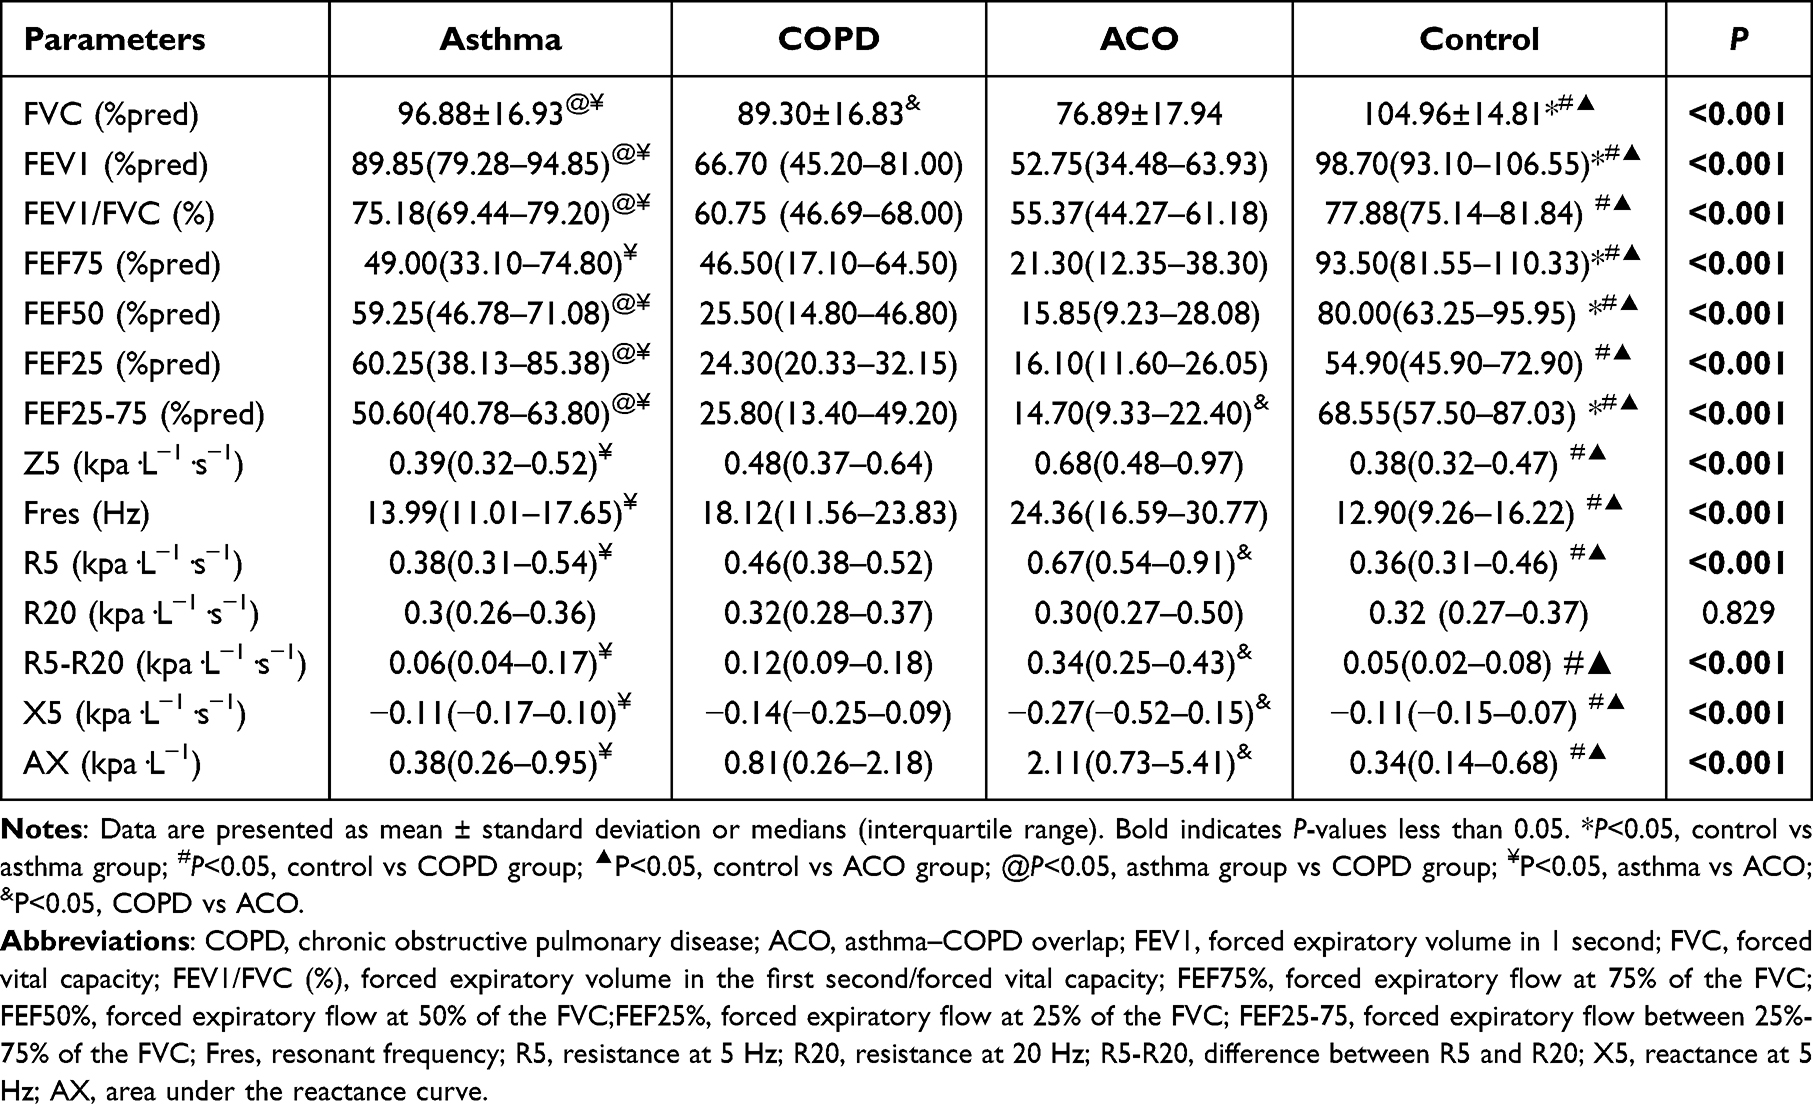 |
Table 2 The Difference of Pulmonary Function Among Patients with Asthma, COPD and ACO, and Controls |
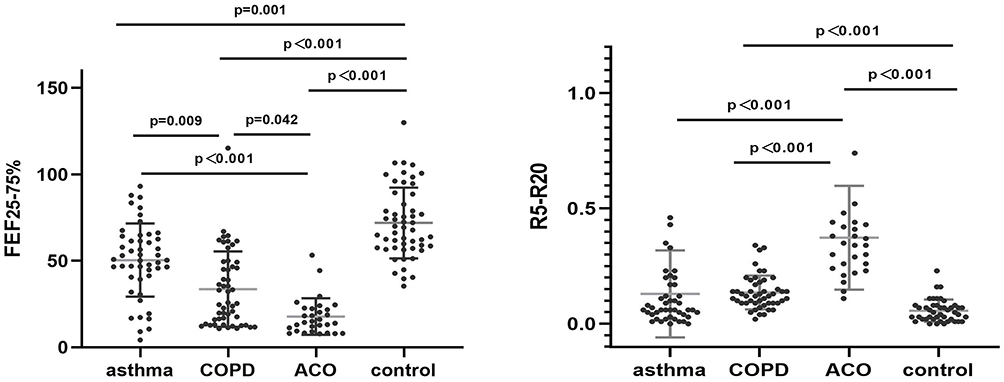 |
Figure 5 Comparison values of FEF25-75 and R5-R20 among all asthmatic patients, patients with COPD and ACO, and controls. |
HRCT Differences Among Controls, Asthmatic Patients, COPD Patients, and ACO Patients
The quantitative HRCT results for the controls, asthmatic patients, COPD patients and ACO patients are shown in Table 3 and Figure 6. A pairwise comparison revealed that LAA% values were greater in patients with COPD and ACO, with comparable values between asthmatic patients and controls and between the COPD and ACO groups. Compared with the control group, the COPD and ACO groups presented significantly greater WA5/BSA, WA6/BSA and mean WA% values (P<0.05). However, the LA4/BSA and the mean LA/BSA were decreased only in patients with asthma, and no significant difference was found in the LA indices among the other pairwise groups. The mean WA% was greater in ACO patients than in asthmatic patients (P=0.002) and COPD patients (P=0.012) (shown in Table 3 and Figure 7). No significant difference was found in the mean WA% between patients with an FEV1%pred<50% and those with an FEV1pred≥50% among the three groups (asthma: P=0.633; COPD: P=0.073; ACO: P=0.606) (shown in Figure 7). All patients had significantly greater RVC−860 to −950 levels than did the controls (P<0.001). The MLDE/I in patients with COPD was greater than that in patients with asthma but lower than that in patients with ACO (shown in Table 3 and Figure 6).
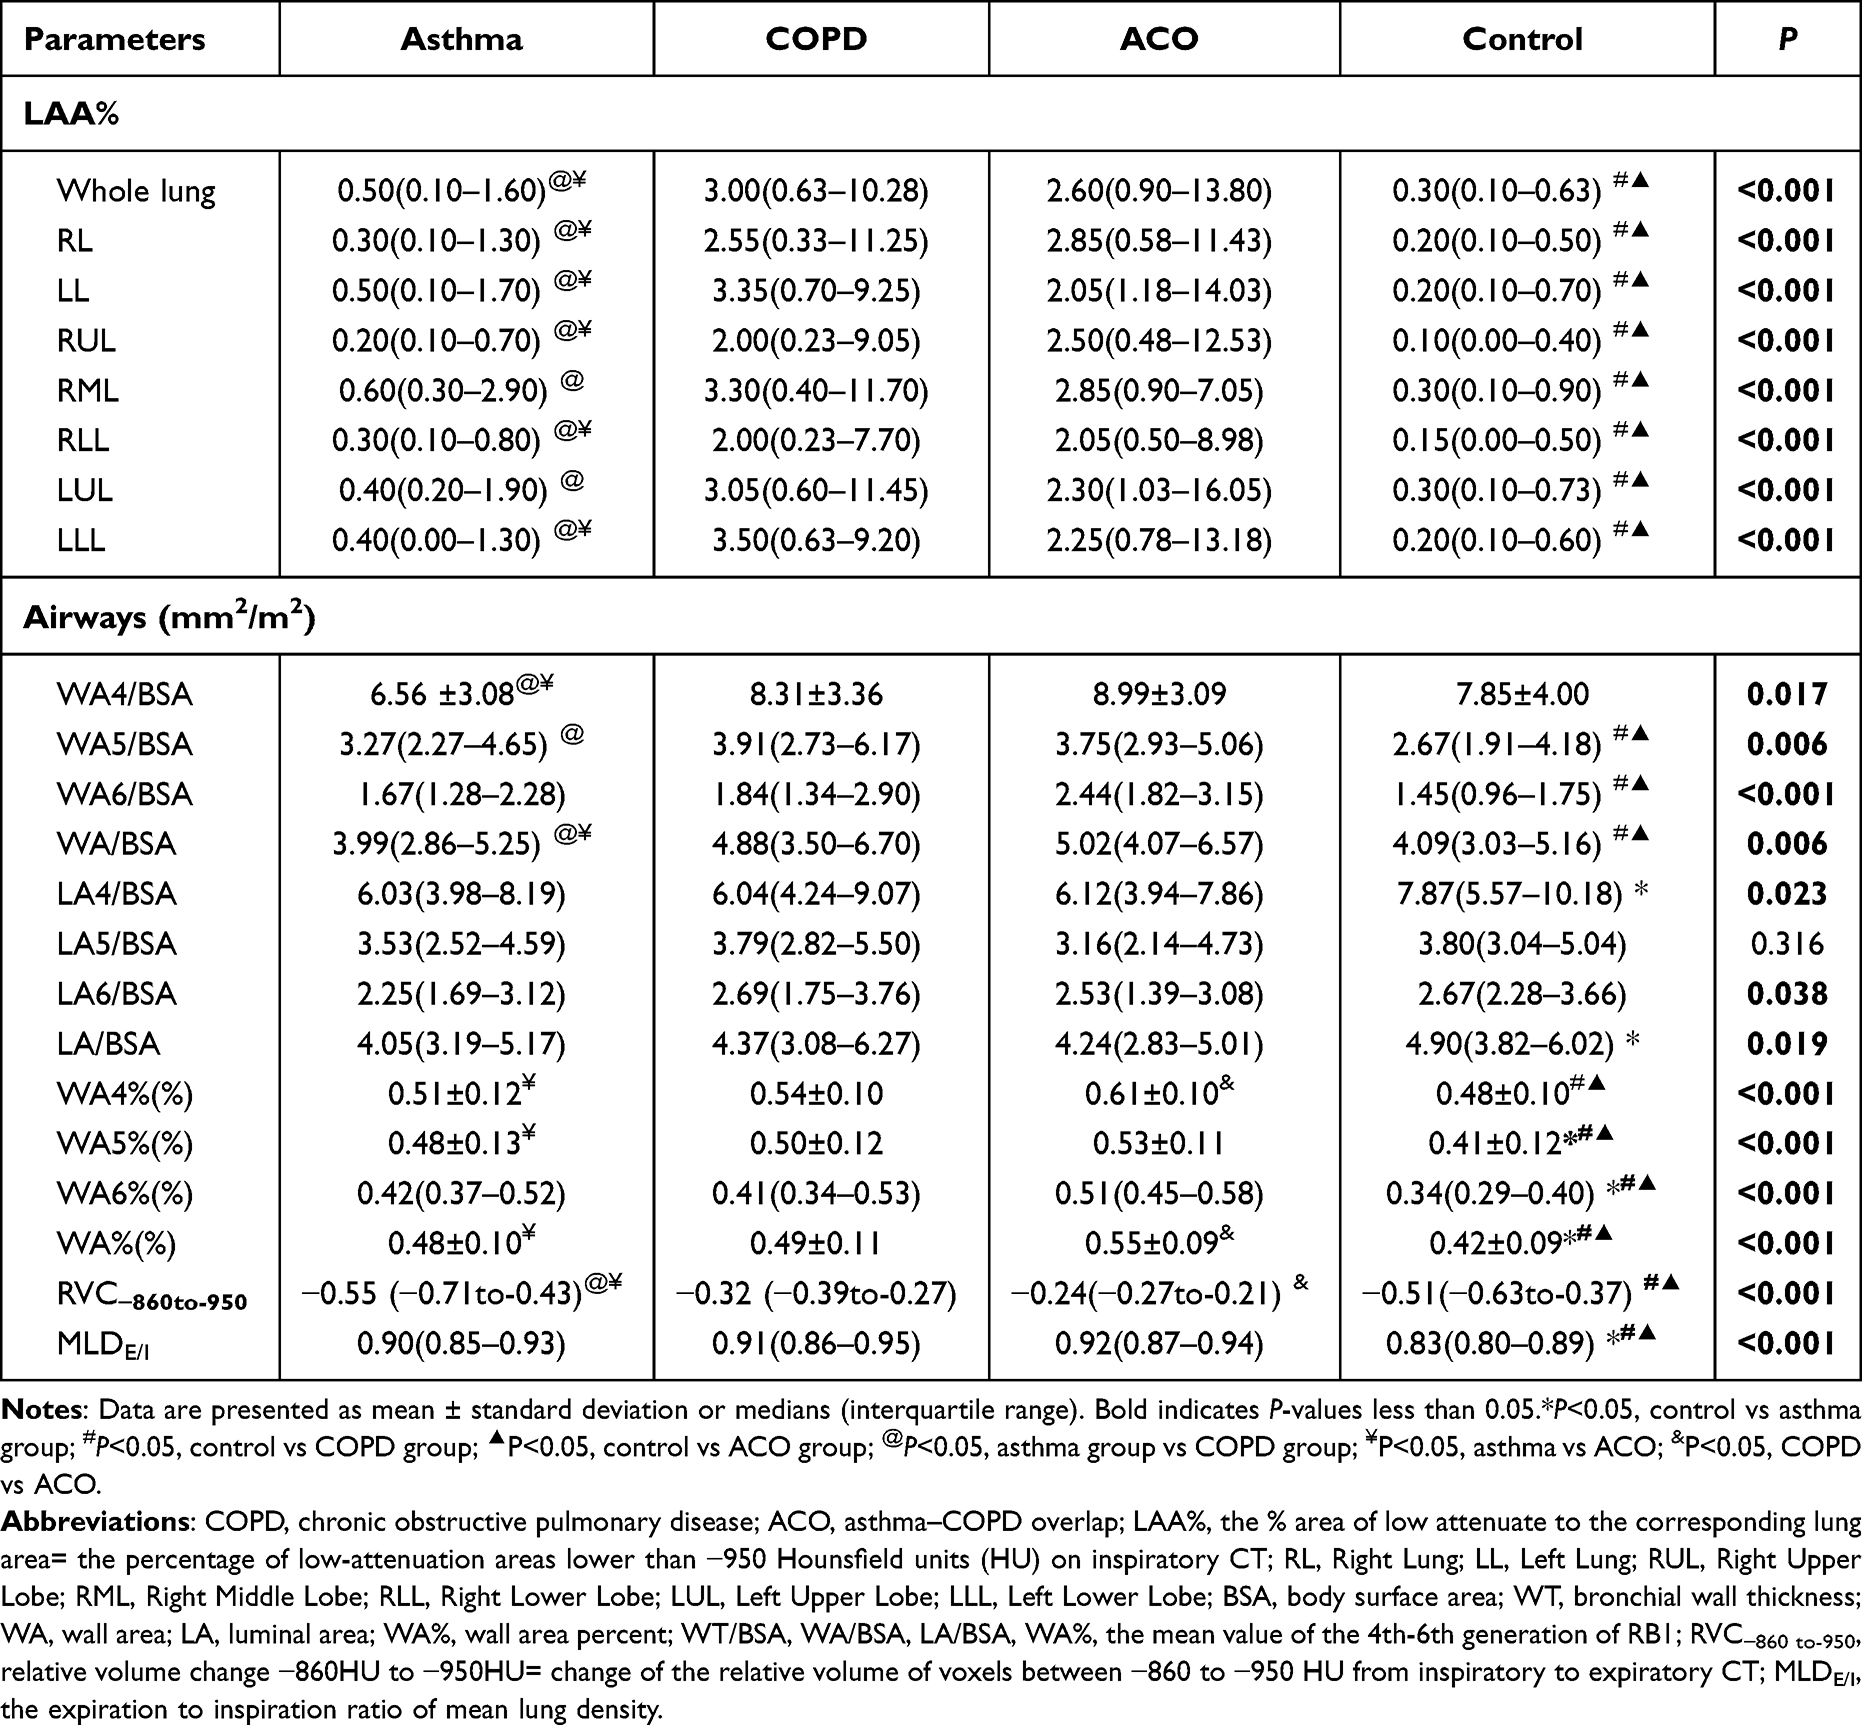 |
Table 3 Quantitative HRCT Parameters Among Patients with Asthma, COPD and ACO, and Controls |
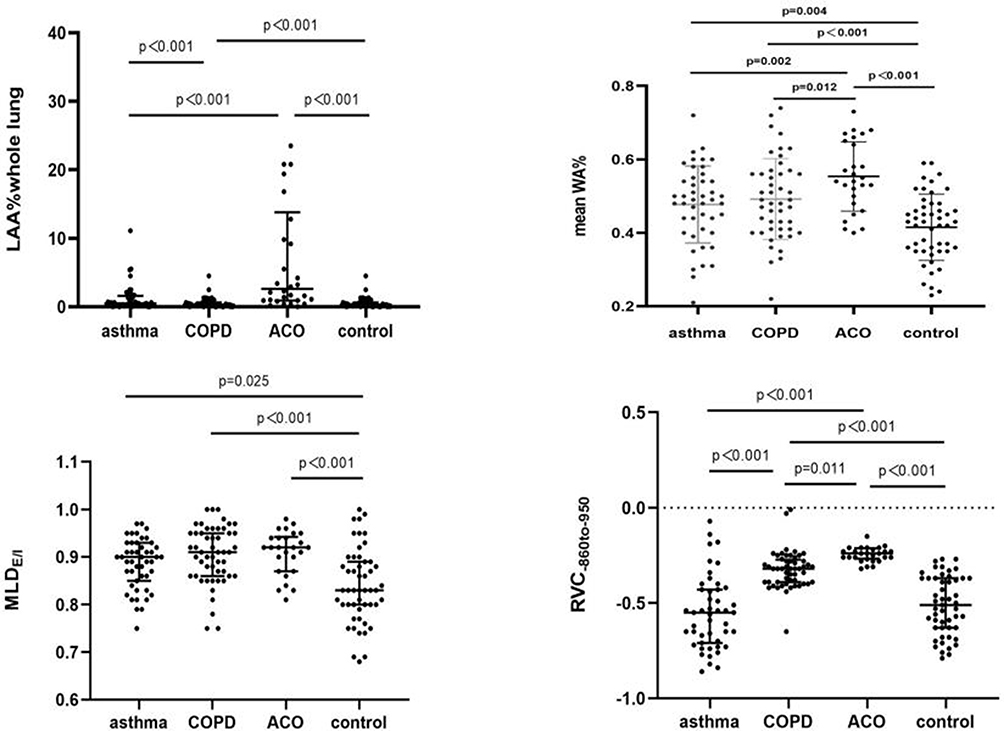 |
Figure 6 Comparison values of LAA% whole lung, mean WA%, RVC−860 to-950 and MLDE/I among all asthmatic patients, patients with COPD and ACO, and controls. |
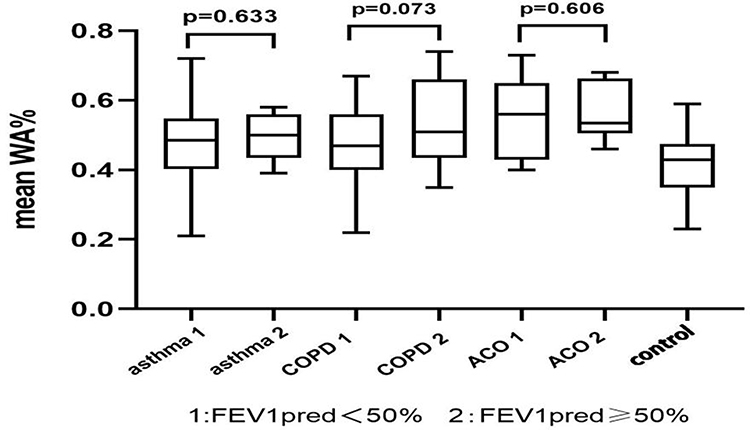 |
Figure 7 Comparison of mean WA% among all subjects according to FEV1%pred<50% or FEV1%pred≥50%. |
Correlations and Univariate Analysis to Explore the structure‒function Relationships in Asthmatic Patients, Patients with COPD and Patients with ACO
The correlations between the HRCT parameters and pulmonary function indices determined by univariate analysis are shown in Table 4. Moderate correlations were observed between the LAA%, MLDE/I and airflow obstruction indices (FEV1%pred and FEV1/FVC). As shown in Table 4 and Figure 8, airflow obstruction indices in patients with COPD and ACO were most strongly associated with the LAA% and MLDE/I values, respectively. However, the mean WA% values were not significantly correlated with the airflow obstruction indices (P>0.05). The mean WA% values were significantly positively correlated with the IOS indices (R5, R20, and R5-R20) in patients with asthma and COPD (shown in Table 5). There was a good correlation between the MLDE/I and FEF25-75 values (COPD: r=0.634, p<0.001; ACO: r=0.649, p<0.001), with a weaker correlation with R5-R20 (COPD: r=0.290, p=0.043; ACO: r=0.479, p=0.015) in patients with COPD and ACO.
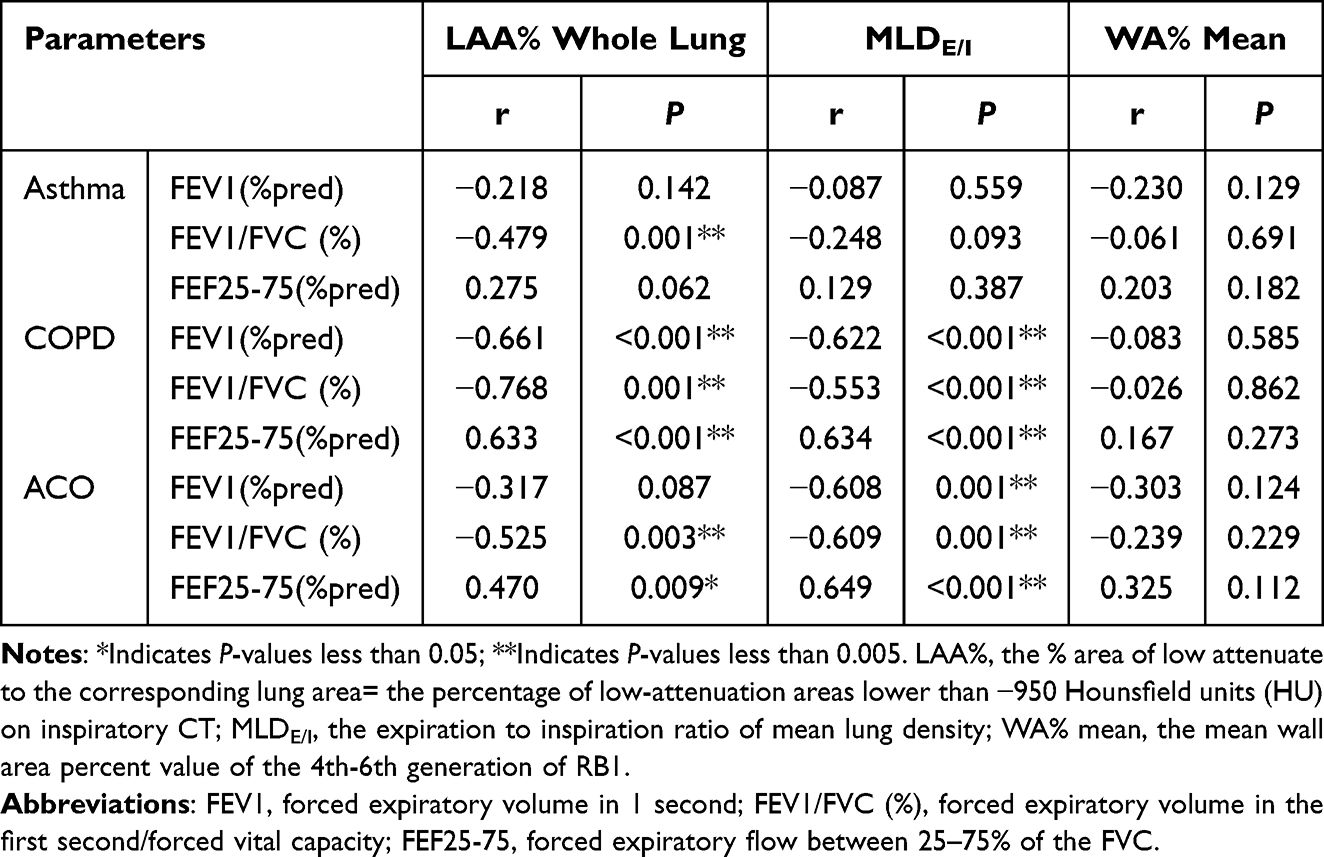 |
Table 4 The Relationships Between Quantitative CT and Spirometer Parameters in Patients with Asthma, COPD, and ACO |
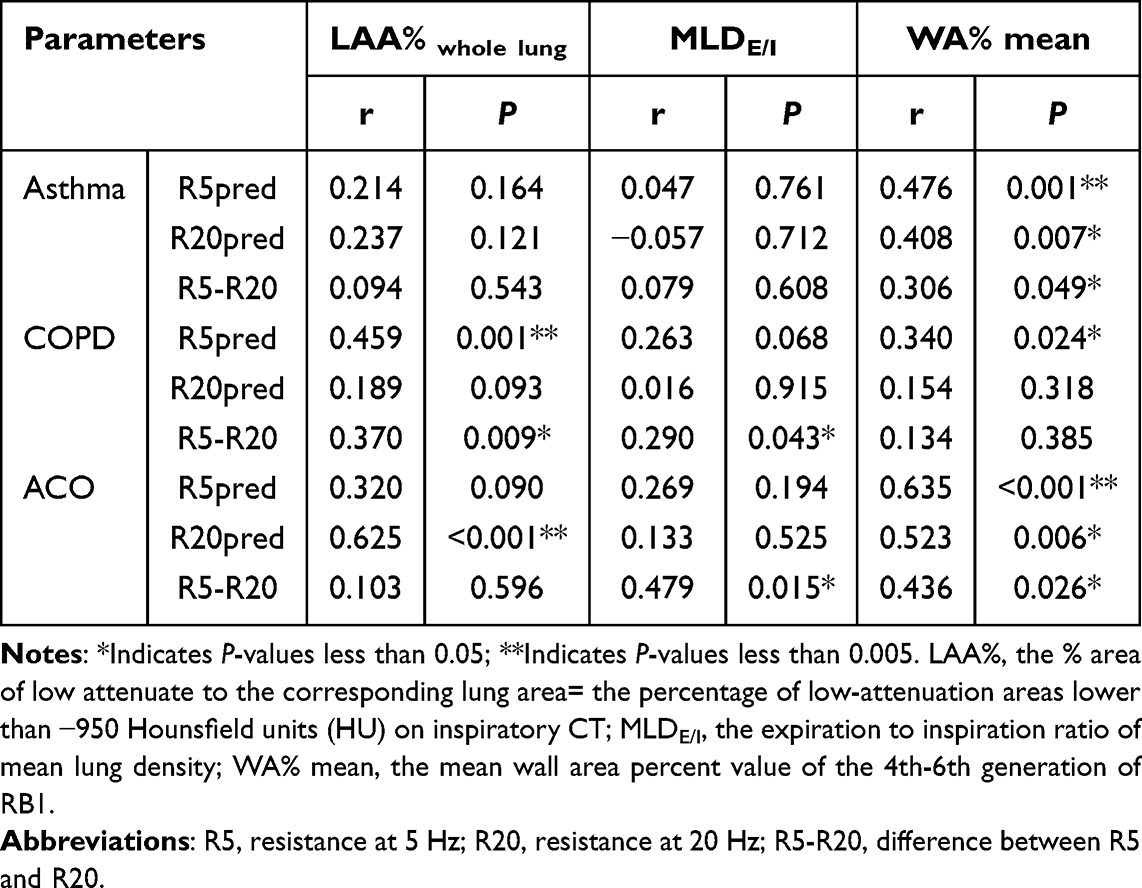 |
Table 5 The Relationships Between Quantitative CT and IOS Parameters in Patients with Asthma, COPD, and ACO |
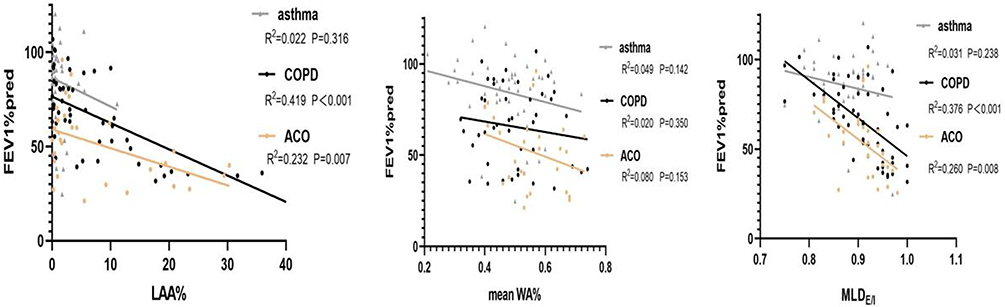 |
Figure 8 Scatter plot and linear regression of asthmatic patients (gray triangles) and patients with COPD (black circles) and ACO (brown circles) showing the relationship between FEV1% pred values and the quantitative HRCT morphometric and densitometric measures. |
Multiple Regression Analysis to Explore structure‒function Relationships in Asthmatic Patients and Patients with COPD and ACO
Multiple linear regression analysis in asthmatic patients revealed that only RVC−860 to −950 significantly contributed to the regression model for the prediction of FEV1pred (R2=0.079, p=0.034). LAA% and MLDE/I values contributed in patients with COPD (R2=0.501, p<0.001), with LAA% values making the strongest unique contribution (β: −0.457 vs −0.373). LAA%, mean WA% and RVC−860 to −950 values contributed in patients with ACO (R2=0.537, p<0.001; β: −0.684 vs −0.393 vs −0.312). The variance inflation factors among these regression models were all close to 1, which indicated that there was no multicollinearity among the independent variables (shown in Table 6).
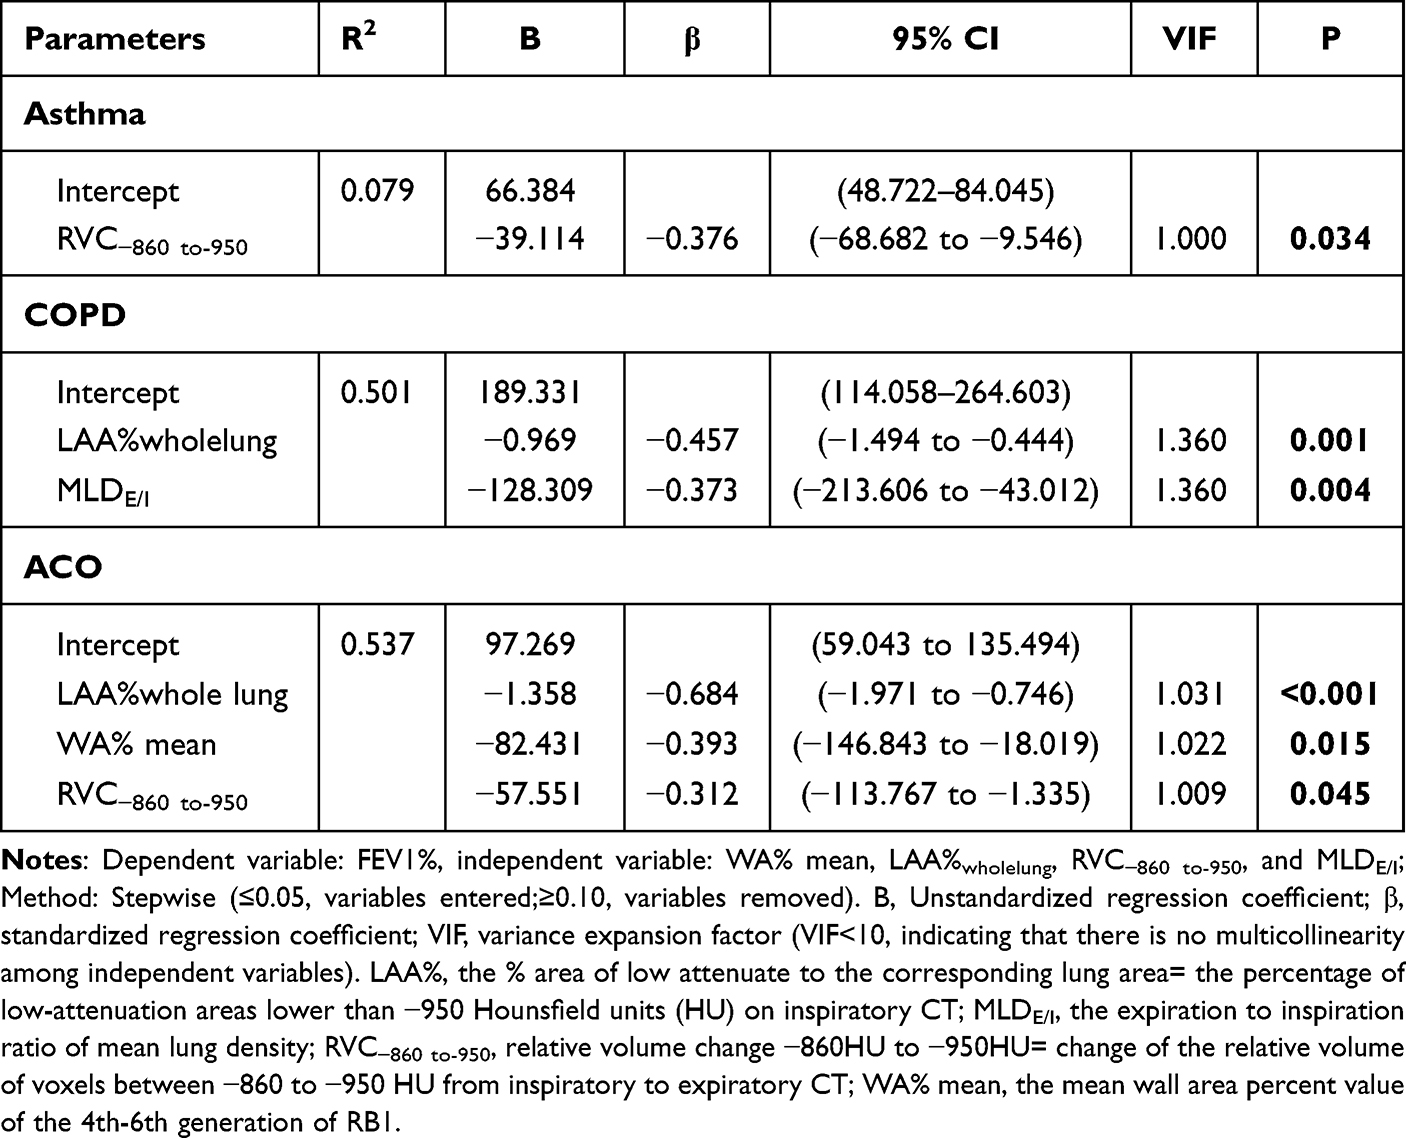 |
Table 6 Multiple Linear Regression Analysis for Quantitative HRCT Parameters to Predict FEV1%pred |
Discussion
In our study, patients with ACO were more likely (1) to be female, (2) to be between the ages of asthmatic patients and those of patients with COPD, and (3) to have experienced more frequent exacerbations in the previous year. Consistent with previous studies,20,21 we observed that the treatment regimens were similar in patients with COPD and those with ACO: the most commonly prescribed inhalation was ICS/LABA (COPD, 67.31%; ACO, 66.67%). Among patients with ACO, 20% received ICS/LAMA/LAMA triple therapy, while 13.3% did not receive ICS-containing therapy but did receive LAMA alone; these findings suggest that ACO has not been correctly recognized or properly treated. According to the current consensus,22 the initiation of ICS with LABA/LAMA should be the first treatment option. Furthermore, patients with severe ACO in this study were not treated with other asthma drugs, such as the anti-IgE antibody omalizumab, which may be effective in patients with ACO.23 Moreover, the high proportion (67.31%) of ICS/LABA usage in patients with COPD may be attributed to 26.92% of COPD patients experiencing exacerbations, resulting in hospitalization or an emergency room visit in the year preceding enrollment, since more aggressive therapy may be related to a decreased future risk of exacerbations. However, in addition to considering the patient’s exacerbation history, blood eosinophil counts and risk factor exposure and comorbidities need to be taken into account in clinical practice when making decisions regarding ICS use. Only in this way can we prescribe standardized yet individualized pharmacological treatment regimens.
To our knowledge, we are the first to describe lung densitometry and airway structural changes in asthmatic patients, patients with ACO and patients with COPD with reference to controls and to determine the relationships of these changes with lung function. Our study revealed that proximal airway remodeling, as represented by WA%, occurs in patients with the aforementioned airway diseases. We also observed similar morphological features between patients with COPD and patients with ACO: the WA and WA% increased, but the LA did not significantly decrease, which demonstrated that the proximal wall was thickened but that the lumen was not narrowed. Conversely, the WA% increased with decreasing LA in asthmatic patients, whereas the WA did not increase, indicating that the proximal lumen narrowed without wall thickening. Thus, we reasoned that the proximal airway was thickened outwardly in patients with COPD and ACO, whereas in patients with asthma, the proximal airway was thickened inwardly. These different patterns of airway remodeling in asthmatic and COPD patients are consistent with the results of previous studies.24,25 As shown in Table 2, our results revealed that FEF50, FEF75, and FEF25-75 (small airway function indices) in patients with ACO and COPD were lower than those in patients with asthma and controls, and the medians were less than 65%, indicating that SAD occurs in patients with these airway diseases, with greater SAD occurring in patients with ACO and COPD. Moreover, the MLDE/I in patients with COPD and ACO was moderately to strongly associated with FEF25-75 and, to a lesser extent, R5-R20 values (Tables 4 and 5). Therefore, we speculate that the proximal airway lumen might become relatively dilated in COPD and ACO patients to compensate for progressive SAD. This may be responsible for the absence of significant stenosis in the proximal airway lumen in COPD and ACO patients. The different patterns of remodeling observed on HRCT indicate heterogeneity in airway diseases, which indirectly reflects fundamental differences in airway inflammation in patients with asthma, COPD and ACO and subsequently affects the reversibility of airflow limitation.
Several studies have shown that airway remodeling becomes more prominent as airflow limitation progresses.26,27 In a study by Aysola et al27 the WA% was significantly greater in patients with severe asthma than in those with mild-to-moderate asthma. Koo et al28 reported that airway wall thickening was significantly greater in patients with GOLD III and IV than in patients with GOLD I and II. Conversely, the WA% in COPD patients with an FEV1<50% pred was comparable to that in patients with an FEV1≥50% pred in our study (shown in Figure 7). The limited sample size is hypothesized to have influenced our findings, and it is recommended that future trials include larger sample sizes to further validate these results. In addition to irreversible airway remodeling, the thickening of airway walls also involves reversible processes such as bronchoconstriction, inflammatory cell infiltration, and edema of the airway walls.29 However, the disease of all of the subjects in this study was controlled prior to undergoing HRCT examination, with the aim of minimizing the impact of reversible airway changes and increasing confidence in our conclusions.
Furthermore, we found that asthma patients and patients with COPD exhibit a comparable degree of airway remodeling, considering the presence of unbalanced baseline characteristics in our study, including age, sex ratio, smoking history and airflow limitation; these findings have also been reported in previous studies.30,31 In contrast, several other studies have reported more pronounced airway remodeling in patients with asthma than in patients with COPD.32–34 These findings seem to be associated with a significantly thicker airway basement membrane,35 and an increased number of airway smooth muscle layers36 and blood vessels37 in patients with asthma than in patients with COPD. We also found a greater degree of airway remodeling in patients with ACO than in those with asthma and COPD, which aligns with findings from previous studies.38–40 Similarly, Kim et al41 demonstrated that COPD patients with a positive bronchodilation response (BDR) presented with increased airway smooth muscle mass and thinner epithelial layers than those with a negative BDR. Considering these collective findings, it is reasonable to infer that subjects with ACO experience significant airway smooth muscle hypertrophy and hyperplasia, which leads to pronounced airway remodeling. The LAA% of the COPD and ACO groups was greater than that of the asthma and control groups, whereas there was no significant difference between the COPD group and the ACO group or between the asthma group and the control group. These findings revealed that a similar degree of emphysema was observed in the COPD and ACO groups but not in the asthma group. Previous reports have revealed that cigarette smoking is thought to be associated with the presence of emphysema in asthmatic patients and the subsequent development of the ACO phenotype.42 Niwa et.al39 reported that the lung function and airway structural characteristics of long-term smokers with asthma were similar to those of patients with ACO. Therefore, our study excluded smokers to decrease the effect of cigarette smoking on airway structure in asthmatic patients. Additionally, patients with asthma, COPD, and ACO showed significant differences from controls in terms of FEV1%pred, FEV1/FVC, FEF75, FEF50, and FEF25-75, which showed that airflow limitations (both in the large and small airways) were greater in patients with ACO and COPD than in patients with asthma. We also observed that the ACO group had significantly greater IOS indicators (R5, R5-R20, X5, and AX) than did the COPD group. These data indicate that the ACO group had the heaviest SAD among all groups, which is supported by our qHRCT measurements. Regarding air trapping as an indicator of SAD in HRCT imaging, we found that patients with ACO had the highest MLDE/I and RVC−860 to −950 among all groups, indicating that among these airway diseases, ACO resulted in the narrowest airways, which contributed to more severe air trapping.
Finally, our study examined the relative contributions of emphysema, air trapping and airway remodeling to airflow limitation. Our analysis of structure‒function relationships revealed that only RVC−860 to −950 was a significant predictor of the FEV1%pred in patients with asthma, suggesting that structural lesions of small airways are an important anatomic determinant of airflow limitation. In patients with COPD, the LAA% is a better predictor of FEV1%pred than the MLDE/I is. This finding implies that emphysema contributes more to airflow limitation than does air trapping. Emphysema severity on CT is independently correlated with the annual rapid decline in FEV1 in patients with COPD, as shown in a study by Nishimura et al.43 Moreover, CT-quantified emphysema is reported to be predictive of respiratory-related mortality in COPD patients according to multiple variable analyses.44 These findings also indicate that interventions targeting emphysema may lead to better outcomes than those targeting either air trapping or airway remodeling in patients with COPD. We also found that LAA%, WA% and RVC−860 to −950 all contributed to FEV1pred in the multiple regression model for the ACO group. As previously described, we speculate that the airflow limitation is due to a combination of emphysema and airway remodeling (occurring in both the large and small airways) in patients with ACO. We also observed that airway measurements (WA%) did not contribute to the prediction of airway limitation (FEV1%pred) in the multiple regression model for patients with COPD and asthma, which is consistent with findings from previous studies.28,45 Moreover, Tho et al46 demonstrated that the %LAV was more strongly correlated with the FEV1/FVC and FEV1% than with the PI10 by multiple regression analysis. Given the above findings, airway parameters, such as WA%, which is directly measured by qHRCT, may be more suitable for assessing the severity of airflow limitation in chronic airway diseases than indirect densitometric parameters, such as LAA%, RVC−860 to−950 or MLDE/I. Additionally, in the present study, we found that respiratory impedance (R5, R20, and R5-R20, measured by the IOS) was significantly positively correlated with WA% (assessed by qHRCT) in the lungs, suggesting that, compared with spirometry, the IOS may have more potential for assessing airway structural changes. Airway remodeling becomes more serious as the resistance of both large and small airways increases. In summary, on the one hand, demonstrating that there are different pathological changes may help to elucidate the underlying physiology. And on the other hand, due to the heterogeneity of airway disease, only performing spirometry or quantitative HRCT measurements is not enough; it is best to consider multiple dimensions of the disease (functional and structural parameters) when characterizing a patient’s airway disease. This information may help clinicians better understand the pathogenesis, monitor the treatment response, determine the therapeutic targets and select a precise treatment for each individual.
There are several limitations in this study that merit consideration. First, our study was performed at a single center, and the sample size of the ACO group was relatively small (n=30), which resulted in selection bias. Hence, a greater sample size of patients should be included in further multicenter studies for further analysis. Second, the current lack of a definitive way to characterize ACO means that different definitions of ACO may yield different results. Third, owing to the resolution limitation of CT, we measured only the 4th- to 6th-generation bronchi of RB1. Therefore, future studies with multipoint measurements of bronchi from different lobes are warranted. Furthermore, since this study could not exclude the effect of inhalation drugs on lung function indices, we did not perform a bronchodilation test. Similarly, the effects of inhaled or oral corticosteroids on measures of airway inflammation (eg, induced sputum eosinophils, serum eosinophils, and serum IgE) cannot be excluded. Therefore, we did not collect data related to airway inflammation. Finally, further longitudinal follow-up and therapeutic studies are lacking; therefore, future studies should track disease progression and identify the optimal therapy for different airway diseases.
Conclusion
In summary, proximal airway remodeling and air trapping were found to occur in asthmatic patients and patients with ACO and COPD, but emphysema was restricted to patients with ACO and COPD. Similar morphological features were observed between patients with COPD and those with ACO: the proximal airway was thickened outward, whereas in patients with asthma, the proximal airway was thickened inward. Among these three airway diseases, ACO led to the greatest respiratory resistance in the lung function analysis and the most severe air trapping in the HRCT analysis. Our analysis of structure‒function relationships revealed that indirect lung densitometry measurements might be more predictive of the degree of airflow limitation than direct airway measurements in obstructive airway diseases.
Data Sharing Statement
The data used in our study can be obtained from the corresponding author upon reasonable request.
Ethics and Consent Statement
This study protocol was reviewed and approved by the Institutional Ethics Committee of Zhujiang Hospital of Southern Medical University, China (approval no. 2022-KY-010-01). All study participants provided written informed consent before enrollment. Patients’ privacy and personal identity information were well protected, and the study protocol adheres to the recommendations of the Declaration of Helsinki.
Disclosure
The authors report no conflicts of interest in this work.
References
1. Sin DD, Miravitlles M, Mannino DM, et al. What is asthma-COPD overlap syndrome? Towards a consensus definition from a round table discussion. Eur Respir J. 2016;48(3):664–673. doi:10.1183/13993003.00436-2016
2. Joo H, Han D, Lee JH, Rhee CK. Heterogeneity of asthma-COPD overlap syndrome. Int J Chron Obstruct Pulmon Dis. 2017;12:697–703. doi:10.2147/COPD.S130943
3. Cosio BG, Soriano JB, López-Campos JL, et al. Defining the asthma-COPD overlap syndrome in a COPD cohort. Chest. 2016;149(1):45–52. doi:10.1378/chest.15-1055
4. Postma DS, Rabe KF. The asthma-COPD overlap syndrome. N Engl J Med. 2015;373(13):1241–1249. doi:10.1056/NEJMra1411863
5. Jo YS, Lee J, Yoon HI, Kim DK, Yoo CG, Lee CH. Different prevalence and clinical characteristics of asthma-chronic obstructive pulmonary disease overlap syndrome according to accepted criteria. Ann Allergy Asthma Immunol. 2017;118(6):696–703.e1. doi:10.1016/j.anai.2017.04.010
6. Tommola M, Ilmarinen P, Tuomisto LE, et al. Differences between asthma-COPD overlap syndrome and adult-onset asthma. Eur Respir J. 2017;49(5):10.1183/13993003.02383–2016.
7. Menezes A, Montes De Oca M, Pérez-Padilla R, et al. Increased risk of exacerbation and hospitalization in subjects with an overlap phenotype: COPD-asthma. Chest. 2014;145(2):297–304. doi:10.1378/chest.13-0622
8. Hosseini M, Almasi-Hashiani A, Sepidarkish M, Maroufizadeh S. Global prevalence of asthma-COPD overlap (ACO) in the general population: a systematic review and meta-analysis. Resp Res. 2019;20(1):229. doi:10.1186/s12931-019-1198-4
9. Laucho-Contreras M, de Oca MM, Owen CA. Asthma COPD overlap syndrome: an approach to A real -world endotype in obstructive lung disease? Curr Pharm Des. 2016;22:6273–6282. doi:10.2174/1381612822666160906162441
10. Pérez-de-Llano L, Cosio BG. Asthma-COPD overlap is not a homogeneous disorder: further supporting data. Respir Res. 2017;18:183. doi:10.1186/s12931-017-0667-x
11. Global Initiative for Chronic Obstructive Lung Disease (GOLD). Global strategy for the diagnosis, management, and prevention of chronic obstructive pulmonary disease; 2024. Available from: http://gold.copd.org/2024-gold-report/.
12. Global Initiative for Asthma, Global Initiative for Chronic Obstructive Lung Disease. Diagnosis and initial treatment of asthma, COPD, and asthma-COPD overlap. Available from: http://ginasthma.org/download/824/.
13. Agusti A, Fabbri LM, Singh D, et al. Inhaled corticosteroids in COPD: friend or foe? Eur Respir J. 2018;52(6):10.1183/13993003.01219–2018.
14. Global Initiative for Chronic Obstructive Lung Disease. Global strategy for prevention, diagnosis and management of COPD; 2017. Available from: https://goldcopd.org/gold-reports/.
15. Global Strategy for Asthma Management and Prevention. Global Initiative for Asthma (GINA); 2017. Available from: http://www.ginasthma.org.
16. Oostveen E, MacLeod D, Lorino H, et al. The forced oscillation technique in clinical practice: methodology, recommendations and future developments. Eur Respir J. 2003;22(6):1026–1041. doi:10.1183/09031936.03.00089403
17. Matsuoka S, Kurihara Y, Yagihashi K, Hoshino M, Watanabe N, Nakajima Y. Quantitative assessment of air trapping in chronic obstructive pulmonary disease using inspiratory and expiratory volumetric MDCT. AJR Am J Roentgenol. 2008;190(3):762–769. doi:10.2214/AJR.07.2820
18. O’Donnell RA, Peebles C, Ward JA, et al. Relationship between peripheral airway dysfunction, airway obstruction, and neutrophilic inflammation in COPD. Thorax. 2004;59(10):837–842. doi:10.1136/thx.2003.019349
19. Kubo K, Eda S, Yamamoto H, et al. Expiratory and inspiratory chest computed tomography and pulmonary function tests in cigarette smokers. Eur Respir J. 1999;13(2):252–256. doi:10.1034/j.1399-3003.1999.13b06.x
20. Romem A, Rokach A, Bohadana A, et al. Identification of asthma-COPD overlap, asthma, and chronic obstructive pulmonary disease phenotypes in patients with airway obstruction: influence on treatment approach. Respiration. 2020;99(1):35–42. doi:10.1159/000503328
21. Ding B, Small M. Treatment trends in patients with asthma-COPD overlap syndrome in a COPD cohort: findings from a real-world survey. Int J Chron Obstruct Pulmon Dis. 2017;12:1753–1763. doi:10.2147/COPD.S136314
22. Asthma, COPD and Asthma-COPD overlap. A joint project of GINA and GOLD update April; 2017. Available from: https://ginasthma.org/.ACO.
23. Maltby S, Gibson PG, Powell H, McDonald VM. Omalizumab treatment response in a population with severe allergic asthma and overlapping COPD. Chest. 2017;151(1):78–89. doi:10.1016/j.chest.2016.09.035
24. Shimizu K, Hasegawa M, Makita H, Nasuhara Y, Konno S, Nishimura M. Comparison of airway remodelling assessed by computed tomography in asthma and COPD. Respir Med. 2011;105(9):1275–1283. doi:10.1016/j.rmed.2011.04.007
25. Kurashima K, Hoshi T, Takayanagi N, et al. Airway dimensions and pulmonary function in chronic obstructive pulmonary disease and bronchial asthma. Respirology. 2012;17(1):79–86. doi:10.1111/j.1440-1843.2011.02052.x
26. Shim SS, Schiebler ML, Evans MD, et al. Lumen area change (Delta Lumen) between inspiratory and expiratory multidetector computed tomography as a measure of severe outcomes in asthmatic patients. J Allergy Clin Immunol. 2018;142(6):1773–1780.e9. doi:10.1016/j.jaci.2017.12.1004
27. Aysola RS, Hoffman EA, Gierada D, et al. Airway remodeling measured by multidetector CT is increased in severe asthma and correlates with pathology. Chest. 2008;134(6):1183–1191. doi:10.1378/chest.07-2779
28. Koo HJ, Lee SM, Seo JB, et al. Prediction of pulmonary function in patients with chronic obstructive pulmonary disease: correlation with quantitative CT parameters. Korean J Radiol. 2019;20(4):683–692. doi:10.3348/kjr.2018.0391
29. Gono H, Fujimoto K, Kawakami S, Kubo K. Evaluation of airway wall thickness and air trapping by HRCT in asymptomatic asthma. Eur Respir J. 2003;22(6):965–971. doi:10.1183/09031936.03.00085302
30. Górska K, Krenke R, Kosciuch J, et al. Relationship between airway inflammation and remodeling in patients with asthma and chronic obstructive pulmonary disease. Eur J Med Res. 2009;14(Suppl 4):90–96. doi:10.1186/2047-783x-14-s4-90
31. Hartley RA, Barker BL, Newby C, et al. Relationship between lung function and quantitative computed tomographic parameters of airway remodeling, air trapping, and emphysema in patients with asthma and chronic obstructive pulmonary disease: a single-center study. J Allergy Clin Immunol. 2016;137(5):1413–1422.e12. doi:10.1016/j.jaci.2016.02.001
32. Oguma T, Hirai T, Fukui M, et al. Longitudinal shape irregularity of airway lumen assessed by CT in patients with bronchial asthma and COPD. Thorax. 2015;70(8):719–724. doi:10.1136/thoraxjnl-2014-206651
33. Kosciuch J, Krenke R, Gorska K, Zukowska M, Maskey-Warzechowska M, Chazan R. Airway dimensions in asthma and COPD in high resolution computed tomography: can we see the difference? Resp Care. 2013;58(8):1335–1342. doi:10.4187/respcare.02175
34. Chen H, Zeng QS, Zhang M, et al. Quantitative low-dose computed tomography of the lung parenchyma and airways for the differentiation between chronic obstructive pulmonary disease and asthma patients. Respiration. 2017;94(4):366–374. doi:10.1159/000478531
35. Milanese M, Crimi E, Scordamaglia A, et al. On the functional consequences of bronchial basement membrane thickening. J Appl Physiol. 2001;91(3):1035–1040. doi:10.1152/jappl.2001.91.3.1035
36. Dunnill MS, Massarella GR, Anderson JA. A comparison of the quantitative anatomy of the bronchi in normal subjects, in status asthmaticus, in chronic bronchitis, and in emphysema. Thorax. 1969;24(2):176–179. doi:10.1136/thx.24.2.176
37. Tanaka H, Yamada G, Saikai T, et al. Increased airway vascularity in newly diagnosed asthma using a high-magnification bronchovideoscope. Am J Resp Crit Care. 2003;168(12):1495–1499. doi:10.1164/rccm.200306-727OC
38. Suzuki T, Tada Y, Kawata N, et al. Clinical, physiological, and radiological features of asthma-chronic obstructive pulmonary disease overlap syndrome. Int J Chronic Obstr. 2015;10:947–954. doi:10.2147/COPD.S80022
39. Niwa M, Fujisawa T, Karayama M, et al. Differences in airway structural changes assessed by 3-dimensional computed tomography in asthma and asthma-chronic obstructive pulmonary disease overlap. Ann Allergy Asthma Immunol. 2018;121(6):704–710.e1. doi:10.1016/j.anai.2018.08.006
40. Karayama M, Inui N, Yasui H, et al. Physiological and morphological differences of airways between COPD and asthma-COPD overlap. Sci Rep. 2019;9(1):7818. doi:10.1038/s41598-019-44345-6
41. Kim V, Pechulis RM, Abuel-Haija M, Solomides CC, Gaughan JP, Criner GJ. Small airway pathology and bronchoreversibility in advanced emphysema. Copd. 2010;7(2):93–101. doi:10.3109/15412551003631691
42. Mitsunobu F, Ashida K, Hosaki Y, et al. Influence of long-term cigarette smoking on immunoglobulin E-mediated allergy, pulmonary function, and high-resolution computed tomography lung densitometry in elderly patients with asthma. Clin Exp Allergy. 2004;34(1):59–64. doi:10.1111/j.1365-2222.2004.01844.x
43. Nishimura M, Makita H, Nagai K, et al. Annual change in pulmonary function and clinical phenotype in chronic obstructive pulmonary disease. Am J Resp Crit Care. 2012;185(1):44–52. doi:10.1164/rccm.201106-0992OC
44. Haruna A, Muro S, Nakano Y, et al. CT scan findings of emphysema predict mortality in COPD. Chest. 2010;138(3):635–640. doi:10.1378/chest.09-2836
45. Nambu A, Zach J, Schroeder J, et al. Quantitative computed tomography measurements to evaluate airway disease in chronic obstructive pulmonary disease: relationship to physiological measurements, clinical index and visual assessment of airway disease. Eur J Radiol. 2016;85(11):2144–2151. doi:10.1016/j.ejrad.2016.09.010
46. Tho NV, Ryujin Y, Ogawa E, et al. Relative contributions of emphysema and airway remodelling to airflow limitation in COPD: consistent results from two cohorts. Respirology. 2015;20(4):594–601. doi:10.1111/resp.12505
 © 2024 The Author(s). This work is published and licensed by Dove Medical Press Limited. The
full terms of this license are available at https://www.dovepress.com/terms.php
and incorporate the Creative Commons Attribution
- Non Commercial (unported, v3.0) License.
By accessing the work you hereby accept the Terms. Non-commercial uses of the work are permitted
without any further permission from Dove Medical Press Limited, provided the work is properly
attributed. For permission for commercial use of this work, please see paragraphs 4.2 and 5 of our Terms.
© 2024 The Author(s). This work is published and licensed by Dove Medical Press Limited. The
full terms of this license are available at https://www.dovepress.com/terms.php
and incorporate the Creative Commons Attribution
- Non Commercial (unported, v3.0) License.
By accessing the work you hereby accept the Terms. Non-commercial uses of the work are permitted
without any further permission from Dove Medical Press Limited, provided the work is properly
attributed. For permission for commercial use of this work, please see paragraphs 4.2 and 5 of our Terms.