")
Back to Journals » Diabetes, Metabolic Syndrome and Obesity » Volume 17
Effects of Different Carbohydrate Content Diet on Gut Microbiota and Aortic Calcification in Diabetic Mice
Authors Shen X, Guo G, Feng G , Wang Z
Received 27 December 2023
Accepted for publication 28 May 2024
Published 10 June 2024 Volume 2024:17 Pages 2327—2346
DOI https://doi.org/10.2147/DMSO.S456571
Checked for plagiarism Yes
Review by Single anonymous peer review
Peer reviewer comments 4
Editor who approved publication: Dr Konstantinos Tziomalos
Xinyi Shen,1,2 Ge Guo,1,2 Guoquan Feng,3 Zhongqun Wang1,2
1Department of Cardiology, Affiliated Hospital of Jiangsu University, Zhenjiang, 212000, People’s Republic of China; 2Institute of Cardiovascular Diseases, Jiangsu University, Zhenjiang, 212001, People’s Republic of China; 3Imaging Department, Affiliated Hospital of Jiangsu University, Zhenjiang, 212000, People’s Republic of China
Correspondence: Zhongqun Wang, Email [email protected]
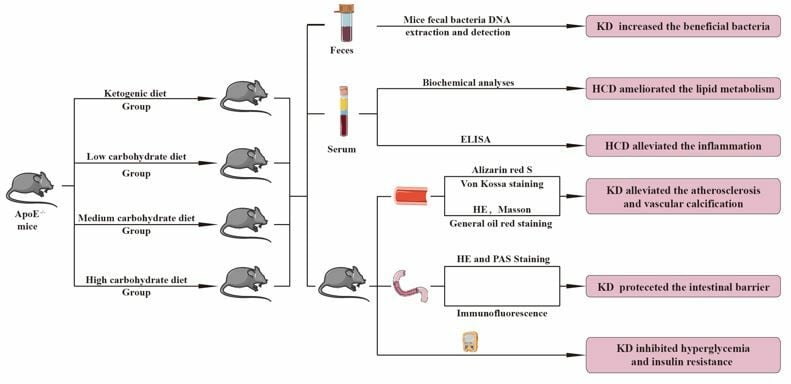
Introduction: Vascular calcification is a major cause of cardiovascular accidents in patients with type 2 diabetes mellitus. This study aimed to investigate the impact of carbohydrates on gut microbiota and aortic calcification in diabetic ApoE−/− mice.
Methods: The diabetic ApoE−/− mice were randomly divided into 4 groups: ketogenic diet group, low carbohydrate diet group, medium carbohydrate diet group, and high carbohydrate diet group. The mice were fed continuously for 6 months, with blood glucose, blood ketone and body weight monitored monthly. Lipid metabolism indicators and inflammatory factors were detected using ELISA. The intestinal barrier, atherosclerotic lesion areas, and vascular calcifications were analyzed based on their morphology. Gut microbiota was analyzed using 16S rRNA genes.
Results: We found that ketogenic diet played some roles improving glucose, lipid metabolism, and inflammation. Ketogenic diet could improve the intestinal barrier to some extent and increase intestinal bacteria. Compared to the other three groups, the relative abundance of genus Allobaculum, species Blautia producta and Clostridium Ramosum in the ketogenic diet group was significantly increased (P < 0.05), which has protective effects in diabetic ApoE−/− mice.
Conclusion: Ketogenic diet could delay the onset of aortic atherosclerosis, aortic calcification and improve intestinal barrier function in diabetic ApoE−/− mice.
Keywords: diabetes mellitus, atherosclerosis, vascular calcification, gut microbiota, low-carb diet, ketogenic diet, inflammation
Graphical Abstract:
Introduction
In 2021, an estimated 537 million adults globally had diabetes, with projections indicating a rise to 783 million by 2045.1 Vascular calcification is a prevalent complication in diabetic patients and a major contributor to cardiovascular and cerebrovascular events.2 The severity of vascular calcification is associated with an increased risk of cardiovascular incidents, stroke, and amputation in patients with type 2 diabetes mellitus (T2DM).3 Despite its several adverse consequences, there are currently no effective treatments available to delay or prevent the development of vascular calcification. Therefore, there is an urgent need to develop new strategies for its prevention and treatment.
The amount and type of dietary carbohydrates have long been controversial topics in the management of T2DM. Before the advent of insulin, most diabetes patients adopted a diet that strictly restricted carbohydrate intake and increased dietary fat intake.4,5 With the recognition of cardiovascular complications in diabetes and the discovery of insulin, patients with T2DM have adopted a high-carbohydrate diet.6 However, the prevalence of metabolic diseases has been gradually increasing, and adverse effects of high-carbohydrate diets, such as postprandial hyperglycemia, hyperinsulinemia, and lipid problems, have been reported. Accordingly, the American Diabetes Association recommended monitoring carbohydrate intake to control blood sugar.7 A low-carbohydrate, high-fat diet has gradually become an approach for controlling weight and blood glucose in T2DM patients.8 Therefore, this study was designed to investigate the long-term effects of different dietary carbohydrate levels on aortic calcification in diabetic mice.
Studies have found significant differences in gut microbiota between healthy people and T2DM patients. However, in individuals with T2DM, there is a notable increase in Proteobacteria and Bacteroidetes, accompanied by a reduction in Firmicutes and a diminished Firmicutes/Bacteroidetes ratio.9 Studies have demonstrated that, compared to healthy individuals, diabetic patients with cardiovascular complications exhibited significantly disrupted gut microbiota. Specifically, there is a marked reduction in the abundance of beneficial bacteria that are essential for maintaining normal intestinal immunity and metabolism, coupled with a significant increase in opportunistic pathogenic bacteria.10,11 Diet plays a crucial role in modulating gut microbiota composition, which can subsequently improve health.12 Research has shown that the abundance of short-chain fatty acid-producing bacteria such as Roseobacter, Gastrococcus, and Eubacterium significantly increases in type 2 diabetes patients following a ketogenic diet.13
Yi-Hsueh Liu et al have demonstrated an association between gut dysbiosis and the severity of aortic arch calcification (AoAC) in patients with chronic diseases. In patients with low AoAC, a distinct microbial community structure was observed, characterized by a significant increase in several butyrate-producing bacteria, including the genera Agathobacter, Ruminococcaceae UCG-002, Ruminococcaceae DTU089, Oscillibacter, and Butyricimonas. Conversely, the high AoAC group exhibited an increased relative abundance of the class Bacilli.14 Additionally, another study identified the enrichment of Acinetobacter in the blood as a potential risk factor for vascular calcification in chronic kidney disease.15
Therefore, it is hypothesized that gut microbiota may influence the progression of T2DM and vascular calcification, particularly through dietary interventions involving different carbohydrate compositions. This article will discuss the impact of different carbohydrate diets on T2DM and the role of intestinal microflora in this process.
Materials and Methods
Experimental Design
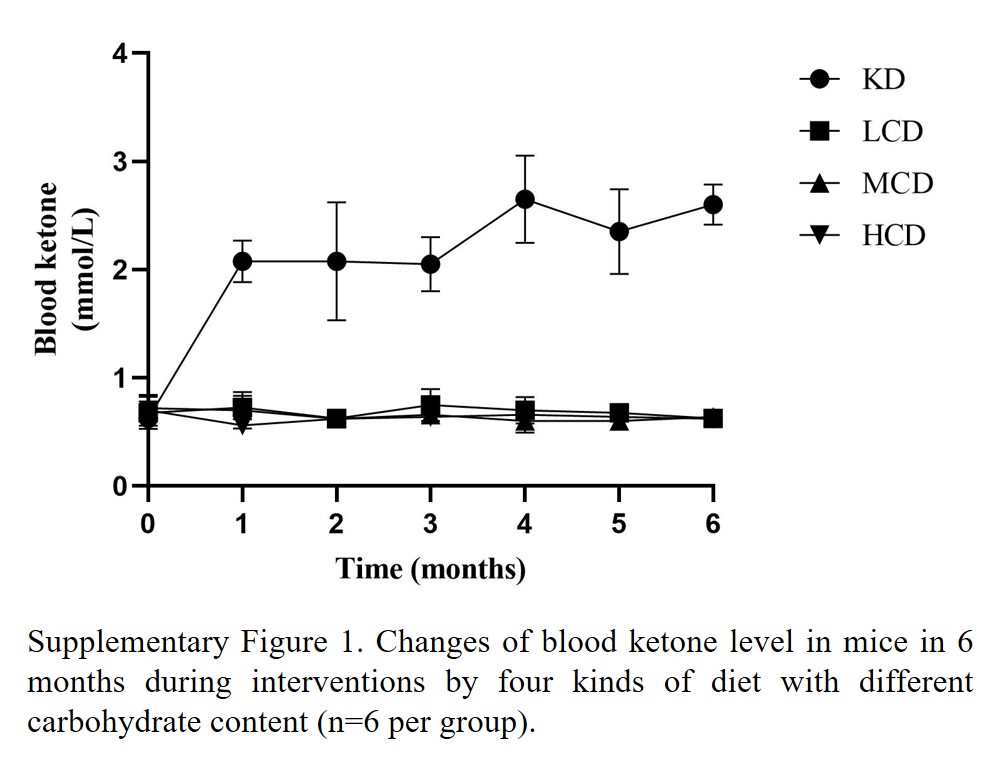
In our study, male ApoE−/− mice aged 6–8 weeks were acquired from Cavens Experimental Animals, Changzhou, China. Streptozotocin (40 mg/ (kg · d)), dissolve into citrate buffer (pH 4.2–4.5), was administered to mice for 5 days. Fourteen days later, mice with blood glucose levels of 300 mg/dl or higher were selected. A total of 24 diabetic ApoE−/− mice were randomly allocated into the following groups: ketogenic diet (no carbohydrate diet, KD group, n = 6), low-carbohydrate diet (low-carbohydrate diet, LCD group, n = 6), medium-carbohydrate diet (medium-carbohydrate diet, MCD group, n = 6), and high-carbohydrate diet (high-carbohydrate diet, HCD group, n = 6). During the feeding period, the feeding intake was adjusted to ensure equal calorie intake across all groups during the feeding period with feed and water were readily available throughout the day. The mice were weighed and blood glucose and ketone levels (Supplementary Figure 1) were measured monthly. After 6 months on their respective diets, the mice were anesthetized with isoflurane (5% concentrations). Blood, jejunum, ileum, and aorta were collected and frozen at –80°C for further analysis. These trials were approved by Jiangsu University’s Experimental Animal Use Ethics Committee and complied with Directive 2010/63/EU guidelines.
Diets
The ingredients of the diets had been shown given in Table 1. The diets were prepared using Cavens (Changzhou, China).16–18
 |
Table 1 Composition of Diets |
Insulin and Glucose Tolerance Tests
After 6 months of diet intervention, the mice were fasted overnight. Fasting serum glucose levels were measured using a glucometer (Bayer, Beijing, China) and was recorded as the baseline (time 0). Following a 30-minute acclimatization period, the diabetic mice received an intraperitoneal injection of a 20% glucose solution, with the injection volume adjusted according to their body weight (0.01 mL/g). Blood glucose levels were subsequently measured at 15, 30, 60, 90, and 120 minutes post-injection, using whole blood samples collected from the severed tail tips.
TC, TG, HDL-C, and LDL-C
To determine total cholesterol (TC), triglyceride (TG), high-density lipoprotein cholesterol (HDL-C), and low-density lipoprotein cholesterol (LDL-C) levels, we utilized the Assay Kit (Jiancheng Bioengineering, Yancheng, China) with upper serum samples. Serum homogenization was followed by the addition of specific reagents to the supernatants according to the manufacturer’s instructions. Serum lipid levels were determined by measuring absorbance and calculating values using predefined formulas.
Biochemical Analyses
The concentrations of lipopolysaccharides (LPS), trimethylamine oxide (TMAO), tumor necrosis factor-α (TNF-α), interleukin 6 (IL-6), and interleukin 1β (IL-1β) were quantified using enzyme-linked immunosorbent assay (ELISA) kits obtained from Jiangsu Meimian Industrial, Yancheng, China, following standardized protocols. Standard wells were loaded with 50μL of standard solution at varying concentrations, while sample wells received 10μL of the test sample along with 40μL of sample diluent. Subsequently, 100μL of horseradish peroxidase (HRP) labeled detection antibody was added to each well containing standards and samples. The plates were then incubated at 37°C for 60 minutes. Subsequent to incubation, each well underwent washing with washing solution five times. Following this, 50μL of substrates A and B were added to each well and incubated at 37°C for 15 minutes in the absence of light. Termination of the reaction was achieved by adding 50μL of stop solution to each well, and the optical density (OD) was measured at a wavelength of 450nm using a microplate reader.
HE and PAS Staining
The jejunal and ileal tissues were fixed in 4% paraformaldehyde and stained with hematoxylin and eosin (HE) (Beyotime Biotechnology, China) for histological examination. Lesions were assessed using the Chiu’s score.Goblet cells were identified using Periodic acid-Schiff staining (PAS) (Beyotime Biotechnology, China). For PAS staining, 100 μL of periodic acid solution was applied to tissue sections for 10 minutes in darkness, followed by a 5-minute wash. Subsequently, 100 μL of Schiff reagent was applied for 1 hour in darkness, followed by washing. Hematoxylin staining solution (100 μL) was applied for 30 seconds, followed by washing to remove excess stain. Ethanol hydrochloride differentiation solution was then applied for 30 seconds, followed by gradual rinsing until tissue blue staining was observed.
Immunofluorescence
The tissues were immersed in 4% paraformaldehyde and then embedded in paraffin. Following antigen retrieval, dewaxing, and hydration, the slides were incubated with bovine serum albumin for 30 minutes to block nonspecific binding. Subsequently, the slides were incubated overnight with the primary antibodies (Occludin, Abcam, England; Claudin-2, Wuhan Sanying, Wuhan, China), followed by a 2-hour incubation with the secondary antibody (Abways, Shanghai, China). The slides were then stained with 4’,6-diamidino-2-phenylindole (DAPI) (Sigma-Aldrich, Germany) and examined under a fluorescence microscope.
Determination of Tissue Calcification
For arterial staining, tissues were fixed in 4% formaldehyde were embedded in paraffin. Paraffin sections underwent dewaxing and were stained with Alizarin Red S staining solution (Solarbio, Beijing, China).Von Kossa staining (Solarbio, Beijing, China) was performed by adding A drop of staining solution to the sections, which were then irradiated with a UV lamp for 3 hours. The slices were subsequently immersed in double-distilled water. B drops were applied for 5 minutes to ensure complete coverage of the tissue, after which excess dye was removed. The slices were then stained with hematoxylin and eosin.
Calcium content was quantified using a commercial calcium test kit (Beyotime Biotechnology, China). The arteries were homogenized using the supernatant separated by centrifugation. The absorbance of each well was measured at 575 nm wavelength and recorded using microplate reader. The calcium ions concentration in each sample was calculated using a standard curve and a formula.
General Oil Red Staining
Excess fat and connective tissues were excised to isolate the intact aorta. The isolated aorta was then washed with PBS and immersed in 4% paraformaldehyde for 30 minutes. Subsequently, it was placed in a Petri dish and exposed to 0.3% oil red O solution (Solarbio, Beijing, China) for 6 hours. The aorta was further differentiated in 75% ethanol until it displayed a white appearance. Following rinsing with normal saline, the aorta was meticulously unfolded on black cardboard and photographed for documentation.
Mice Fecal Bacteria DNA Extraction and Detection
Fresh fecal samples from the mice were collected at 6 months and stored at −80°C. DNA was extracted from the feces using the CTAB method and diluted to 1 ng/µL. Distinct regions of the 16S rRNA genes (V3–V4) were amplified using a specific primer. The amplification reactions were conducted with Phusion® High-Fidelity PCR Master Mix (New England Biolabs), and thermal cycling was initiated. Subsequently, the PCR product was mixed with an equal volume of 1X TAE buffer, and electrophoresis was performed. The PCR products were then normalized to equal densities and purified using Universal DNA (TianGen Biotech, Beijing, China).
Sequencing libraries were generated using the NEB Next® Ultra DNA Library Prep Kit (Illumina, USA) according to the manufacturer’s recommendations with index codes added. Finally, the library quality was assessed using an Agilent 5400 instrument (Agilent Technologies, USA). and sequenced using the Illumina NovaSeq platform to generate 250 bp reads. The analysis was carried out with the “Atacama soil microbiome tutorial” of Qiime2docs along with customized program scripts (https://docs.qiime2.org/2019.1/). Reliability analysis was performed with reference to the QIIME2 tutorial, and the parameters in the analysis were all default values. The relative degree of annotation for each sample was determined using the absolute abundance of OTUs and the annotation information. ANOVA, ANCOM, linear discriminant analysis effect size (LEfSe), Kruskal Wallis, and DEseq2 were used to determine microbial communities based on differences in abundance.19,20 We evaluated community diversity using the α diversity index21 and assessed differences in microbial community structure using the β diversity index, PCoA, and NMDS diagrams.22
Statistical Analysis
The data were processed using SPSS 27.0, and plotted using GraphPadPrism9.0 software. In the normality test, data obeying a normal distribution were presented as the mean ± standard deviation (x ± s). Data with non-normal distributions were shown with medians (quartiles) [M] (P25, P75). Count data were presented as case numbers and rates. An independent sample t-test was used to compare two groups of data with normal distribution, and the Wilcoxon rank-sum test was performed to detect differences between the data with non-normal distribution. A one-way analysis of variance was used to compare multiple groups. P<0.05 was set as statistical significance.
Results
Ketogenic Diet Inhibited Hyperglycemia and Insulin Resistance
The study investigated the impact of dietary carbohydrate content on body weight and blood glucose levels. The body weight of the KD, MCD, and HCD groups showed a slight increase at the beginning of the intervention (Figure 1A), and then maintained a relatively stable level without a significant increase (P >0.05), whereas the LCD group showed an increase in body weight (P <0.01). As shown in Figure 1B, the fasting blood glucose level in the KD group was lower than that in the LCD and MCD groups (P <0.05), and significantly decreased in the HCD group (P <0.01). Blood glucose levels peaked within 30 minutes for all groups and remained elevated after 2 hours, indicating impaired glucose tolerance (Figure 1C). Compared to the KD group, the area under the curve for intraperitoneal glucose injection was significantly higher in the LCD, MCD, and HCD groups (P < 0.01).
 |
Figure 1 Effects of different carbohydrate content diets on body weight and glycometabolism. KD group: ketogenic diet group (n=6); LCD group: low-carbohydrate diet group (n=6); MCD group: medium-carbohydrate diet group (n=6); HCD group: high-carbohydrate diet group (n=6) (A) Body weight, (B) Fasting blood glucose, (C) Glucose tolerance and (D) Area under the curve of glucose tolerance test. **represents P<0.01. |
Effects of Different Carbohydrate Diet on Lipid Profile
The serum TG and LDL-C levels in the LCD group and HCD group were lower than those in the KD and MCD group (P <0.01) (Table 2). Both the MCD and KD groups had higher serum TC levels than the other groups (P <0.01). Serum HDL-C levels were lower in the MCD and KD groups than in the HCD and LCD groups (P <0.01) (Figure 2).
 |
Table 2 Effects of Carbohydrate Diet with Different Contents on Lipid Levels in Diabetic ApoE−/− Mice |
 |
Figure 2 Plasma lipids of diabetic ApoE−/− mice after 6 months of dietary intervention with different amounts of carbohydrate. KD group: ketogenic diet group (n=6); LCD group: low-carbohydrate diet group (n=6); MCD group: medium-carbohydrate diet group (n=6); HCD group: high-carbohydrate diet group (n=6) (A) Serum TC levels; (B) Serum TG levels; (C) Serum HDL-C level; (D) Serum LDL-C level; **represents P<0.01. |
High-Carbohydrate Diet Reduced the Levels of LPS, TMAO, and Inflammatory Cytokines
As shown in Figure 3, TNF-α and IL-6 levels in the KD, MCD, and LCD groups were lower than those in the HCD group (P <0.01). IL-1β expression in the KD group did not significantly differ from that in the HCD group, whereas IL-1β levels were significantly increased in the MCD group and LCD group (P <0.01). Inflammatory factor expression generally increased with higher dietary carbohydrate content, except in the HCD group (P <0.01).
 |
Figure 3 Plasma LPS, TMAO and inflammation cytokines expression after 6 months of dietary intervention with different amounts of carbohydrate. KD group: ketogenic diet group(n=9); LCD group: low-carbohydrate diet group (n=9); MCD group: medium-carbohydrate diet group (n=9); HCD group: high-carbohydrate diet group (n=9) (A) TMAO levels; (B) LPS levels; (C)TNF-α levels; (D)IL-6 levels; (E) IL-1β levels; (F)The correlation between TMAO and TNF-α levels; (G) The correlation between TMAO and IL-1β levels; (H) The correlation between TMAO and IL-6 levels; (I) the correlation between LPS and TNF-α levels; (J) The correlation between LPS and IL-1β levels; (K) The correlation between LPS and IL-6 levels; **represents P<0.01. |
Figure 3 also showed that TMAO and LPS levels were significantly higher in the KD, MCD, and LCD groups compared to the HCD group (P <0.01). In addition to the HCD group, TMAO increased as the total carbohydrate content increased, whereas LPS in the KD and LCD groups did not show obvious differences. Elevated TMAO and LPS levels were associated with increased inflammatory cytokine levels (P <0.01).
Ketogenic Diet Improved Intestinal Integrity and Increased the Tight Junction Proteins Expression
The intestinal villi of the KD group exhibited a more organized arrangement, fewer ulcers, inflammatory cell infiltrations, and smaller intervillous spaces compared to the other three groups. Chiu’s pathological scores for each group was shown in Figure 4B. Compared to the other three groups, intestinal goblet cells in the KD group showed a significant increase in both villi and crypts (P <0.05) (Figure 4C and E). Immunofluorescence analysis confirmed the expression of intestinal tight junction proteins, including transmembrane proteins (Occludin) and scaffold proteins (ZO-1) (Figure 4F). In the KD group, ZO-1 and Occludin were distributed along the surface of the intestinal mucosal epithelium in smooth, wavy lines with strong fluorescence intensity, indicating relative intestinal barrier integrity. These findings suggested that the ketogenic diet improved the expression of tight junction proteins in the intestine of diabetic mice.
 |
Figure 4 Ketogenic diet improved intestinal integrity and increased the tight junction proteins expression. KD group: ketogenic diet group; LCD group: low-carbohydrate diet group; MCD group: medium-carbohydrate diet group; HCD group: high-carbohydrate diet group (A) Intestinal HE staining (n=5) (Scale bar: 100 μm); (B) Chiu’s pathological score (n=5); (C) PAS staining (n=5); (D) Mean number of goblet cells on individual intestinal villi in random field of view(n=5); (E) Mean number of goblet cells in intestinal crypts in random field of view(n=5); (F)Immunofluorescence staining results of tight junction proteins ZO-1 and Occludin in the intestine(n=4). **represents P<0.01. |
Ketogenic Diet Improved the Beneficial Microbiota
The α diversity of the gut microbiota was assessed using Chao1, the observed features, Shannon, Simpson, and faith_pd. Microbial α diversity, assessed through Chao1, the observed features, and Shannon indices, exhibited significant variation among the four groups (Figure 5) (P <0.05). This suggested that dietary carbohydrate content may influence the structure and composition of the gut microbiota. Principal Coordinates Analysis (PCoA) and Non-metric Multidimensional Scaling (NMDS) were performed to compare differences in microbial composition (Figure 6). Differences in the beta diversity of the gut microbiota were observed among the four groups (P <0.05; Table 3). The composition of the microbiota was analyzed at both the phylum and genus levels. At the phylum level, Firmicutes, Proteobacteria, Bacteroidetes, Actinobacteria, and Deferribactere were the predominant phyla. The high-carbohydrate diet was associated with a reduction in the abundance of Firmicutes (Figure 7A and B) (P <0.05) and an increase in the richness of Bacteroidetes (P <0.01). At the genus level, Allobaculum, Unspecified_S24_7, Unspecified_Desulfovibrionaceae, Unspecified_Clostridiales, Oscillospira, and Unspecified Clostridiaceae were the major genera in all four groups of mice. Compared to the other three groups, the relative abundance of Allobaculum in the KD group was significantly increased, and the HCD group showed a significant increase in Unspecified_S24 and Unspecified_Clostridiales (Figure 7C and D) (P <0.05).
 |
Table 3 Bray Curtis ANOSIM Analysis of Gut Microbiota in Diabetic ApoE−/− Mice Treated with Different Amounts of Carbohydrate Diet Intervention |
 |
Figure 5 Effects of different carbohydrate diets on α diversity of intestinal microflora in diabetic ApoE−/− mice. KD group: ketogenic diet group (n=6); LCD group: low-carbohydrate diet group (n=6); MCD group: medium carbohydrate diet group (n=5); HCD group: high-carbohydrate diet group (n=5)(A) Simpson index; (B) Shannon index; (C) Chao1 index; (D)Shannon index; (E) Faith-pd index; * represents P<0.05, **represents P<0.01. |
 |
Figure 6 Effects of different carbohydrate diets on β diversity of intestinal microflora in diabetic ApoE−/− mice. KD group: ketogenic diet group (n=6); LCD group: low-carbohydrate diet group (n=6); MCD group: medium carbohydrate diet group (n=5); HCD group: high-carbohydrate diet group (n=5) (A) The NMDS analysis for β diversity. (B) PCoA analysis for β diversity. |
 |
Figure 7 Distribution of gut microbiota in ApoE−/− diabetic mice after dietary intervention with different carbohydrate content. KD group: ketogenic diet group (n=6); LCD group: low-carbohydrate diet group (n=6); MCD group: medium carbohydrate diet group (n=5); HCD group: high-carbohydrate diet group (n=5) (A) Stacked bar plot of the percentage of intestinal microbiota groups in ApoE−/− mice treated with four different levels of carbohydrate diets at the phylum level (B) Comparison of the top four intestinal microflora among four groups of diabetic ApoE−/− mice with different amounts of carbohydrate diet intervention at the phylum level; (C) Stacked bar plot of the percentage of intestinal microbiota groups in ApoE−/− mice treated with four different levels of carbohydrate diets at the genus level (D) Comparison of the top four intestinal microflora among four groups of diabetic ApoE−/− mice with different amounts of carbohydrate diet intervention at the genus level. * represents P<0.05, **represents P<0.01. |
Linear discriminant analysis Effect Size (LEfSe) analysis was used to identify significant biomarkers in each group. We found that the phylum Firmicutes was enriched in the KD group according to an LDA threshold larger than two. The other three groups had a higher relative abundance of potentially pathogenic bacteria, including the genera Mucispirillum, genera Desulfovibrio, genera Anaeroplasma, as well as species Ruminococcus gnavus and Mucispirillum schaedleri (Figure 8).
 |
Figure 8 Significance analysis of intestinal microflora species level in ApoE−/− diabetic mice with different carbohydrate contents after intervention. KD group: ketogenic diet group (n=6); LCD group: low-carbohydrate diet group (n=6); MCD group: medium carbohydrate diet group (n=5); HCD group: high-carbohydrate diet group (n=5) (A) Species level LEfSe algorithm analysis of gut microbiota of diabetic ApoE−/− mice under four different carbohydrate diets; (B) Species level LEfSe algorithm analysis of gut microbiota in ApoE−/− mice treated with four different carbohydrate diets. |
Ketogenic Diet Could Alleviate the Atherosclerosis and Vascular Calcification
To investigate the impact of reducing dietary carbohydrates on atherosclerosis, we fed mice the above diets. We found that higher dietary carbohydrate content was associated with increased lesion size in the aortic arch and whole aorta (P <0.05) (Figure 9A and C). Additionally, the lesion area in the aorta, as detected by HE and Masson staining, increased with higher dietary carbohydrate content (Figure 9D and F). Notably, plaques in the MCD and HCD groups nearly occluded the vascular lumen significantly more than in the KD and LCD groups (P <0.05).
 |
Figure 9 Aortic atherosclerosis in different groups of diabetic ApoE−/− mice after 6 months of intervention with different content of carbohydrate diet. KD group: ketogenic diet group (n=3); LCD group: low-carbohydrate diet group (n=3); MCD group: medium-carbohydrate diet group (n=3); HCD group: high-carbohydrate diet group (n=3) (A) Macroscopic view of aorta of diabetic ApoE−/−mice treated with four different carbohydrate diets; (B) Oil red in aorta of diabetic ApoE−/− mice fed with four different carbohydrate diets; (C) Oil red plaque area of aorta in four groups of diabetic ApoE−/− mice with different carbohydrate content diet intervention; (D) HE staining of local aorta of diabetic ApoE−/− mice treated with four different carbohydrate diets (scale bar: first row 200 μm; Second row: 20 μm); (E) Masson staining of local aorta of diabetic ApoE−/− mice treated with four different carbohydrate diets (scale bar: first row 200 μm; Second row: 20 μm); (F) lumen area of aortic plaque in diabetic ApoE−/− mice treated with four different carbohydrate diets; **represents P<0.01. |
After 6 months of dietary intervention, vascular tissue calcium content was significantly higher in the MCD and HCD groups compared to the LCD and KD groups (Figure 10A) (P <0.01). Von kossa and Alizarin Red staining were used to analyze calcification of the aortic plaque. As shown in Figure 10B, the black and dark red substances represented the calcium salt deposits. In the KD and LCD groups, calcium salt deposits were mainly deposited in the tunica media of the vessel wall, and a few calcifications were observed in plaques in the LCD group. In the MCD and HCD groups, calcification mostly accumulated in plaques. The plaques in the MCD group were mostly scattered calcifications, while those in the HCD group were more clump-like and interconnected, appearing linear or flaky (Figure 10B and C). These findings emphasized the role of dietary carbohydrate content in vascular calcification in diabetic mice.
 |
Figure 10 Aortic calcification in different groups of diabetic ApoE−/− mice after 6 months of different content of carbohydrate diet intervention. KD group: ketogenic diet group (n=3); LCD group: low-carbohydrate diet group (n=3); MCD group: medium-carbohydrate diet group (n=3); HCD group: high-carbohydrate diet group (n=3) (A) Determination of aortic calcium content in four groups of diabetic ApoE−/− mice fed with different carbohydrate diets; (B) Von Kossa staining of local aorta in diabetic ApoE−/−mice treated with four different carbohydrate diets (scale bar: first row 200 μm; Second row: 20 μm); (C) Alizarin red staining of local aorta of diabetic ApoE−/− mice treated with four different carbohydrate diets (scale scale: first row 200 μm; Second row: 20 μm);*represents P<0.05, **represents P<0.01. |
The Relationships Among the Gut Microbiota, Atherosclerosis, and Vascular Calcification
For the correlation analysis, we examined the relationships among gut microbiota, atherosclerosis, and vascular calcification at the genus and species levels (Figure 11). At the phylum level, atherosclerotic areas of the aorta were significantly positively correlated with Anaeroplasma and Mucispirillum and negatively correlated with Halomonas and Allobaculum. The calcium content of the aorta was positively correlated with Coprococcus, Gemella, Anaeroplasma, and Coprobacillus, and negatively correlated with Sutterella and Allobaculum. At the species level, atherosclerotic areas of the aorta were positively correlated with Dorea longicatena and negatively correlated with Lactobacillus reuteri and Clostridium symbiosum. These correlations suggested a complex interaction between gut microbiota composition and the development of atherosclerosis and vascular calcification.
 |
Figure 11 Analysis of the relationships among the gut microbiota, atherosclerosis and vascular calcification. KD group: ketogenic diet group (n=3); LCD group: low-carbohydrate diet group (n=3); MCD group: medium-carbohydrate diet group (n=3); HCD group: high-carbohydrate diet group (n=3) (A) Heatmap of correlations at the genus level; (B) Heatmap of correlations at the species level. |
Discussion
In this study, we investigated the influence of dietary carbohydrates on the intestinal barrier, lipid and glucose metabolism, and development of atherosclerosis and vascular calcification in ApoE−/− mice.
First, we investigated the influence of dietary carbohydrates on metabolic parameters in mice with T2DM. Our findings indicated that the ketogenic diet significantly reduced the area under the glucose curve and fasting glucose levels, suggesting improvements in glucose tolerance and overall glycemic control in diabetic mice. Furthermore, the low-carbohydrate diet also showed a beneficial effect on blood glucose control compared to medium-carbohydrate and high-carbohydrate diets. Therefore, reducing dietary carbohydrate content may be beneficial for the management of T2DM. The serum TC and TG levels in the KD and MCD groups were higher than those in the other two groups, which may be related to the high-fat content in the ketogenic diet. De novo lipogenesis, primarily occurring in the liver and adipose tissue, is considered a secondary mechanism for maintaining triglyceride stability in serum. Previous studies have demonstrated that high-carbohydrate diets can lead to increased hepatic fat accumulation, contributing to hypertriglyceridemia.23,24 Therefore, we speculated that while a high-carbohydrate diet would not increase serum triglyceride levels, it could induce hepatic steatosis, exacerbate insulin resistance, and result in persistent hyperglycemia and severe complications.
In our study, we investigated the effects of varying dietary carbohydrate levels on serum inflammatory factors and their influence on the intestinal barrier and related metabolic parameters in ApoE−/− mice. We observed that the HCD group exhibited lower levels of inflammatory factors compared to the other groups. This reduction may be attributed to the diet’s primary carbohydrate source, corn starch, which is known for its anti-inflammatory properties. Compared to the LCD and MCD groups, inflammatory factors in the KD group were reduced, which may be related to ketone bodies. The production of ketone bodies is associated with the release of mitochondrial reactive oxygen species (ROS) enhancing. ROS and the initial rise in proinflammatory mediators stimulate cells to initiate adaptive defense responses, enhancing cellular protection mechanisms. These responses include upregulation of antioxidant and anti-inflammatory activities, as well as activation of cellular repair and regeneration processes.25 The LCD group also showed lower inflammatory factors which may be related to the highest concentrations of HDL-C. Reduced HDL-C levels are associated with various chronic inflammatory conditions, including hypertension,26 liver steatosis,27 thyroiditis,28 metabolic syndrome,29 prediabetic syndromes,30 T2DM,31 new onset diabetes,32 and diabetic kidney disease.33 Anti-inflammatory effects of HDL-C are primarily due to its role in down-regulating inflammation within the atherosclerotic plaques.34
We explored the effect of dietary carbohydrates on the intestinal barrier, which is important for maintaining homeostasis. The intestinal barrier consists of mechanical, chemical, biological, and immune components. Specifically, the mechanical barrier refers to the physical and anatomical barrier of the intestinal mucosa, including the mucous membrane, intestinal epithelium, tight junctions, and submucosal lamina propria.35 In this study, HE staining revealed that the KD group had smaller and longer villi with minimal loss. The intestinal epithelium, composed of enterocytes, Paneth cells, and goblet cells, forms a mechanical barrier through tight junctions, adhesion junctions, and desmosomes. Tight junctions, located apically, consist of Occludin, Claudin, ZO-1, and junction adhesion molecules (JAMs), which protect against bacterial and toxin diffusion.36–38 Occludin is crucial for barrier integrity and is downregulated in intestinal inflammatory diseases.39 Claudins regulate the paracellular space and have several isoforms, each with distinct roles. Claudin-1 is widely expressed in the intestinal epithelial cells and is involved in the formation of the intestinal epithelial barrier.40 ZO-1 has multiple domains dedicated to protein interactions, which form a scaffold that unites proteins at tight junctions and constitutes a stable linkage system.41 Our study found that claudin-1, occludin, and ZO-1 levels were significantly higher in the KD group, suggesting that high dietary carbohydrate proportions may impair the intestinal mechanical barrier.
The intestinal mucosa is affected by gastric acid, bile, chemical barrier mucus, and gastrointestinal gastrointestinal enzyme secretion. Mucus aids in bacterial clearance via peristalsis and its components bolster intestinal antibacterial properties. Goblet cells secrete mucus, glycoproteins, and other compounds, contributing to the maintenance of the epithelial environment.42 The KD group demonstrated a significant increase in crypt and villus goblet cells compared to the other groups, indicating that the ketogenic diet could augment the intestinal goblet cell population and enhance mucosal integrity.
The intestinal flora serves as a crucial biological barrier within the intestinal mucosa, actively inhibiting the proliferation of pathogens. Imbalances in the microbiota can lead to a reduction in beneficial microorganisms and an increase in harmful ones, potentially contributing to the development of various diseases, including metabolic and cardiovascular diseases.43 In this study, the HCD group demonstrated a higher relative abundance of Bacteroidetes compared to the other groups, while Firmicutes were the characteristic flora of the KD group. Bacteroidetes, the predominant intestinal bacteria, play a significant role in carbohydrate metabolism, whereas Firmicutes are the main producers of SCFAs.44 At the genus level, Allobaculum significantly increased in the KD group. Allobaculum, a vital bacterium in SCFA production, contributes significantly to maintaining the integrity of the intestinal barrier and the development of the intestinal immune system.45 The characteristic bacterial genus of the MCD group was Mucispirillum, which was positively associated with the presence atherosclerotic plaque area.46 At the species level, there was an increased relative abundance of Blautia producta and Clostridium ramosum in the KD group. Clostridium Ramosum is an anaerobic spore-forming gram-positive bacterium that promotes 5-hydroxytryptamine secretion and modulates intestinal secretion and inflammation.47 Blautia producta, a group of mucosal bacteria, is considered a potential next-generation probiotics.48,49 Based on these findings, we hypothesized that the KD could protect diabetic mice by improving the integrity of intestinal barrier and increasing the number of beneficial bacteria.
Vascular calcification is a process in which smooth muscle cells transform into osteogenesis or chondroblast phenotypes under the influence of various pathological factors, resulting in abnormal deposition of calcium salts in the vascular wall.50 Impaired vascular elasticity, compliance, and media calcification are independent predictors of cardiovascular mortality, exacerbating each other in a self-perpetuating cycle.51 Therefore, vascular calcification is closely associated with cardiovascular diseases.
In our study, after 6 months of dietary intervention, we observed a gradual increase in vascular plaque formation and calcification in diabetic mice as the carbohydrate content of their diet increased. In our study, the abundance of bacteria producing SCFAs increased in the KD group. One study found that feeding ApoE−/− mice a diet with 1% butyrate for 10 weeks reduced aortic atherosclerosis by 50%, decreased macrophage infiltration, and increased collagen deposition. These effects may be due to reduced activation of CD36, proinflammatory cytokines, and NF-κB signaling in macrophages and endothelial cells.52 Vascular smooth muscle cells (VSMCs) proliferation is important for the development of atherosclerosis. Several studies have demonstrated that butyrate prevents atherosclerosis by inhibiting VSMCs proliferating.53,54 Butyrate, along with propionate, can enter cells through passive transport and act as potent inhibitors of histone deacetylases (HDACs), thereby promoting histone acetylation. HDAC9, a Class II HDAC, plays a significant role in regulating gene expression by acetylating histones 3 and 4, which are implicated in cardiovascular disease. A previous genome-wide association analysis has confirmed a positive association between HDAC9 expression and the degree of atherosclerotic aortic calcification. Notably, depletion of HDAC9 has been shown to reduce aortic calcification in a mouse model of Gla deficiency. Recent research suggested that β-hydroxybutyric acid, a metabolite of ketone bodies, could inhibit vascular calcification by specifically targeting HDAC9.55,56 Consequently, we hypothesize that KD may delay the progression of vascular calcification and atherosclerosis in individuals with T2DM by increasing the content of SCFAs. In the study, we aimed to elucidate the effects of diets with varying carbohydrate content on atherosclerosis and vascular calcification in patients with T2DM, specifically examining the role of gut microbiota in these processes. This research seeked to provide new insights into mitigating the progression of vascular calcification through interventions such as dietary modifications or fecal microbiota transplantation.
Conclusions
This study mainly explored the impact of different carbohydrate diets in glucolipid metabolism, intestinal barrier function, and vascular calcification in diabetes progression. The ketogenic diet was correlated with weight loss, enhanced glucose tolerance, decreased blood sugar levels, and mitigated inflammation. Moreover, the ketogenic diet could improve the intestinal barrier and increase the number of intestinal bacteria, which had protective effect on diabetic ApoE−/− mice. Additionally, the diet can delay the development of atherosclerosis of aorta and calcification of blood vessel in diabetic ApoE−/− mice.
Institutional Review Board Statement
The animal study protocol was approved by the Institutional Animal Ethics Committee of Jiangsu University.
Data Sharing Statement
Data are available if requested.
Acknowledgments
The Figures were partly generated using Servier Medical Art, provided by Servier, licenced under Creative Commons Attribution 3.0, unported license.
Author Contributions
All authors played the significant roles in the all fields of the work such as in conception, study design, execution, data acquisition, analysis, and interpretation. Besides they also took part in drafting, revising, or critically reviewing the article and provided final approval for the version for publication. Each author approved the journal that the article was submitted to and agreed to be responsible for all aspects of the work.
Funding
This work was supported by the National Natural Science Foundation of China (grant numbers 82370457 and 82070455) and Key R&D projects of Jiangsu Provincial Department of Science and Technology (grant number BE2022780).
Disclosure
The authors declare no conflicts of interest in this work.
References
1. International Diabetes Federation. IDF Diabetes Atlas, 10th Edn. Brussels, Belgium: International Diabetes Federation; 2021.
2. Fox KAA, Metra M, Morais J, Atar D. The myth of ‘stable’ coronary artery disease. Nat Rev Cardiol. 2020;17(1):9–21. doi:10.1038/s41569-019-0233-y
3. Qian Y, Li L, Sun Z, Liu J, Yuan W, Wang Z. A multi-omics view of the complex mechanism of vascular calcification. Biomed Pharmacothe. 2021;135:111192. doi:10.1016/j.biopha.2020.111192
4. Khazrai YM, Defeudis G, Pozzilli P. Effect of diet on type 2 diabetes mellitus: a review. Diabetes/Metab Res Rev. 2014;30(Suppl 1):24–33. doi:10.1002/dmrr.2515
5. Sawyer L, Gale EA. Diet, delusion and diabetes. Diabetologia. 2009;52(1):1–7. doi:10.1007/s00125-008-1203-9
6. Liu YS, Wu QJ, Lv JL, et al. Dietary carbohydrate and diverse health outcomes: umbrella review of 30 systematic reviews and meta-analyses of 281 observational studies. Frontiers in Nutrition. 2021;8:670411. doi:10.3389/fnut.2021.670411
7. Bantle JP, Wylie-Rosett J, Albright AL, et al.; American Diabetes Association. Nutrition recommendations and interventions for diabetes: a position statement of the American diabetes association. Diabetes Care. 2008;31 Suppl 1:S61–S78. doi:10.2337/dc08-S061
8. Tandon N, Gupta Y, Kapoor D, et al. LIVING Collaborative Group. Effects of a lifestyle intervention to prevent deterioration in glycemic status among South Asian women with recent gestational diabetes: a randomized clinical trial. JAMA network open. 2022;5(3):e220773. doi:10.1001/jamanetworkopen.2022.0773
9. Ye J, Wu Z, Zhao Y, Zhang S, Liu W, Su Y. Role of gut microbiota in the pathogenesis and treatment of diabetes mullites: advanced research-based review. Front Microbiol. 2022;13:1029890. doi:10.3389/fmicb.2022.1029890
10. Sharma S, Tripathi P. Gut microbiome and type 2 diabetes: where we are and where to go? J Nutr Biochem. 2019;63:101–108. doi:10.1016/j.jnutbio.2018.10.003
11. Yang G, Wei J, Liu P, et al. Role of the gut microbiota in type 2 diabetes and related diseases. Metabolism. 2021;117:154712. doi:10.1016/j.metabol.2021.154712
12. Zmora N, Suez J, Elinav E. You are what you eat: diet, health and the gut microbiota. Nat Rev Gastroenterol Hepatol. 2019;16(1):35–56.
13. Deledda A, Palmas V, Heidrich V, et al. Dynamics of gut microbiota and clinical variables after ketogenic and Mediterranean diets in drug-naïve patients with type 2 diabetes mellitus and obesity. Metabolites. 2022;12(11):1092. doi:10.3390/metabo12111092
14. Liu YH, Peng P, Hung WC, et al. Comparative gut microbiome differences between high and low aortic arch calcification score in patients with chronic diseases. Int J Mol Sci. 2023;24(6):5673. doi:10.3390/ijms24065673
15. Sun M, Fang Y, Zheng J, et al. Role of symbiotic microbiota dysbiosis in the progression of chronic kidney disease accompanied with vascular calcification. Front Pharmacol. 2024;14:1306125. doi:10.3389/fphar.2023.1306125
16. Kirkpatrick CF, Bolick JP, Kris-Etherton PM, et al. Review of current evidence and clinical recommendations on the effects of low-carbohydrate and very-low-carbohydrate (including ketogenic) diets for the management of body weight and other cardiometabolic risk factors: a scientific statement from the national lipid association nutrition and lifestyle task force. J Clini Lipid. 2019;13(5):689–711.e1. doi:10.1016/j.jacl.2019.08.003
17. Feinman RD, Pogozelski WK, Astrup A, et al. Dietary carbohydrate restriction as the first approach in diabetes management: critical review and evidence base. Nutrition. 2015;31(1):1–13. doi:10.1016/j.nut.2014.06.011
18. Accurso A, Bernstein RK, Dahlqvist A, et al. Dietary carbohydrate restriction in type 2 diabetes mellitus and metabolic syndrome: time for a critical appraisal. Nutr Metab. 2008;5(1):9. doi:10.1186/1743-7075-5-9
19. Ijoma GN, Nkuna R, Mutungwazi A, et al. Applying PICRUSt and 16S rRNA functional characterisation to predicting co-digestion strategies of various animal manures for biogas production. Sci Rep. 2021;11(1):19913. doi:10.1038/s41598-021-99389-4
20. Wilkinson TJ, Huws SA, Edwards JE, et al. CowPI: a rumen microbiome focussed version of the PICRUSt functional inference software. Front Microbiol. 2018;9:1095. doi:10.3389/fmicb.2018.01095
21. Zhou C, Wang H, Zhao H, et al. fastANCOM: a fast method for analysis of compositions of microbiomes. Bioinformatics (Oxford, England). Bioinformatics (Oxford England) 2022;387:2039–2041. doi:10.1093/bioinformatics/btac060
22. Liu S, Wang Z, Zhu R, et al. Three differential expression analysis methods for RNA sequencing: limma, edgeR, DESeq2. J vis exp. 2021;175:
23. Schwarz J-M, Linfoot P, Dare D, Aghajanian K. Hepatic de novo lipogenesis in normoinsulinemic and hyperinsulinemic subjects consuming high-fat, low-carbohydrate and low-fat, high-carbohydrate isoenergetic diets. American J Clini Nutri. 2003;77(1):43–50. doi:10.1093/ajcn/77.1.43
24. Strable MS, Ntambi JM. Genetic control of de novo lipogenesis: role in diet-induced obesity. Crit Rev Biochem Mol Biol. 2010;45(3):199–214. doi:10.3109/10409231003667500
25. Kolb H, Kempf K, Röhling M, Lenzen-Schulte M, Schloot NC, Martin S. Ketone bodies: from enemy to friend and guardian angel. BMC Med. 2021;19(1):313. doi:10.1186/s12916-021-02185-0
26. Aktas G, Khalid A, Kurtkulagi O, et al. Poorly controlled hypertension is associated with elevated serum uric acid to HDL-cholesterol ratio: a cross-sectional cohort study. Postgraduate Med. 2022;134(3):297–302. doi:10.1080/00325481.2022.2039007
27. Kosekli MA, Kurtkulagii O, Kahveci G, et al. The association between serum uric acid to high density lipoprotein-cholesterol ratio and non-alcoholic fatty liver disease: the abund study. Revista da Associacao Medica Brasileira. 2021;67(4):549–554. doi:10.1590/1806-9282.20201005
28. Kurtkulagi O, Tel BMA, Kahveci G, et al. Hashimoto’s thyroiditis is associated with elevated serum uric acid to high density lipoprotein-cholesterol ratio. Rom J Intern Med. 2021;59(4):403–408. doi:10.2478/rjim-2021-0023
29. Kocak MZ, Aktas G, Erkus E, Sincer I, Atak B, Duman T. Serum uric acid to HDL-cholesterol ratio is a strong predictor of metabolic syndrome in type 2 diabetes mellitus. Revista da Associação Médica Brasileira. 2019;65(1):9–15. doi:10.1590/1806-9282.65.1.9
30. Balci SB, Atak BM, Duman T, Ozkul FN, Aktas G. A novel marker for prediabetic conditions: uric acid-to-HDL cholesterol ratio. Bratisl Lek Listy. 2024;125(3):145–148. doi:10.4149/BLL_2023_130
31. Aktas G, Kocak MZ, Bilgin S, Atak BM, Duman TT, Kurtkulagi O. Uric acid to HDL cholesterol ratio is a strong predictor of diabetic control in men with type 2 diabetes mellitus. Aging Male. 2020;23(5):1098–1102. doi:10.1080/13685538.2019.1678126
32. Kosekli MA, Aktas G. SERUM URIC ACID TO HDL CHOLESTEROL RATIO IS ASSOCIATED WITH DIABETIC CONTROL IN NEW ONSET TYPE 2 DIABETIC POPULATION. Acta clinica Croatica. 2023;62(2):277–282. doi:10.20471/acc.2023.62.02.04
33. Aktas G, Yilmaz S, Kantarci DB, et al. Is serum uric acid-to-HDL cholesterol ratio elevation associated with diabetic kidney injury? Postgraduate Med. 2023;135(5):519–523. doi:10.1080/00325481.2023.2214058
34. Franczyk B, Rysz J, Ławiński J, Rysz-Górzyńska M, Gluba-Brzózka A. Is a high HDL-cholesterol level always beneficial? Biomedicines. 2021;9(9):1083. doi:10.3390/biomedicines9091083
35. Feldman GJ, Mullin JM, Ryan MP. Occludin: structure, function and regulation. Adv Drug Delivery Rev. 2005;57(6):883–917. doi:10.1016/j.addr.2005.01.009
36. Tsukita S, Furuse M. Occludin and claudins in tight-junction strands: leading or supporting players? Trends Cell Biol. 1999;9(7):268–273. doi:10.1016/S0962-8924(99)01578-0
37. Hao W, Hao C, Wu C, Xu Y, Jin C. Aluminum induced intestinal dysfunction via mechanical, immune, chemical and biological barriers. Chemosphere. 2022;288(Pt 2):132556. doi:10.1016/j.chemosphere.2021.132556
38. Chelakkot C, Ghim J, Ryu SH. Mechanisms regulating intestinal barrier integrity and its pathological implications. Exp. Mol. Med. 2018;50(8):1–9. doi:10.1038/s12276-018-0126-x
39. Nishii N, Oshima T, Li M, et al. Lubiprostone induces claudin-1 and protects intestinal barrier function. Pharmacology. 2020;105(1–2):102–108. doi:10.1159/000503054
40. Anderson JM, Fanning AS, Lapierre L, Van Itallie CM. Zonula occludens (ZO)-1 and ZO-2: membrane-associated guanylate kinase homologues (MAGuKs) of the tight junction. Biochem Soc Trans. 1995;23(3):470–475. doi:10.1042/bst0230470
41. Zhang J, Zhu S, Ma N, Johnston LJ, Wu C, Ma X. Metabolites of microbiota response to tryptophan and intestinal mucosal immunity: a therapeutic target to control intestinal inflammation. Med Res Rev. 2021;41(2):1061–1088. doi:10.1002/med.21752
42. Yang YN, Wang QC, Xu W, Yu J, Zhang H, Wu C. The berberine-enriched gut commensal Blautia producta ameliorates high-fat diet (HFD)-induced hyperlipidemia and stimulates liver LDLR expression. Biomed Pharmacothe. 2022;155:113749. doi:10.1016/j.biopha.2022.113749
43. Larsen N, Vogensen FK, van den Berg FW, et al. Gut microbiota in human adults with type 2 diabetes differs from non-diabetic adults. PLoS One. 2010;5(2):e9085. doi:10.1371/journal.pone.0009085
44. Anavi-Cohen S, Tsybina-Shimshilashvili N, Zandani G, et al. Effects of high oleic acid peanuts on mice’s liver and adipose tissue metabolic parameters and gut microbiota composition. Frontiers in Nutrition. 2023;10:1205377. doi:10.3389/fnut.2023.1205377
45. Goldberg JB, Hancock RE, Parales RE, Loper J, Cornelis P. Pseudomonas 2007. J Bacteriol. 2008;190(8):2649–2662. doi:10.1128/JB.01950-07
46. Liu X, Guo W, Cui S, et al. A comprehensive assessment of the safety of blautia producta DSM 2950. Microorganisms. 2021;9(5):908. doi:10.3390/microorganisms9050908
47. Qin W, Xu B, Chen Y, et al. Dietary ellagic acid supplementation attenuates intestinal damage and oxidative stress by regulating gut microbiota in weanling piglets. Animal Nutri. 2022;11:322–333. doi:10.1016/j.aninu.2022.08.004
48. Cani PD, Depommier C, Derrien M, Everard A, de Vos WM. Akkermansia muciniphila: paradigm for next-generation beneficial microorganisms. Nat Rev Gastroenterol Hepatol. 2022;19(10):625–637. doi:10.1038/s41575-022-00631-9
49. Doherty TM, Asotra K, Fitzpatrick LA, et al. Calcification in atherosclerosis: bone biology and chronic inflammation at the arterial crossroads. Proc Natl Acad Sci USA. 2003;100(20):11201–11206. doi:10.1073/pnas.1932554100
50. Otsuka F, Yasuda S, Noguchi T, Ishibashi-Ueda H. Pathology of coronary atherosclerosis and thrombosis. Cardio Diag Thera. 2016;6(4):396–408. doi:10.21037/cdt.2016.06.01
51. Van den Bergh G, Opdebeeck B, D’Haese PC, Verhulst A. The vicious cycle of arterial stiffness and arterial media calcification. Trends Mol Med. 2019;25(12):1133–1146. doi:10.1016/j.molmed.2019.08.006
52. Hu T, Wu Q, Yao Q, Jiang K, Yu J, Tang Q. Short-chain fatty acid metabolism and multiple effects on cardiovascular diseases. Ageing Res Rev. 2022;81:101706. doi:10.1016/j.arr.2022.101706
53. Yang F, Xia N, Guo S, et al. Propionate alleviates abdominal aortic aneurysm by modulating colonic regulatory T-Cell expansion and recirculation. JACC. 2022;7(9):934–947. doi:10.1016/j.jacbts.2022.05.001
54. van Zuydam NR, Stiby A, Abdalla M, et al. Genome-wide association study of peripheral artery disease. Circulation: Genomic and Precision Medicine. 2021;14(5):e002862. doi:10.1161/CIRCGEN.119.002862
55. Lecce L, Xu Y, V’Gangula B, et al. Histone deacetylase 9 promotes endothelial-mesenchymal transition and an unfavorable atherosclerotic plaque phenotype. J Clin Invest. 2021;131(15):e131178. doi:10.1172/JCI131178
56. Lan Z, Chen A, Li L, et al. Downregulation of HDAC9 by the ketone metabolite β-hydroxybutyrate suppresses vascular calcification. J Pathol. 2022;258(3):213–226. doi:10.1002/path.5992
 © 2024 The Author(s). This work is published and licensed by Dove Medical Press Limited. The
full terms of this license are available at https://www.dovepress.com/terms.php
and incorporate the Creative Commons Attribution
- Non Commercial (unported, v3.0) License.
By accessing the work you hereby accept the Terms. Non-commercial uses of the work are permitted
without any further permission from Dove Medical Press Limited, provided the work is properly
attributed. For permission for commercial use of this work, please see paragraphs 4.2 and 5 of our Terms.
© 2024 The Author(s). This work is published and licensed by Dove Medical Press Limited. The
full terms of this license are available at https://www.dovepress.com/terms.php
and incorporate the Creative Commons Attribution
- Non Commercial (unported, v3.0) License.
By accessing the work you hereby accept the Terms. Non-commercial uses of the work are permitted
without any further permission from Dove Medical Press Limited, provided the work is properly
attributed. For permission for commercial use of this work, please see paragraphs 4.2 and 5 of our Terms.
Recommended articles
Identification and Validation of Immune-Related Genes Diagnostic for Progression of Atherosclerosis and Diabetes
Fu Y, Xu L, Zhang H, Ding N, Zhang J, Ma S, Yang A, Hao Y, Gao Y, Jiang Y
Journal of Inflammation Research 2023, 16:505-521
Published Date: 10 February 2023
Research Progress and Molecular Mechanisms of Endothelial Cells Inflammation in Vascular-Related Diseases
Xue J, Zhang Z, Sun Y, Jin D, Guo L, Li X, Zhao D, Feng X, Qi W, Zhu H
Journal of Inflammation Research 2023, 16:3593-3617
Published Date: 23 August 2023
Association Between Thyroid Parameters and Subclinical Atherosclerosis in Hospitalised Euthyroid Patients with Type 2 Diabetes Mellitus
Du J, Zhao X, Xu X, Zhang Z, Zhang X
Diabetes, Metabolic Syndrome and Obesity 2023, 16:3163-3171
Published Date: 12 October 2023