")
Back to Journals » Clinical, Cosmetic and Investigational Dermatology » Volume 17
Effects of Photodynamic Therapy Using 5 -Aminolevulinic Acid (ALA) Loaded Acrylic Nanoparticles (ANPs) on HaCaT Cells
Authors Ge K , Zhao Y , Liu X, Zhang R
Received 8 January 2024
Accepted for publication 26 May 2024
Published 31 May 2024 Volume 2024:17 Pages 1297—1308
DOI https://doi.org/10.2147/CCID.S458525
Checked for plagiarism Yes
Review by Single anonymous peer review
Peer reviewer comments 3
Editor who approved publication: Dr Jeffrey Weinberg
Kang Ge,1,2 Yilu Zhao,2,3 Xiao Liu,4 Ruzhi Zhang5
1Jiaxing Key Discipline of Medicine --Dermatology and Venereology, The Affiliated Hospital of Jiaxing University, The First Hospital of Jiaxing, Jiaxing, Zhejiang, People’s Republic of China; 2Department of Dermatology, The First Affiliated Hospital of Bengbu Medical University, Bengbu, Anhui, People’s Republic of China; 3Department of Dermatology, The Third Affiliated Hospital of Soochow University, Changzhou, Jiangsu, People’s Republic of China; 4School of Materials Science and Engineering, Changzhou University, Changzhou, Jiangsu, People’s Republic of China; 5Department of Dermatology and STD, The Second Affiliated Hospital of Wannan Medical College, Wuhu, Anhui, People’s Republic of China
Correspondence: Ruzhi Zhang, Department of Dermatology and STD, The Second Affiliated Hospital of Wannan Medical College, Wuhu, Anhui, 241001, People’s Republic of China, Tel +8618761161826, Email [email protected]
Objective: ALA-PDT (5-aminolevulinic acid photodynamic therapy) is a central modality in the treatment of skin diseases. Increasing the bioavailability of ALA remains a critical issue. With this in mind, our study explores a novel route of ALA delivery by loading acrylic nanoparticles (ANPs).
Methods: ALA-ANPs were synthesized by emulsion polymerisation and characterised by scanning electron microscopy (SEM), transmission electron microscopy (TEM) and nanoparticle tracking analysis (NTA). The effects of ALA-ANPs on HaCaT cell line were evaluated, including characteristics, morphological changes, protoporphyrin IX (PpIX) fluorescence kinetics, reactive oxygen species (ROS) levels, mitochondrial membrane potential and ki67 expression in these cells.
Results: The ANPs had uniform sizes, smooth surfaces and excellent light transmittance, with diameters of 150– 200 nm. In contrast, the ALA - ANPs had uneven surfaces and poor light transmittance, with diameters of 220– 250 nm. During 12 hours of co-incubation of HaCaT cells with ALA, the intracellular accumulation of PpIX increased over time. Notably, after 6 hours of incubation, PpIX levels induced by 1.81 mg/mL ALA-ANPs exceeded those induced by 1.0 mM ALA (p < 0.01). CCK-8 results showed a positive correlation between PDT-induced inhibition of HaCaT cell proliferation and ALA concentration when ALA concentration remained below 2.0 mM. Compared to the 1.0 mM ALA group, the 1.81 mg/mL ALA-ANPs group showed decreased mitochondrial membrane potential, ki67 immunofluorescence intensity and cell proliferation. In contrast, ROS levels were significantly increased in the 1.81 mg/mL ALA-ANPs group (p < 0.01).
Conclusion: Loading ANPs provide improved stability and potency for ALA. The ALA-ANPs-PDT approach has superior inhibitory effects on HaCaT proliferation in vitro.
Keywords: 5-aminophenolvalic acid, ALA, acrylate nanoporous, photodynamic therapy
Introduction
Photodynamic therapy (PDT), a clinical modality, uses visible light to activate photosensitizers (PSs) that induce a cascade of photochemical reactions within targeted cells.1 ALA and MAL are the most commonly used PSs. ALA acts as a second generation porphyrin photosensitiser, acting as a precursor to protoporphyrin IX (PpIX) within the haem biosynthetic pathway.2 When ALA is converted to PpIX, which has robust photosensitivity and accumulates preferentially in proliferating cells, excitation with light of a specific wavelength produces abundant singlet oxygen and free radicals, resulting in apoptosis and necrosis of these unwanted cells.3
Currently, the bioavailability of ALA often falls short of the desired therapeutic effect due to its polarity and the influence of physiological pH.4 To overcome these limitations, nanoporous drug delivery systems such as liposomes, chitosan nanoparticles (NP) and polylactic glycolate (PLGA) have been investigated.5 The liposome delivery system offers the advantage of encapsulating hydrophilic drugs such as ALA in its aqueous core.6 Polymeric nanoparticles show potential as ALA carriers due to their smaller pore size, which allows for easier epidermal penetration.7 Nanoparticle-loaded ALA has shown increased PpIX fluorescence and greater photocytotoxicity compared to free ALA at equivalent concentrations.8 The polymeric micellar system allows for a steady and continuous release of ALA while enhancing cellular uptake.9 ALA-loaded nanofibres have also shown potential for drug delivery as a substrate for PpIX production.10
However, these NP systems have certain limitations, including instability, potential drug leakage from capsules and uncertain long-term side effects. To address these concerns, a novel approach involves the use of poly-ε-caprolactone-co-lactic acid (PCLA) prepolymer monomers (PCLAMA).11 These microspheres exhibit excellent biocompatibility and stability, positioning them as promising materials for advanced drug delivery applications. In this investigation, we have fabricated and characterized ALA-loaded ANPs and subsequently subjected them to in vitro testing with HaCaT cells. Our aim is to establish a practical ALA delivery system, thereby introducing new concepts and laying experimental foundations for the use of ALA-PDT in the treatment of skin diseases.
Materials and Methods
Cell Line and Reagents
The HaCaT cell line (ZQ0044, purchased from Shanghai Zhong Qiao Xin Zhou Biotechnology Co. LTD) was used in this study. The Enhanced Cell Counting Kit-8 (C0042, Beyotime) was used to assess cell viability, and the Mitochondrial Membrane Potential Assay Kit with TMRE (C2001S, Beyotime) was used to assess mitochondrial membrane potential. Experiments were performed using a 96-well black/clear bottom polystyrene microplate (3603, CORNING).
Preparation and Characterization of ALA Nanospheres
Degradable nano-hydrogel microspheres, called ANPs, were synthesized through emulsion polymerization using PCLAMA as a cross-linking agent and vinyl pyrrolidone along with methyl acryloxyethyl trimethyl ammonium chloride as monomers. To obtain ALA-coated nanospheres, a specific amount of ALA and ANPs were soaked in ethanol for 24 h, followed by ethanol removal under vacuum conditions. Subsequent morphological analysis of the ALA-coated nanospheres was carried out using scanning electron microscopy (SEM) and transmission electron microscopy (TEM).
Ultrastructure Characterization of ANPs and ALA-ANPs
ANPs and ALA-ANPs powders were collected and fixed with 2.5% glutaraldehyde at 4°C for 4 h. After fixation, they were washed three times with PBS and dehydrated sequentially through ethanol concentrations of 10%, 30%, 50%, 70%, 90% and two rounds of 100% ethanol for thorough dehydration. Tert-butanol replacement was performed twice for 20 minutes each time, maintaining a temperature of 4°C. The samples were then stored at 4°C for future use. SEM was used for observation after vacuum drying and ion sputtering of gold.
After Gluta electron microscope fixation, osmic acid treatment, acetone dehydration, epoxy resin embedding and repair, the specimens were sectioned with a microtome and placed in 200-mesh copper mesh. After treatment with uranium acetate and lead hydroxide, the specimens were stained. Images were observed by TEM.
Nanoparticle Tracking Analysis (NTA)
The NTA sample chamber was cleaned with pre-cooled ddH2O, followed by precise parameter calibration of the instrument using 100 nm polystyrene microspheres. The sample chamber was then thoroughly washed several times with PBS phosphate buffer. The sample was appropriately diluted with 1× PBS buffer and introduced into the chamber for analysis while maintaining a controlled temperature range of 23°C to 30°C. Analysis was performed using ZetaView 8.04.02 SP2 software, and data visualization was a performed using Origin 2019 software.
Cytotoxicity Assay
HaCaT cells were seeded at 8000 cells per well in 96-well plates and cultured for 24 hours at 37°C in 5% CO2. After removal of the medium, the wells were rinsed twice with PBS and replenished with medium containing ANPs at concentrations of 0, 0.1, 0.5, 1.0, 1.5 and 2.0 mg/mL. Each group contained 5 replicate wells and the cells were incubated for 6, 12 and 24 h. Then 100 μL of CCK-8 reaction reagent was added to each well and incubated for 4 h in an incubator. The reagent was then read using a microplate reader at a wavelength of 450 nm.
Dynamic Measurement of PpIX Fluorescence
HaCaT cells (8×10⁴ cells/well) were seeded in 96-well plates and cultured for 24 h. When the cells reached 80% confluence, the serum-containing medium was aspirated and the cells were rinsed three times with PBS. 100 µL DMEM supplemented with different concentrations of ALA (0 mM, 0.1 mM, 0.5 mM, 1 mM, 2 mM, 5 mM and 10 mM), ALA-ANPs (1 mM ALA equivalent) and ANPs were added to the wells in the dark (96-well plates covered with tin foil) and continued to be cultured at 37°C 5% CO2. At predetermined time points within the following 12 h, PpIX fluorescence was quantified using a microplate reader with an excitation wavelength of 400 nm and an emission wavelength of 635 nm. Autofluorescence data were obtained after background correction. 5 replicate wells were employed for each group (n = 5).
Morphological Observation and Detection of Intracellular Mitochondrial Membrane Potential
HaCaT cells were seeded in 96-well plates at a density of 8000 cells/well. At 80% confluence, the medium was replaced with serum-free medium supplemented with 0 mM ALA, 0.5 mg/mL ANPs, 1 mM ALA or 0.5 mg/mL ALA-ANPs. After incubation in the dark for 6 h, the medium was initially substituted with PBS, and the cells was transferred to red light (parameters: 80mJ/cm², perpendicular distance: 15cm) for 15 minutes. Afterward, the cells were transferred to the incubator under the protection of tin foil, the PBS was replaced with normal medium and the cells were further incubated in the darkness for an additional 12 h. Cell morphology was observed under a light microscope. The mitochondrial membrane potential was assessed using a mitochondrial membrane potential assay Kit. 5 replicate wells were employed for each group (n = 5).
Reactive Oxygen Species (ROS) Levels
ROS levels were assessed in the control, 0.5 mg/mL ANPs, 1.0 mM ALA and 1.81 mg/mL ALA-ANPs groups. Cells were washed twice with buffer solution and then stained with diluted DCFDA (2’,7’-dichloro-dihydro-fluorescein diacetate) solution. After incubation for 45 minutes at 37°C in the dark, the cells were washed twice more with buffer solution. The staining results were examined under a fluorescence microscope. 5 replicate wells were employed for each group (n = 5).
Ki67 Immunofluorescence Staining
Cells were fixed with 4% paraformaldehyde for 15 minutes at room temperature, followed by three washes with PBS. The cells were then permeabilized with 0.2% Triton X-100 for 20 minutes at room temperature. The primary antibody against Ki67 and the secondary antibody of sheep anti-rabbit IgG H&L (DyLight 594) were used (1:200). Cell nuclei were counterstained with DAPI (1:500) for 5 minutes. Imaging was performed using a fluorescence microscope. 5 replicate wells were employed for each group (n = 5).
Statistical Analysis
Each experiment was repeated three times. Statistical analysis was performed using SPSS 25.0 software (IBM Corporation, Armonk, NY, USA). Two-way analysis of variance (ANOVA) was used to compare the levels of PpIX generated by ALA ANPs and 1mM ALA. The PpIX fluorescence and cell survival were evaluated by independent T-assay at specific time points in different experimental groups. p < 0.05 indicated statistical significance.
Results
Characterization of ANPs
Under SEM, the ANPs showed a uniform and spherical shape with good transmittance (Figure 1A), while the ALA-ANPs showed an elliptical opaque shape (Figure 1B), indicating successful coating with ALA. TEM showed that the ANPs had low electron density and nucleoid structure in their centres, suggesting that the interior of the ANPS might be hollow. The surface of the ANPs is smooth, with occasional highly transparent structures, suggesting surface pores (Figure 1C). In contrast, the ALA-ANPs showed reduced light transmission and an uneven surface (Figure 1D).
 |
Figure 1 Characterization of acrylic nanoparticles (ANPs) and 5 - aminolevulinic acid loaded acrylic nanoparticles (ALA-ANPs) by scanning electron microscopy (SEM) (A and B) and transmission electron microscopy (TEM) (C and D). (A and C) ANPs, (B and D) ALA-ANPs. |
Size Analysis of Nanoparticles
The diameter of the ANPs ranges from 150 nm to 200 nm, with a single prominent peak indicating a concentrated distribution (Figure 2A). The ALA-ANPs are larger than the ANPs, with diameters of 220–250 nm, showing a single peak of frequency distribution (Figure 2B).
 |
Figure 2 Size analysis of the ANPs (A) and ALA-ANPs (B). The abscissa represents the diameter and the ordinate represents the frequency distribution. |
Biocompatibility of ALA-ANPs
The cytotoxicity of ANPs at different concentrations was evaluated: control group, 0.1, 0.5, 1.0, 1.5 and 2.0 mg/mL. 0.5mg/mL ANPs showed comparable cytotoxicity compared to the medium without FBS (p > 0.05) and 1.0 mg/mL ANPs resulted in a significant decrease in cell viability after 12 h incubation (p < 0.05). This condition can be attributed to the cells overtaking the ANPs, triggering their own swelling and subsequent death (Figure 3). Therefore, 0.5 mg/mL ANPs was chosen for the subsequent ALA-coated ANPs experiments.
 |
Figure 3 The cytotoxicity of ANPs on HaCaT cells within 24 hours of culture. Vertical axis represents Optical Density (OD:450nm). |
Kinetics of PpIX fluorescence
ALA at different concentrations, ANPs and ALA-ANPs were added to a culture system which was exposed to a specific light after 6 hours of incubation. The parameters were set as follows: excitation wavelength is 400 nm, emission wavelength is 630 nm. The results showed that protoporphyrin IX fluorescence increased over time in the ALA and ALA-ANPs groups were. Four hours after irradiation, the intensity of PpIX fluorescence in the ALA-ANPs group (equivalent to 1 mM ALA) was higher than that in the 1 mM ALA group (p < 0.05). The fluorescence in the ANPs group was barely visible, indicating that ANPs alone could not induce PpIX production in HaCaT cells (Figure 4).
 |
Figure 4 Production of protoporphyrin IX in 9 groups within 12 hours of incubation. OD (Optical Density) is depicted on the vertical axis. (excitation wavelength: 400 nm, emission wavelength: 630 nm). |
Morphology of HaCaT Cells After Different Concentrations of ALA-PDT
In the 0 mM ALA group (control), HaCaT cells exhibited a uniform and regular cobblestone-like morphology, forming cohesive clusters (Figure 5A and B). Cells treated with 0.5 mg/mL ANPs retained the cobblestone-like appearance, exhibiting strong adhesion and clustered growth (Figures 5C and D). In the 1mM ALA group, HaCaT cells exhibited more uniform morphology, increased cellular permeability, decreased intercellular cohesion and cell death in the medium compared to controls (Figures 5E and F). HaCaT cells treated with 1.81mg/mL ALA-ANPs (equivalent to 1.0 mM ALA) exhibited different cell shapes and sizes. Compared to the 1mM ALA group, cellular permeability further increased, more cells were observed in the culture medium and intercellular junctions were less tight (Figures 5G and H).
 |
Figure 5 Effects of different concentrations of 5-aminolevulinic acid photodynamic therapy (ALA-PDT) on the morphology of HaCaT cells. (A and B):0 mM ALA group (control group); (C and D):0.5 mg/mL ANPs group; (E and F): 1.0 mM ALA group; (G and H):1.81 mg/mL ALA-ANPs group (equivalent to 1.0 mM ALA) (A, C, E and G:100 ×, B, D, F and H) 200 ×). |
Growth Inhibition of HaCaT Cells by Different Concentrations of ALA-PDT
Based on the fluorescence kinetics results and considering the clinical treatment duration, HaCaT cells were exposed to different concentrations of ALA for 6 hours followed by light exposure (parameters: 80 mJ/cm², distance: 15 cm) for 15 minutes. The cells were then cultured in a 37°C incubator with 5% CO2 for 12 hours in the dark. Using the CCK-8 method for evaluation, it was observed that 12 hours after ALA-PDT treatment, when the ALA concentration remained below 2 mM, HaCaT cell activity decreased proportionally with the ALA concentration. However, when the ALA concentration exceeded 2 mM, HaCaT cell activity showed no significant change, indicating a saturation effect without statistical significance (p > 0.05). Comparing to the 0 mM ALA group, the cell viability of the 0.5 mg/mL ANPs group remained almost identical, with no statistically significant difference (p > 0.05). Compared to the 1 mM ALA group, the cell viability of the 1.81mg/mL ALA-ANPs group (equivalent to 1.0 mM ALA) decreased significantly (p < 0.05) (Figure 6).
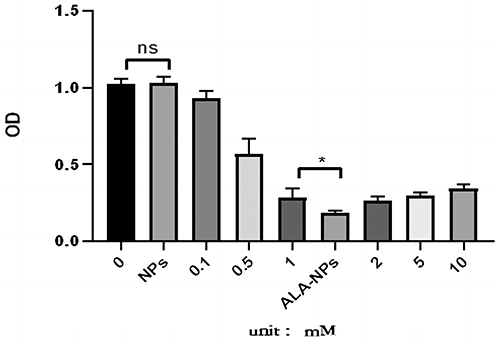 |
Figure 6 Effects of different concentrations of ALA-PDT on the activity of the HaCaT cells. Vertical axis indicates Optical Density (OD:450nm). *p < 0.05, **p < 0.01, ***p < 0.001. Abbreviation: ns, not significant. |
Detection of Cell Mitochondrial Membrane Potential (MMP)
To investigate the effect of ALA-PDT on mitochondrial function in HaCaT cells, we used the JC-1 labelling method to assess changes in mitochondrial membrane potential (MMP). After 12 hours of ALA-PDT treatment, we evaluated MMP changes in the following groups: control (0 mM ALA), ANPs treated, 1 mM ALA treated, and ALA-ANPs treated. Using immunofluorescence analysis, we observed that the mitochondrial red fluorescence intensity in the control group (Figure 7A) was very similar to that in the ANPs-treated group (Figure 7B). Compared with the control group, the fluorescence of the MMP in the 1mM ALA group (Figure 7C) was significantly darker, and the fluorescence intensity of MMP in the ALA-ANPs (Figure 7D) group was also significantly weaker than that in the 1mM ALA group (Figure 7E).
 |
Figure 7 Effects of different concentrations of ALA-PDT on the mitochondrial membrane potential (MMP) of HaCaT cells. (A): 0 mM ALA group (control group); (B): 0.5 mg /mL ANPs group; (C):1.0 mM ALA group; (D) 1.81 mg/mL ALA-ANPs group (equivalent to 1.0 mM ALA). (E). the relative expression of mitochondrial membrane potential. *p < 0.05, **p < 0.01, ***p < 0.001. Abbreviation: ns, not significant. |
Reactive Oxygen Species (ROS)
To verify the level of ROS production in HaCaT after exposure to light, the fluorescent probe H2DCFH-DA was used to detect the changes in ROS. After treatment with ALA-PDT for 12 h, ROS were detected in the blank 0 mM ALA group (control group), 0.5 mg/mL ANPs group, 1.0 mM ALA group and 1.81 mg/mL ALA-ANPs group (equivalent to 1.0 mM ALA) by fluorescence probe method, respectively. The results showed comparable ROS fluorescence intensity between the 0 mM ALA control group (Figure 8A) and the 0.5 mg/mL ANPs group (Figure 8B), with no statistically significant difference (p > 0.05). Conversely, the ROS fluorescence intensity showed a significant increase in the 1.0 mM ALA group compared to the 0 mM ALA control (Figure 8C). In addition, a further significant increase in ROS fluorescence intensity was observed in the 1.81 mg/mL ALA-ANPs group (corresponding to 1.0 mM ALA), as shown in Figure 8D, and this difference was statistically significant (p < 0.01) compared to the 1.0 mM ALA group (Figure 8E).
 |
Figure 8 Effects of different concentrations of ALA-PDT on the reactive oxygen species (ROS) level. (A): 0 mM ALA group (control group); (B) 0.5 mg /mL ANPs group; (C)1.0 mM ALA group; (D) 1.81 mg/mL ALA-ANPs group (equivalent to 1.0 mM ALA). (E) The relative expression of reactive oxygen species. *p < 0.05, **p < 0.01, ***p < 0.001. Abbreviation: ns, not significant. |
Ki67 Immunofluorescence Staining
To assess the effect of 5-ALA PDT on HaCaT cell proliferation, ki67 immunofluorescence staining was performed. The results were as follows: compared to the 0 mM ALA control group (Figure 9A and B), the fluorescence intensity of the 0.5 mg/mL ANPs group (Figure 9C and D) showed minimal change, l which was not statistically significant (p > 0.05). In contrast to the 1.0 mM ALA group (Figure 9E and F), the fluorescence intensity of the 1.81 mg/mL ALA-ANPs group (corresponding to 1.0 mM ALA) decreased significantly (Figure 9G and H). Importantly, this difference was statistically significant (p < 0.01) (Figure 9I).
 |
Figure 9 Ki67 immunofluorescence staining of HaCaT cells (A, C, E and G) DAPI; (B, D, F and H) ki67). (A and B) 0 mM ALA group (control group); (C and D) 0.5 mg /mL ANPs group; (E and F)1.0 mM ALA group; (G and H) 1.81 mg/mL ALA-ANPs group (equivalent to 1.0 mM ALA). I. the relative expression of ki67. *p < 0.05, **p < 0.01, ***p < 0.001. Abbreviation: ns, not significant. |
Discussion
The efficacy of a drug is determined by the processes of absorption, distribution, metabolism and excretion in the body.12 However, cell membranes contain potent drug efflux transporters, resulting in suboptimal concentrations of ALA that are insufficient to overwhelm the normal haem synthesis pathway and undermine the therapeutic effect of ALA-PDT. Nanocarriers were found to improve the transport efficiency of ALA. Different nanocarriers have been proposed for topical applications. Currently, polymeric NPs (PLGA), chitosan NPs, silica NPs, metal NPs/gold NPs, nanostructured lipid carriers (NSLCs), liposomes and nanoemulsions have successfully encapsulated the photosensitiser ALA for the treatment of skin diseases.13,14 ALA- nanoemulsions in soybean oil O/W systems showed both the highest skin permeation and flux across porcine skin (2.6-fold higher than the aqueous control).15 The nanostructured lipid carrier can control the release of ALA in vitro (dialysis membrane method), enhance the in vitro skin penetration of ALA (rat skin model) and increase the penetration of ALA into deeper skin layers.16,17 This suggests that nanocarriers play an important role in increasing the permeability of photosensitizers.18,19
Compared to the size of polymeric nanoparticles (PNPs, 10–1000 nm), liposomes (50–100 nm), nanoemulsions (NEs, 100–300 nm), polymeric micelles and nanospheres (10–80 nm), ANPs (150–200 nm) have advantages in particle size uniformity, encapsulation and transport efficiency of ALA.5 ALA-ANPs were synthesised via emulsion polymerisation and served as an innovative nanoparticle drug delivery system (NDDS).20 This system facilitated the efficient transport of the photosensitiser ALA to HaCaT cells. Experimental results showed that when subjected to PDT, 1.81 mg/mL ALA-ANPs (equivalent to 1.0 mM ALA) resulted in a significant increase in intracellular ROS levels compared to the 1.0 mM ALA group. Notably, the ANPs themselves had no intrinsic capacity to generate ROS.21 This highlights the potential of ALA-ANPs PDT to promote cell death by increasing ROS production within target cells. Taken together, these findings highlight the multiple mechanisms underlying the efficacy of ALA-ANPs-PDT in inducing cellular responses.
In particular, ANPs exhibit pH-responsive degradation properties, which have been substantiated by a battery of experiments including in vitro degradation, equilibrium swelling, drug delivery and intracellular drug release.11 PpIX accumulation showed a decreasing pattern when the ALA concentration exceeded the optimal threshold (OPT).22 This phenomenon may be related to pH conditions, where maintaining a pH of 7.0 to 7.6 appeared to be conducive to increasing PpIX levels within the cells.23,24 Taken together, these results highlight the exceptional nanomaterial properties of ANPs as a versatile drug delivery system. Since exceeding a certain concentration of ANPs will lead to nanoparticle aggregation and potential nanomass precipitation, and excessive ANP uptake by cells will trigger cell swelling and eventual rupture, a concentration of 1.81 mg/mL of ALA-ANPs, equivalent to 1.0 mM ALA, was chosen in our studies.
When investigating the inhibitory effect on HACAT proliferation in vitro, we observed a significantly increased inhibitory effect of 1.81 mg/mL ALA-ANPs compared to 1.0 mM ALA after 12 hours of incubation (p < 0.01). The 1.81 mg/mL ALA-ANPs group showed a rapid increase in PpIX fluorescence at the third hour of incubation, even reaching levels seen in the 2.0 mM ALA group. This result is similar to the effect of liposomes. At the same time, ALA concentrations above 1.0 mM did not alter the effect of ALA-PDT on in vitro cell proliferation (p > 0.05). Notably, ANPs alone had no inhibitory effect on HaCaT proliferation in vitro, reinforcing the fluorescence kinetic findings of PpIX. This supports the notion that photosensitizers, when coated with ANPs, exhibit enhanced conversion to PpIX by increasing the rate of uptake into target cells. Ultimately, this enhances the efficacy of PDT at equivalent ALA concentrations.
In this study, ANPs were used as a delivery system to improve the availability or stability of ALA, prevent the reduction and loss of potency of ALA, and facilitate the transport of the photosensitiser. ANPs effectively inhibited the proliferation of HaCaT cells in vitro and enhanced the penetration and accumulation of photosensitising agents within the cells. This breakthrough provides a novel conceptual framework and theoretical basis for improved clinical management of actinic keratosis. This study highlights the promising potential of ALA-ANPs as a means of optimising photodynamic therapy outcomes.
Conclusion
The study shows that ALA - ANPs can enhance the efficiency of ALA - PDT in vitro by producing more PpIX at the same concentration of ALA in HaCaT cells. The combination of ALA and ANPs provides an ideal protocol for the delivery of ALA for the local treatment of skin diseases.
Ethics Statement
The study was approved by the Ethics Committee of the Third Affiliated Hospital of Soochow University (Approval No. 2023-046).
Author Contributions
All authors have made a substantial contribution to the work reported, be it in conception, design, conduct, acquisition of data, analysis and interpretation, or all of these; have been involved in drafting, revising, or critically reviewing the article; have given final approval for the version to be published; have agreed on the journal to which the article will be submitted; and agree to accept responsibility for all aspects of the work.
Funding
This work was supported by the Graduate Research Innovation Program of Bengbu Medical College (Byycx21088), Frontier Technology of Cell Therapy Foundation of Changzhou Xitaihu (Grant/Award Number: 2022-P-014), the National Natural Science Foundation of China (No. 81673078) and the Postgraduate Academic Innovation Project in Anhui Province (2022xscx123).
Disclosure
The authors declare no conflicting interests for this work.
References
1. Shi L, Wang H, Chen K, et al. Chinese guidelines on the clinical application of 5-aminolevulinic acid-based photodynamic therapy in dermatology (2021 edition). Photodiagnosis Photodyn Ther. 2021;35:102340. doi:10.1016/j.pdpdt.2021.102340
2. Lee PK, Kloser A. Current methods for photodynamic therapy in the US: comparison of MAL/PDT and ALA/PDT. J Drugs Dermatol. 2013;12(8):925–930.
3. Sun Z, Zhao M, Wang W, et al. 5-ALA mediated photodynamic therapy with combined treatment improves anti-tumor efficacy of immunotherapy through boosting immunogenic cell death. Cancer Lett. 2023;554:216032. doi:10.1016/j.canlet.2022.216032
4. Hashemkhani M, Loizidou M, MacRobert AJ, Yagci Acar H. One-step aqueous synthesis of anionic and cationic AgInS(2) quantum dots and their utility in improving the efficacy of ALA-based photodynamic therapy. Inorg Chem. 2022;61(6):2846–2863. doi:10.1021/acs.inorgchem.1c03298
5. Bhattacharya S, Prajapati BG, Singh S, Anjum MM. Nanoparticles drug delivery for 5-aminolevulinic acid (5-ALA) in photodynamic therapy (PDT) for multiple cancer treatment: a critical review on biosynthesis, detection, and therapeutic applications. J Cancer Res Clin Oncol. 2023;149(19):17607–17634. doi:10.1007/s00432-023-05429-z
6. Di Venosa G, Hermida L, Batlle A, et al. Characterisation of liposomes containing aminolevulinic acid and derived esters. J Photochem Photobiol B. 2008;92(1):1–9. doi:10.1016/j.jphotobiol.2008.03.008
7. Benito-Miguel M, Blanco MD, Gomez C. Assessment of sequential combination of 5-fluorouracil-loaded-chitosan-nanoparticles and ALA-photodynamic therapy on HeLa cell line. Photodiagnosis Photodyn Ther. 2015;12(3):466–475. doi:10.1016/j.pdpdt.2015.05.001
8. Zhang Z, Chen Y, Ding J, et al. Biocompatible 5-Aminolevulinic Acid/Au nanoparticle-loaded ethosomal vesicles for in vitro transdermal synergistic photodynamic/photothermal therapy of hypertrophic scars. Nanoscale Res Lett. 2017;12(1):622. doi:10.1186/s11671-017-2389-x
9. Gergely LP, Yuceel C, Isci U, et al. Comparing PVP and polymeric micellar formulations of a PEGylated photosensitizing phthalocyanine by NMR and optical techniques. Mol Pharm. 2023;20(8):4165–4183. doi:10.1021/acs.molpharmaceut.3c00306
10. Yoo JJ, Kim C, Chung CW, Jeong YI, Kang DH. 5-aminolevulinic acid-incorporated poly(vinyl alcohol) nanofiber-coated metal stent for application in photodynamic therapy. Int J Nanomed. 2012;7:1997–2005. doi:10.2147/IJN.S30298
11. Liu X, Zhang Y, Zhang P, et al. Development of biodegradable nanogels for lipase accelerated drug release of 5-aminolevulinic acid. Colloids Surf B Biointerfaces. 2023;225:113268. doi:10.1016/j.colsurfb.2023.113268
12. Speck-Planche A, Cordeiro MN. Review of current chemoinformatic tools for modeling important aspects of CYPs-mediated drug metabolism. Integrating metabolism data with other biological profiles to enhance drug discovery. Curr Drug Metab. 2014;15(4):429–440. doi:10.2174/1389200215666140605124002
13. Ge P, Liu Y, Chen Q, et al. Transferrin receptors/magnetic resonance dual-targeted nanoplatform for precise chemo-photodynamic synergistic cancer therapy. Nanomedicine. 2022;39:102467. doi:10.1016/j.nano.2021.102467
14. Visentini FF, Perez AA, Santiago LG. Bioactive compounds: application of albumin nanocarriers as delivery systems. Crit Rev Food Sci Nutr. 2023;63(25):7238–7268. doi:10.1080/10408398.2022.2045471
15. Zhang LW, Al-Suwayeh SA, Hung CF, Chen CC, Fang JY. Oil components modulate the skin delivery of 5-aminolevulinic acid and its ester prodrug from oil-in-water and water-in-oil nanoemulsions. Int J Nanomed. 2011;6:693–704. doi:10.2147/IJN.S17524
16. Wang J, Tang J, Zhou X, Xia Q. Physicochemical characterization, identification and improved photo-stability of alpha-lipoic acid-loaded nanostructured lipid carrier. Drug Dev Ind Pharm. 2014;40(2):201–210. doi:10.3109/03639045.2012.753901
17. Wang J, Xia Q. Alpha-lipoic acid-loaded nanostructured lipid carrier: sustained release and biocompatibility to HaCaT cells in vitro. Drug Deliv. 2014;21(5):328–341. doi:10.3109/10717544.2013.846435
18. Sztandera K, Gorzkiewicz M, Klajnert‐Maculewicz B. Nanocarriers in photodynamic therapy—in vitro and in vivo studies. Wiley Interdiscip Rev Nanomed Nanobiotechnol. 2020;12(3):e1509. doi:10.1002/wnan.1599
19. Udrea AM, Smarandache A, Dinache A, et al. Photosensitizers-loaded nanocarriers for enhancement of photodynamic therapy in melanoma treatment. Pharmaceutics. 2023;15(8):2124. doi:10.3390/pharmaceutics15082124
20. Li J, Zhao J, Tan T, et al. Nanoparticle drug delivery system for glioma and its efficacy improvement strategies: a comprehensive review. Int J Nanomed. 2020;15:2563–2582. doi:10.2147/IJN.S243223
21. Wang X, Wan M, Zhang L, et al. ALA_PDT promotes ferroptosis-like death of mycobacterium abscessus and antibiotic sterilization via oxidative stress. Antioxidants. 2022;11(3):546. doi:10.3390/antiox11030546
22. de Faria CMG, Inada NM, Kurachi C, Bagnato VS. Determination of the threshold dose distribution in photodynamic action from in vitro experiments. J Photochem Photobiol B. 2016;162:168–175. doi:10.1016/j.jphotobiol.2016.06.041
23. Harada Y, Murayama Y, Takamatsu T, Otsuji E, Tanaka H. 5-aminolevulinic acid-induced protoporphyrin IX fluorescence imaging for tumor detection: recent advances and challenges. Int J Mol Sci. 2022;23(12):6478. doi:10.3390/ijms23126478
24. Zhao C, Song Q, Zhu L, Ma H. Preparation, stimuli-response performance of HPC-PMAA/PpIX nanogels and their application in photodynamic therapy. J Biomater Sci Polym Ed. 2022;33(3):313–328. doi:10.1080/09205063.2021.1987693
 © 2024 The Author(s). This work is published and licensed by Dove Medical Press Limited. The
full terms of this license are available at https://www.dovepress.com/terms.php
and incorporate the Creative Commons Attribution
- Non Commercial (unported, v3.0) License.
By accessing the work you hereby accept the Terms. Non-commercial uses of the work are permitted
without any further permission from Dove Medical Press Limited, provided the work is properly
attributed. For permission for commercial use of this work, please see paragraphs 4.2 and 5 of our Terms.
© 2024 The Author(s). This work is published and licensed by Dove Medical Press Limited. The
full terms of this license are available at https://www.dovepress.com/terms.php
and incorporate the Creative Commons Attribution
- Non Commercial (unported, v3.0) License.
By accessing the work you hereby accept the Terms. Non-commercial uses of the work are permitted
without any further permission from Dove Medical Press Limited, provided the work is properly
attributed. For permission for commercial use of this work, please see paragraphs 4.2 and 5 of our Terms.