")
Back to Journals » International Journal of Nanomedicine » Volume 19
Machine Learning Tools to Assist the Synthesis of Antibacterial Carbon Dots
Authors Bian Z, Bao T, Sun X, Wang N, Mu Q, Jiang T, Yu Z, Ding J, Wang T, Zhou Q
Received 24 November 2023
Accepted for publication 3 May 2024
Published 4 June 2024 Volume 2024:19 Pages 5213—5226
DOI https://doi.org/10.2147/IJN.S451680
Checked for plagiarism Yes
Review by Single anonymous peer review
Peer reviewer comments 4
Editor who approved publication: Dr Kamakhya Misra
Zirui Bian,1,* Tianzhe Bao,2,* Xuequan Sun,3,4 Ning Wang,1 Qian Mu,5 Ting Jiang,6 Zhongxiang Yu,6 Junhang Ding,2 Ting Wang,7 Qihui Zhou2
1Department of Bone, Huangdao District Central Hospital, Qingdao, People’s Republic of China; 2Qingdao Key Laboratory of Materials for Tissue Repair and Rehabilitation, School of Rehabilitation Sciences and Engineering, University of Health and Rehabilitation Sciences, Qingdao, People’s Republic of China; 3Weifang Eye Institute, Weifang Eye Hospital, Zhengda Guangming Eye Group, Weifang, People’s Republic of China; 4Zhengda Guangming International Eye Research Center, Qingdao Zhengda Guangming Eye Hospital, Qingdao University, Qingdao, People’s Republic of China; 5Department of Biomaterials, LongScience Biological (Qingdao) Co, LTD, Qingdao, People’s Republic of China; 6Heart Center, Qingdao Hiser Hospital Affiliated of Qingdao University (Qingdao Traditional Chinese Medicine Hospital), Qingdao University, Qingdao, People’s Republic of China; 7Department of Orthopaedic Surgery, The Affiliated Hospital of Qingdao University, Qingdao, People’s Republic of China
*These authors contributed equally to this work
Correspondence: Qihui Zhou; Junhang Ding, Tel +86-17660670299, Email [email protected]; [email protected]
Introduction: The emergence and rapid spread of multidrug-resistant bacteria (MRB) caused by the excessive use of antibiotics and the development of biofilms have been a growing threat to global public health. Nanoparticles as substitutes for antibiotics were proven to possess substantial abilities for tackling MRB infections via new antimicrobial mechanisms. Particularly, carbon dots (CDs) with unique (bio)physicochemical characteristics have been receiving considerable attention in combating MRB by damaging the bacterial wall, binding to DNA or enzymes, inducing hyperthermia locally, or forming reactive oxygen species.
Methods: Herein, how the physicochemical features of various CDs affect their antimicrobial capacity is investigated with the assistance of machine learning (ML) tools.
Results: The synthetic conditions and intrinsic properties of CDs from 121 samples are initially gathered to form the raw dataset, with Minimum inhibitory concentration (MIC) being the output. Four classification algorithms (KNN, SVM, RF, and XGBoost) are trained and validated with the input data. It is found that the ensemble learning methods turn out to be the best on our data. Also, ϵ-poly(L-lysine) CDs (PL-CDs) were developed to validate the practical application ability of the well-trained ML models in a laboratory with two ensemble models managing the prediction.
Discussion: Thus, our results demonstrate that ML-based high-throughput theoretical calculation could be used to predict and decode the relationship between CD properties and the anti-bacterial effect, accelerating the development of high-performance nanoparticles and potential clinical translation.
Keywords: carbon dots, machine learning, antibacterial, minimum inhibitory concentration, classification algorithms
Graphical Abstract:
Introduction
The rapid spread of multidrug-resistant bacteria (MRB) has been a worldwide challenge to global public health due to the overuse and misuse of antibiotics as well as the development of biofilms, resulting in refractory infections (eg, pneumonia, sepsis, tuberculosis, etc.) and thereby increasing morbidity and mortality.1–3 Conventional antibiotics eliminate bacteria or prevent growth from synthesizing protein, nucleic acid, or the cell wall.4,5 In parallel, bacteria develop resistance by various mechanisms, such as preventing small-molecule drugs from penetrating cell walls, reorganizing the genetic coding to diminish drug sensitivity, or releasing defensive enzymes to degrade medications.6–8 Without available treatment, we shall revert to the pre-antibiotic age, where MRB infections become unmanageable.
In the past decade, nanoparticles (NPs) as substitutes for antibiotics were demonstrated to have extensive capacities for blocking bacterial adhesion or removing adherent bacteria, which offers new strategies to address MRB/biofilm-associated infections.9–13 The inherent physicochemical features of NPs, including size, morphology, charge, surface modification, and functional groups, significantly affect their antibacterial/biofilm effects.14–16 However, numerous NPs display unsatisfactory cytocompatibility and severe tissue damage, considerably limiting their clinical application. Recently, carbon-based NPs, particularly carbon dots (CDs), have been receiving substantial attention owing to their excellent biocompatibility and the efficient eradication of MRB and biofilm by penetrating the biofilm, damaging the bacterial wall, binding to DNA or enzymes, inducing hyperthermia locally, or forming reactive oxygen species.17–20 They also have the advantages of fluorescence characteristics, light-activated activity, multiple surface modification, supermall size, and good water dispersibility.21–23 However, the complex and varied combination of their properties and synthetic conditions make it difficult for human intuition to find the foremost information related to their antimicrobial actions. Meanwhile, artificial intelligence (AI) makes its way into this field because of its impressive computing power to tackle experimental data and predict new materials.24–26
Generally, many experimental trial-and-error works are needed to discover the optimum combination among the different synthesis methods and precursors of CDs. To better understand how the synthesis conditions and intrinsic properties impact the antibacterial properties, we use a computational tool—Machine Learning (ML), to investigate their relationship. ML, a subset of AI, can learn from the input data and bridge the data to the outcome without professional insights.27 It can reduce the design parameter space by predicting the properties of CDs before synthesis, which decreases the trial-and-error work vastly. ML has been widely employed in this field. For instance, Mirzaei et al28 have presented an ML tool to predict the antibacterial ability of NPs with the zone of inhibition as the output value. Qian et al29 developed a deep convolution neural network (DCNN) to investigate CDs’ optical properties.
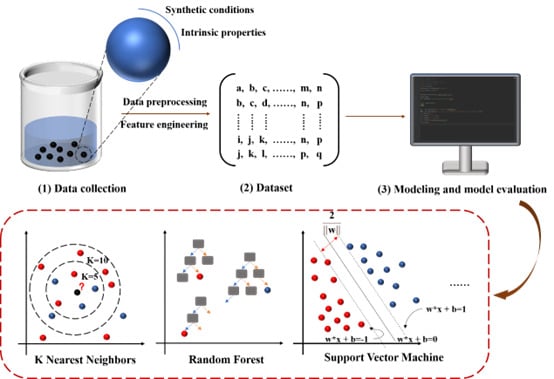
In this work, ML tools were used to elicit the relationship between the physicochemical features of various CDs and their antimicrobial capacity. The roadmap is shown in Figure 1. The reaction conditions and intrinsic properties were collected from literature and reviews to predict the antibacterial effect. Then, the final data set was established after the data preprocessing and feature engineering steps. Subsequently, several ML algorithms were employed to find the standout CDs among the instances. ε-poly(L-lysine) CDs (PL-CDs) were then synthesized and used for the validation of their classification performance. We used the ML method to reduce the trial-and-error work in the laboratory by screening out the optimum synthetic methods and the most valuable characteristics of CDs. In the post-antibiotic era, ML can help us develop more efficient drugs against infection.
 |
Figure 1 Schematic diagram of model development. This manuscript consists of three main steps: (1) Collect data from original research, including CDs’ synthetic conditions and intrinsic properties. (2) Determine the final data set via data preprocessing and feature engineering. (3) Train the models with the input data and validate their performance. |
Methods
Data Collection and Preprocessing
One hundred and twenty-one samples were collected from original research articles and reviews. The data are related to various synthetic conditions of CDs and their intrinsic attributes (Table 1).
 |
Table 1 Selected Features and Their Details of Synthetic CDs |
The qualitative data were label encoded by one-hot encoding, which converted the categorical variable into binary vectors where all the elements are zero except one that genuinely represents the category of a sample. One-hot encoding is highly used in data preprocessing due to its simplicity, and it can work well with a classification algorithm.30
Principal component analysis (PCA) was used subsequently to reduce the dimensions of features. The goal of PCA is to find a more proper coordinate system to depict our data and thus extract relevant information from it.31
Modeling
The ML algorithms (KNN: K-Nearest Neighbor, RF: Random Forest, XGBoost: Extreme Gradient Boosting, and SVM: Support Vector Machine) applied in the manuscript were obtained from scikit-learn based on Python. Several extensions, including NumPy, Pandas, and Matplotlib, were used to handle and visualize the data.
K-Nearest Neighbor (KNN)
The K-Nearest Neighbor algorithm is one of ML’s simplest supervised algorithms, calculated via distance.32 After constructing a training data set labeled with classes, Euclidean distance (eq.1) is used to find the nearest k neighbors of each target point. And the classification of the target point is decided by the majority of its k neighbors through a vote-like way considering the classes of its neighbors.33 The optimal value of k is mainly determined by data distribution.34 Commonly, a low k-value renders overfitting problems, while a high k-value causes underfitting. In this paper, k=5 is selected because it best performed our data.

RF and XGBoost
An RF algorithm is a highly interpretable algorithm composed of multiple decision trees. The decision tree classifies the samples based on a series of questions as the working principle of the tree model is to select the appropriate features to distinguish the data and then divide them into different sub-nodes according to different discrimination results until the samples remain in each node belonging to the same class. These final nodes are also called leaf nodes. The basic idea of the decision tree is to construct a tree-like structure with the most rapid entropy decline when using information entropy as the measure, and the entropy is zero at the leaf node.32
The process of learning is to build a tree model and find the best set of classification questions. One way is to maximize the information gain of each split; Gini impurity can also be used in this process.33 To solve the overfitting problem of decision trees, multiple decision trees form a random forest model, and the classification results are obtained by the trees voting in the random forest.
XGBoost is an ensemble tree model that aims to minimize a loss function with second-order Taylor expansion and regularization. It has been widely used due to its outstanding prediction accuracy and efficacy.23,35
Svm
The SVM is probably the strongest classifier among binary classification algorithms. To separate the data in an n-dimensional coordinate, an (n-1) dimensional hyperplane is constructed to divide the data into two groups based on their class labels. The closest data point to the hyperplane is called the support vector. Linearly inseparable data must be mapped to higher dimensional space through kernel function before separating. In this new space, data points will be linearly separable. Thus, the SVM can be implemented. Different kernels can be used, including linear, polynomial, radial basis function (RBF), and sigmoid.36
Model Evaluation
Confusion Matrix
The confusion matrix is a contingency table that visualizes the performance of classifiers.37 It represents how many data points are correctly classified and wrongly predicted. The correctly predicted positive data are called true positive (TP), while the wrongly predicted positive data are called false positive (FP). The negative data labeled as negative are named true negative (TN), and the ones labeled as positive are called false negative (FN).38
Some introductory confusion matrix rates can recap the predictive quality of a confusion matrix, which is sensitivity (True positive rate, TPR) (eq.2), false-positive rate (FPR) (eq.3), and classification accuracy (eq.4).


Receiver Operating Characteristics Curve (ROC Curve) and Area Under the Curve (AUC)
The ROC curve is a popular tool to evaluate the performance of binary classifiers. The classifiers based on ML algorithms usually generate a score ranging from 0 to 1 after processing the input data.39 Then the score is compared with a threshold to separate the target point into different classes. The ROC curve is plotted based on two indicators—FPR and TPR. Various thresholds will result in different classification results, and multiple FPR and TPR values are created in line with these thresholds. ROC curve is drawn when connecting the points on behalf of different thresholds.40 The performance of these classifiers can also be evaluated via the AUC quantitively.41
Experimental Evaluation
Materials and Reagents
ε-poly(L-lysine) (Mw ~ 4000) was purchased from Shanghai D&B Biological Science and Technology Co., Ltd., China. Dialysis membranes (MWCO = 5000 Da) were provided by Hunan Yibo Biotechnology Co., Ltd., China. Other chemical reagents were of analytical grade and used without further purification. Ultrapure water used in experiments was supplied with a Milli-Q apparatus (Millipore, Bedford, MA).
Synthesis and Characterization of PL-CDs
1 g ε-poly(L-lysine) (PL) was taken to a crucible and heated to 240 °C for 3h to form a dark gray residue. After being ground to powder in a mortar, the residue was dissolved in 20 mL of deionized water and under sonication for 40 min. Then, the mixture was centrifuged at 11,000 rpm for 1h and the supernatant was dialyzed for 24 h with Milli-Q water changed every 1h in the early 12 h and every 3h in the later 12 h. The final PL-CDs were obtained after lyophilization.
The size and morphology of PL-CDs were measured with transmission electron microscopy (TEM). The zeta potential of PL-CDs was determined using dynamic laser scattering (DLS). An Ultraviolet Analyzer performed the luminescence emission measurements with 365 nm UV light.
Evaluation and Prediction of in vitro Antibacterial Ability
The antibacterial capacity of PL-CDs was evaluated by a broth dilution method. Firstly, 12 sterile test tubes were positioned in a row, and 4 mg PL-CDs and 2 mL Milli-Q water were added to the first tube with mixing. Then, the doubling dilution method was repeated until the ninth tube with an extra concentration of 1500 μg/mL and 750 μg/mL added to reduce the group interval. The twelfth tube without PL-CDs served as group control. Subsequently, each tube was added with 1 mL diluted pathogenic (E. faecalis or E. coli) and placed in bacteriological incubators for 24h. Minimum inhibitory concentration (MIC) was determined by measuring the OD600 of each tube compared with the group control.
After obtaining all these relevant features of PL-CDs, four well-trained classification models were employed to predict their antibacterial ability. The prediction results were compared with the real results to evaluate the classification performance of ML models.
Results and Discussion
Establishing Dataset and Labeling Output
Data collection is the fundamental step of ML, and high-quality data can ensure the dataset is more appropriate for ML. To establish the dataset with adequate and accurate data, 160 instances were collected from original research articles and reviews. Numerous synthetic conditions and intrinsic properties were selected as the features to create our dataset. Every instance was represented using the same set of features, which could be continuous or categorical. The extracted parameters included the precursor and its mass, the reaction time, and the inherent physicochemical characteristics of the synthetic CDs. The details of feature selection are shown in Table 1.
The output of this study is the antibacterial ability of CDs. MIC, a standard test to assess the antibacterial property of nanomaterials after incubating with bacteria for 24 h, was employed to determine their antibacterial capacity owing to its frequent uses and easy quantification.42 Several indicators can also describe the antibacterial activity of CDs, including diffusion test,43 morphological evaluation,44 colony-forming unit,45 optical density, and broth microdilution method. However, they all failed to be chosen compared with MIC due to the limitations of quantification and data collection. As the MIC is measured from different sources, the classification algorithms (instead of regression algorithms) are considered more suitable due to the intrinsic uncertainty of the data.46 One hundred twenty-one instances with MIC values were used in the following work.
The top 50% of these instances measured by MIC were labeled as antibacterial, while the others were labeled as non-antibacterial (Figure 2A). This led to 61 kinds of CDs being divided into the antibacterial group and 60 kinds of CDs being divided into the non-antibacterial group (Figure 2B). The 0.5/0.5 segment ratio is used frequently to exhibit the classification results ideally. In contrast, the unbalanced data set can give a significant challenge to traditional classification algorithms. For example, the instances in the minority group are often wrongly classified into another class, which causes the low precision of the minority group. However, the total classification accuracy could be relatively high because most samples are indiscriminately classified into the majority group. The threshold setting is tunable for different intended uses.
 |
Figure 2 (A) Data distribution and Output labeling of “antibacterial” in this study. (B) The number of antibacterial CDs (1) and non-antibacterial CDs (0). (C) Missing values (percentage) of the input data. (D, E) Gini importance of features in the raw data set and features after extraction. |
Data Preprocessing and Feature Engineering
Initially, missing data occurred in nearly all the extracted features in the raw dataset, which should be solved first. As shown in Figure 2C, the hydrodynamic size and chemical composition had 82.5% and 58.1% missing values, respectively, and were therefore excluded. The following features were Zeta potential (31.3%), Color (26%), Mass (24.0%), Volume (18.8%), Solvent (12.5%), Method (7.5%), and Time (5.6%). In contrast, the Additives, Bacteria, Size, Light, and element had no missing values. The final dataset was created by fulfilling the raw data with the mean values of these features.
The original quantitative data had huge scale differences among features that can affect the model performance. As a result, the data should be normalized before model training.29 The Min-Max normalization was adopted in this study. The minimum and maximum values were used to convert the original data to the range (0, 1), eliminating the influence of dimension and order of magnitude. Every data point was normalized by subtracting the minimum value of the column. Then the result was divided by the difference between the minimum and maximum values of the column. The formula is defined as follows:

The categorical features (ie, Method, Solvent, Color, Bacterial, and Light) were label encoded via one-hot encoding; thus, categorical features were transformed into numeric data that could be used in the subsequent modeling. However, this process created multiple new variables. There were 33 variables used to predict the MIC of CDs. Generally, the number of variables should be far less than that of the samples because a large number of features could lead to overfitting and slow down the model training.47 We calculated the feature importance based on the Gini impurity, that is, the total decrease in node impurity.48 The basic idea of Gini importance is to identify the contribution that each feature makes. And the importance score of each feature is the average score among all random forest trees.34 Then, the features were ranked according to the scores (Figure 2D). The low-ranking features were discrete variables representing the category or sparse continuous data. For instance, ‘S’ represented the number of S atoms of the reagent, but not all the reagents bore S atoms, which resulted in data sparsity. These features had lower Gini importance because of the data sparsity. As a result, feature selection and extraction steps were required to ensure the proper features could be used as the input.
Principal component analysis (PCA) was implemented subsequently to reduce the feature dimensions by combining several features into one. The combined features Method, Solvent, Color, and Other atoms (except C, H, O, N) were created. Finally, 17 features were determined after the feature engineering process, which reduced the number of unnecessary features and created relevant features to describe the antibacterial ability of CDs. The Gini importance of the 17 features was calculated, demonstrating that the features screened out were pertinent to the antibacterial ability (Figure 2E).
The size of CDs was ranked first. The smaller size may increase the antibacterial ability by affecting the cellular uptake and distribution of CDs in the plasma membrane.45 The destruction of cell membranes plays a significant role in inhibiting bacterial growth. Moreover, CDs of small size can penetrate the membrane of bacteria to interact with the respiratory chain and DNA or form ROS.49
The surface charge measured by Zeta Potential can significantly affect the interplay between bacteria and CDs. For instance, the positively charged CDs interact with the negatively charged bacterial cell walls, resulting in cell apoptosis.50 Furthermore, surface charge significantly affected the stability of CDs, which is essential to their antibacterial property.49 As reported, the positively charged CDs can induce more ROS than the negatively charged and neutral ones. While the negatively charged CDs could affect the expression of the bacterial genes.51 Nevertheless, the direct relationship has not been verified.52,53
The type of bacteria was the highest-ranked discrete variable among these features. Gram-positive bacteria have a unique thick layer of peptidoglycan linking to teichoic acid, providing more anionic sites to facilitate electrostatic binding with CDs than Gram-negative bacteria.45
Recent reports show that light can activate the antibacterial ability of CDs via generating ROS, which is named the photodynamic effect.51 However, the feature that indicates the existence of light was ranked lowest. The fact that few articles referred to this information would account for its low ranking, which could result in insufficient evidence to separate our data set.
The structure of CDs is highly dependent on synthetic conditions, such as precursors, solvents, and methods. It is difficult to predict the potential antibacterial efficacy and specificity traditionally because tiny difference leads to the synthesis of structurally different CDs.54 ML gives us a fascinating insight into the effect of synthetic conditions.
As shown in the heat map (Figure 3), the Pearson correlation coefficients of the 17 features were calculated to determine the relationship between these features. The positive and negative values indicate the positive and negative correlations, respectively. The larger the values, the greater the correlations. In general, the highly correlated feature pairs should be eliminated because they can affect each other significantly when modeling, thus decreasing the efficiency.55 The 17 features remained finally.
 |
Figure 3 Heat map of Pearson correlation coefficients between the determined features. |
Modeling and Model Evaluation
Further, based on the determined features, an algorithm-based classification of antibacterial CDs was performed. Four traditional ML algorithms (KNN, RF, XGBoost, SVM) were applied to investigate whether the automatic classifying procedure could screen out the CDs with the best antibacterial performance. The principle of the modeling process is to minimize the cost function between the predicted values and the actual values via tuning the hyperparameters.56 We expected that the well-trained models could capture the relationship between the antibacterial property and the inherent attributes of CDs. The 121 samples were divided into a training dataset (80%) and a testing dataset (20%) to train the models and validate the classification results.
The ROC was plotted to show the performance of the classifiers (Figure 4). The AUC were 0.81 (KNN), 0.80 (RF), 0.90 (XGBoost), 0.83 (SVM), respectively. AUC quantitively evaluated the distinctive capabilities of binary classifiers. XGBoost showed the largest AUC in the ROC curves compared with KNN, RF, and SVM. As a result, the XGBoost algorithm was regarded as the most appropriate method to classify the data in our study.
 |
Figure 4 The ROC curves and AUC correspond to KNN (A), SVM (B), XGBoost (C), and RF (D). |
Other evaluation metrics were also used to evaluate the classification performance, such as the confusion matrix and classification accuracy. One thousand random splits into the training and testing sets were implemented to get the average prediction accuracy and plot the confusion matrix. As shown in Figure 5A-E, we could achieve 78.3% accuracy using XGBoost. The accuracy scores for the other three algorithms were 0.779 (RF), 0.768 (SVM), and 0.667 (KNN), respectively. There is no significant difference between the performance of RF and XGBoost, while they predict better than KNN and SVM, showing the superiority of ensemble learning methods. This is partly due to the fact that ensemble methods make decisions based on multiple base learners, thus obtaining improved performance and better generalization. The selected ensemble algorithms RF and XGBoost were further used in the next step. The confusion matrix for the test data set demonstrated that most instances could be correctly classified into antibacterial or non-antibacterial groups (Figure 5A-D).
 |
Figure 5 Confusion matrix of the classification results with four classifiers. (A) KNN, (B) SVM, (C) RF, and (D) XGBoost have been applied to the data. (E) The classification accuracy. ***p< 0.001. |
ML usually needs big data to learn effectively and precisely. However, a small data size was employed in this article. Data scarcity is a common issue in material science, but many researchers have achieved a relatively high classification accuracy on small sample sizes.47,56 Furthermore, the output values are categorical results instead of continuous variables, which also justifies the modeling process based on a small data set.
ML Assisted PL-CDs Development
For the validation of the classification effect of well-trained ML models in a natural laboratory, PL-CDs were synthesized, and the relevant features were characterized and recorded to fit the ML models. Firstly, the TEM image confirmed the successful production of PL-CDs, which also characterized its size and morphology (Figure 6A). As manifested in the core size histogram, the average size distribution is 3.99±0.89 nm, which is considered to be capable of penetrating the cell membrane and causing cell death.57,58 Accordingly, the surface zeta potential of PL-CDs and PL was measured to be +19.5 mV and +21.9 mV, respectively (Figure 6B), ensuring their electrostatic interaction with negatively-charged bacteria.59 The PL-CDs solution was light yellow and transparent under the sunlight, and it displayed a blue fluorescence with the excitation of 365 nm UV light (Figure 6C). Our prepared PL-CDs with surfaces rich in amino-groups exhibit excitation-independent behavior because of passivated surface states.
 |
Figure 6 Characterization of PL-CDs. (A) TEM image of PL-CDs. Inset: The corresponding size distribution histogram. (B) Zeta potential of PL and PL-CDs. (C) Photographs of PL-CDs under sunlight and UV light. (D) The MIC of PL-CDs towards E. faecalis. (E) The MIC of PL-CDs towards E. coli. ★p< 0.05. ★★★p< 0.001. |
To obtain the real antibacterial label of PL-CDs, the MIC value towards E. faecalis and E. coli was measured by a broth dilution method. E. faecalis and E. coli were used as representatives of Gram-positive and Gram-negative bacteria, respectively. As shown in Figure 6D-E, eleven concentrations of PL-CDs were co-cultured with E. faecalis and E. coli for 24h, the MIC towards E. faecalis and E. coli are 375 μg/mL and 250 μg/mL, respectively. According to the classification threshold in this work, PL-CDs were classified into the non-antibacterial group.
After extracting the features from synthetic conditions and characteristics, the well-trained ensemble learning models were applied to predict the antibacterial ability of PL-CDs and determine their label. Both RF and XGBoost managed to predict the real labels of PL-CDs (Table 2).
 |
Table 2 Predicted Results for the Antibacterial Ability of CDs. 1 Represents the Antibacterial Group and 0 Represents the Non-Antibacterial Group |
Though the tentative attempt of applying ML tools to a realistic scenario achieved a certain success, there remain plenty of obstacles to overcome. As data determines the quality of ML, the classification results will improve vastly with the rapidly growing literature about CDs. The current collecting procedure is highly time-consuming as the data are refined from articles and reviews with manual operations. It still requires tedious work to collect data and convert it into proper forms that can be used.60 The inefficient access to the data restricts the combination of ML methods and the investigation into many materials like CDs. It is meaningful to establish more standard databases containing the primary data, promoting the development of ML in material science.
Conclusion
This study investigated the performance of four classification algorithms to discover the CDs with outstanding antibacterial properties, with the ensemble methods performing the best. PL-CDs were synthesized and used for the validation of their practical application ability in a realistic scenario with RF and XGBoost both succeeding in the prediction of the real label of PL-CDs. This is the first step to screen out the required CDs, which aims at reducing the repetitive work in the lab. With the growing number of available data and the development of ML algorithms, the prediction results will improve significantly. One day, the experiments will focus on the data-driven hypothesis, and the qualified antibacterial agents will be synthesized with the assistance of computational power.
Acknowledgments
The authors are very grateful for the financial support by the Young Taishan Scholars Program of Shandong Province (Grant No. tsqn202306272), National Key Research and Development Project of China (Grant No. 2023YFFO715101), Traditional Chinese Medicine Science and Technology Project of Shandong province (Grant No. 2021Q069), and the Leading Project of Science and Technology of Yantai Development Zone (Grant No. 2021RC016).
Disclosure
The authors declare no competing financial interest.
References
1. Hernando-Amado S, Coque TM, Baquero F, Martínez JL. Defining and combating antibiotic resistance from one health and global health perspectives. Nat Microbiol. 2019;4(9):1432–1442. doi:10.1038/s41564-019-0503-9
2. Kwon JH, Powderly WG. The post-antibiotic era is here. Science. 2021;373(6554):471. doi:10.1126/science.abl599
3. Nelson RE, Hatfield KM, Wolford H, et al. National estimates of healthcare costs associated with multidrug-resistant bacterial infections among hospitalized patients in the United States. Clin Infect Dis. 2021;72(Supplement_1):S17–S26. doi:10.1093/cid/ciaa1581
4. Baquero F, Levin BR. Proximate and ultimate causes of the bactericidal action of antibiotics. Nat Rev Microbiol. 2021;19(2):123–132. doi:10.1038/s41579-020-00443-1
5. Chu J, Koirala B, Forelli N, et al. Synthetic-bioinformatic natural product antibiotics with diverse modes of action. J Am Chem Soc. 2020;142(33):14158–14168. doi:10.1021/jacs.0c04376
6. Lai CKC, Ng RWY, Leung SSY, Hui M, Ip M. Overcoming the rising incidence and evolving mechanisms of antibiotic resistance by novel drug delivery approaches – an overview. Advanced Drug Delivery Reviews. 2022;181:114078. doi:10.1016/j.addr.2021.114078
7. Hochvaldová L, Večeřová R, Kolář M, et al. Antibacterial nanomaterials: upcoming hope to overcome antibiotic resistance crisis. Nanotechnol Rev. 2022;11:1115–1142. doi:10.1515/ntrev-2022-0059
8. Qin S, Xie M, Cao S, et al. Insight into the antibacterial resistance of graphdiyne functionalized by silver nanoparticles. Cell Prolif. 2022;55:13236. doi:10.1111/cpr.13236
9. Dat NM, Thinh DB, Huong LM, et al. Facile synthesis and antibacterial activity of silver nanoparticles-modified graphene oxide hybrid material: the assessment, utilization, and anti-virus potentiality. Mater Today Chem. 2022;23:100738. doi:10.1016/j.mtchem.2021.100738
10. Nguyen NTT, Nguyen LM, Nguyen TTT, Nguyen TT, Nguyen DTC, Van Tran T. Formation, antimicrobial activity, and biomedical performance of plant-based nanoparticles: a review. Environ Chem Lett. 2022;20:2531–2571. doi:10.1007/s10311-022-01425-w
11. Yu Z, Li Q, Wang J, et al. Reactive oxygen species-related nanoparticle toxicity in the biomedical field. Nanoscale Res Lett. 2020;15:115. doi:10.1186/s11671-020-03344-7
12. Wang Z, Wang X, Wang Y, et al. NanoZnO ‑ modified titanium implants for enhanced anti ‑ bacterial activity, osteogenesis and corrosion resistance. J Nanobiotechnology. 2021;19:353. doi:10.1186/s12951-021-01099-6
13. Ji Y, Han Z, Ding H, et al. Enhanced eradication of bacterial/fungi biofilms by glucose oxidase-modified magnetic nanoparticles as a potential treatment for persistent endodontic infections. ACS Appl Mater Interfaces. 2021;13:17289–17299. doi:10.1016/j.bioactmat.2021.04.033
14. Wang Z, Mei L, Liu X, Zhou Q. Hierarchically hybrid biocoatings on Ti implants for enhanced antibacterial activity and osteogenesis. Colloids Surf B Biointerfaces. 2021;204:111802. doi:10.1016/j.colsurfb.2021.111802
15. Xu S, Zhou Q, Jiang Z, et al. The effect of doxycycline-containing chitosan/carboxymethyl chitosan nanoparticles on NLRP3 inflammasome in periodontal disease. Carbohydr Polym. 2020;237:116163. doi:10.1016/j.carbpol.2020.116163
16. Godoy-Gallardo M, Eckhard U, Delgado LM, et al. Antibacterial approaches in tissue engineering using metal ions and nanoparticles: from mechanisms to applications. Bioact Mater. 2021;6:4470–4490. doi:10.1016/j.bioactmat.2021.04.033
17. Huang S, Song Y, Zhang JR, Chen X, Zhu JJ. Antibacterial carbon dots-based composites. Small. 2023;2207385:1–28. doi:10.1002/smll.202207385
18. Ezati P, Rhim JW, Molaei R, et al. Preparation and characterization of B, S, and N-doped glucose carbon dots: antibacterial, antifungal, and antioxidant activity, Sustain. Mater Technol. 2022;32:e00397. doi:10.1016/j.susmat.2022.e00397
19. Liu Y, Xu B, Lu M, et al. Ultrasmall Fe-doped carbon dots nanozymes for photoenhanced antibacterial therapy and wound healing. Bioact Mater. 2022;12:246–256. doi:10.1016/j.bioactmat.2021.10.023
20. Wang Z, Sheng L, Yang X, et al. Natural biomass-derived carbon dots as potent antimicrobial agents against multidrug-resistant bacteria and their biofilms, Sustain. Mater Technol. 2023;36:e00584. doi:10.1016/j.susmat.2023.e00584
21. Qiao G, Chen G, Wen Q, et al. Rapid conversion from common precursors to carbon dots in large scale: spectral controls, optical sensing, cellular imaging and LEDs application. J Colloid Interface Sci. 2020;580:88–98. doi:10.1016/j.jcis.2020.07.034
22. Yang J, Zhang X, Ma YH, et al. Carbon dot-based platform for simultaneous bacterial distinguishment and antibacterial applications. ACS Appl Mater Interfaces. 2016;8:32170–32181. doi:10.1021/acsami.8b08832
23. Wang X, Wang H, Zhou W, et al. Carbon dots with tunable third-order nonlinear coefficient instructed by machine learning. J Photochem Photobiol A. 2022;426:113729.
24. Gao C, Min X, Fang M, et al. Innovative materials science via machine learning. Adv Funct Mater. 2022;32:2108044. doi:10.1002/adfm.202108044
25. Choudhary K, DeCost B, Chen C, et al. Recent advances and applications of deep learning methods in materials science. npj Comput Mater. 2022;8:59. doi:10.1038/s41524-022-00734-6
26. Suwardi A, Wang FK, Xue K, et al. Machine learning-driven biomaterials evolution. Adv Mater. 2022;34:e2102703. doi:10.1002/adma.202102703
27. Furxhi I, Murphy F, Mullins M, et al. Nanotoxicology data for in silico tools: a literature review. Nanotoxicology. 2020;14:612–637. doi:10.1080/17435390.2020.1729439
28. Mirzaei M, Furxhi I, Murphy F, Mullins M. A machine learning tool to predict the antibacterial capacity of nanoparticles. Nanomaterials. 2021;11:1774. doi:10.1021/acsami.8b08832
29. Wang XY, Bin Chen B, Zhang J, et al. Exploiting deep learning for predictable carbon dot design. Chem Commun. 2021;57:532–535. doi:10.1039/d0cc07882d
30. Singh VK, Maurya NS, Mani A, Yadav RS. Machine learning method using position-specific mutation based classification outperforms one hot coding for disease severity prediction in haemophilia ‘A’. Genomics. 2020;112:5122–5128. doi:10.1039/d0cc07882d
31. Shlens J, A Tutorial on Principal Component Analysis; 2014. Available from: http://arxiv.org/abs/1404.1100.
32. Juan Y, Dai Y, Yang Y, Zhang J. Accelerating materials discovery using machine learning. J Mater Sci Technol. 2021;79:178–190. doi:10.1016/j.jmst.2020.12.010
33. Katsikas G, Sarafidis C, Kioseoglou J. Machine learning in magnetic materials. Physica Status Solidi. 2021;258:2000600. doi:10.1002/pssb.202000600
34. Rickert CA, Hayta EN, Selle DM, et al. Machine learning approach to analyze the surface properties of biological materials. ACS Biomater Sci Eng. 2021;7:4614–4625. doi:10.1021/acsbiomaterials.1c00869
35. Duan J, Asteris PG, Nguyen H, Bui XN, Moayedi H. A novel artificial intelligence technique to predict compressive strength of recycled aggregate concrete using ICA-XGBoost model. Eng Comput. 2021;37:3329–3346. doi:10.1007/s00366-020-01003-0
36. Agrawal A, Deshpande PD, Cecen A, Basavarsu GP, Choudhary AN, Kalidindi SR. Exploration of data science techniques to predict fatigue strength of steel from composition and processing parameters, Integr. Mater Manuf Innov. 2014;3:8. doi:10.1186/2193-9772-3-8
37. Prasad D, Sreekumar P, Karumbu P. Identification and classification of materials using machine vision and machine learning in the context of industry 4. 0. J Intell Manuf. 2020;31:1229–1241. doi:10.1007/s10845-019-01508-6
38. Chicco D, Tötsch N, Jurman G. The Matthews correlation coefficient (Mcc) is more reliable than balanced accuracy, bookmaker informedness, and markedness in two-class confusion matrix evaluation. BioData Min. 2021;14:612–637. doi:10.1186/s13040-021-00244-z
39. Omar L, Ivrissimtzis I. Using theoretical ROC curves for analysing machine learning binary classifiers. Pattern Recognit Lett. 2019;128:447–451. doi:10.1016/j.patrec.2019.10.004
40. Georgescu AB, Ren P, Toland AR, et al. Database, features, and machine learning model to identify thermally driven metal-insulator transition compounds. Chem Mater. 2021;33:5591–5605. doi:10.1021/acs.chemmater.1c00905
41. Lee HC, Yoon HK, Nam K, et al. Derivation and validation of machine learning approaches to predict acute kidney injury after cardiac surgery. J Clin Med. 2018;7:332. doi:10.3390/jcm7100322
42. Dou Q, Fang X, Jiang S, Chee PL, Lee T, Loh XJ. RSC Advances antibacterial and gene delivery properties. RSC Adv. 2015;5:46817–46822.
43. Hou P, Yang T, Liu H, Li YF, Huang CZ. An active structure preservation method for developing functional graphitic carbon dots as an effective antibacterial agent and a sensitive pH and Al(III) nanosensor. Nanoscale. 2017;9:17334–17341. doi:10.1039/c7nr05539k
44. Ju B, Nie H, Zhang XG, et al. Inorganic salt incorporated solvothermal synthesis of multicolor carbon dots, emission mechanism, and antibacterial study. ACS Appl Nano Mater. 2018;1:6131–6138. doi:10.1021/acsanm.8b01355
45. Sun B, Wu F, Zhang Q, et al. Journal of colloid and interface science insight into the effect of particle size distribution differences on the antibacterial activity of carbon dots. J Colloid Interface Sci. 2021;584:505–519. doi:10.1016/j.jcis.2020.10.015
46. Serafim MSM, Kronenberger T, Oliveira PR, et al. The application of machine learning techniques to innovative antibacterial discovery and development. Expert Opin Drug Discov. 2020;15:1165–1180. doi:10.3390/jcm7100322
47. He M, Zhang L. Machine learning and symbolic regression investigation on stability of MXene materials. Comput. Mater. Sci. 2021;196:110578. doi:10.1016/j.commatsci.2021.110578
48. Nembrini S, Ko IR, Wright MN, Lu C. Data and text mining The revival of the Gini importance ? Bioinformatics 2018;34:3711–3718. doi:10.1093/bioinformatics/bty373
49. Jin J, Dong P, Lai L. One-step synthesis of silver nanoparticles using carbon dots as reducing and stabilizing agents and their antibacterial mechanisms. Carbon N Y. 2015;94:129–141. doi:10.1016/j.carbon.2015.05.084
50. Dong X, Liang W, Meziani MJ, Sun YP, Yang L. Carbon dots as potent antimicrobial agents. Theranostics. 2020;10:671–686. doi:10.7150/thno.39863
51. Jian HJ, Wu RS, Lin TY, et al. Super-cationic carbon quantum dots synthesized from spermidine as an eye drop formulation for topical treatment of bacterial keratitis. ACS Nano. 2017;11:6703–6716. doi:10.1016/j.commatsci.2021.110578
52. Anand A, Unnikrishnan B, Wei SC, Chou CP, Zhang LZ, Huang CC. Graphene oxide and carbon dots as broad-spectrum antimicrobial agents-a minireview. Nano Horiz. 2019;4:117–137. doi:10.1039/c8nh00174j
53. Bing W, Sun H, Yan Z, Ren J, Qu X. Programmed bacteria death induced by carbon dots with different surface charge. Small. 2016;12:4713–4718. doi:10.1002/smll.201600294
54. Ghirardello M, Ramos-Soriano J, Galan MC. Carbon dots as an emergent class of antimicrobial agents. Nanomaterials. 2021;11:1877. doi:10.3390/nano11081877
55. Jones DE, Ghandehari H, Facelli JC. A review of the applications of data mining and machine learning for the prediction of biomedical properties of nanoparticles, Comput. Methods Programs Biomed. 2016;132:93–103. doi:10.1016/j.cmpb.2016.04.025
56. Yu Y, Tan X, Ning S, Wu Y. Machine learning for understanding compatibility of organic-inorganic hybrid perovskites with post-treatment amines. ACS Energy Lett. 2019;4:397–404. doi:10.1021/acsenergylett.8b02451
57. Sun B, Wu F, Zhang Q, et al. Insight into the effect of particle size distribution differences on the antibacterial activity of carbon dots. J Colloid Interface Sci. 2021;584:505–519. doi:10.1016/j.jcis.2020.10.015
58. Jin JC, Xu ZQ, Dong P, et al. One-step synthesis of silver nanoparticles using carbon dots as reducing and stabilizing agents and their antibacterial mechanisms. Carbon N Y. 2015;94:129–141. doi:10.1016/j.carbon.2015.05.084
59. Verma A, Arshad F, Ahmad K, et al. Role of surface charge in enhancing antibacterial activity of fluorescent carbon dots. Nanotechnology. 2020;31:095101. doi:10.1088/1361-6528/ab55b8
60. Peng J, Muhammad R, Wang SL, Zhong HZ. How machine learning accelerates the development of quantum dots? Chinese J Chem. 2021;39:181–188. doi:10.1002/cjoc.202000393
 © 2024 The Author(s). This work is published and licensed by Dove Medical Press Limited. The
full terms of this license are available at https://www.dovepress.com/terms.php
and incorporate the Creative Commons Attribution
- Non Commercial (unported, v3.0) License.
By accessing the work you hereby accept the Terms. Non-commercial uses of the work are permitted
without any further permission from Dove Medical Press Limited, provided the work is properly
attributed. For permission for commercial use of this work, please see paragraphs 4.2 and 5 of our Terms.
© 2024 The Author(s). This work is published and licensed by Dove Medical Press Limited. The
full terms of this license are available at https://www.dovepress.com/terms.php
and incorporate the Creative Commons Attribution
- Non Commercial (unported, v3.0) License.
By accessing the work you hereby accept the Terms. Non-commercial uses of the work are permitted
without any further permission from Dove Medical Press Limited, provided the work is properly
attributed. For permission for commercial use of this work, please see paragraphs 4.2 and 5 of our Terms.