")
Back to Journals » Clinical, Cosmetic and Investigational Dermatology » Volume 17
MALAT1 Knockdown Inhibits the Proliferation, Migration, and Collagen Deposition of Human Hypertrophic Scar Fibroblasts via Targeting miR-29a-3p/Smurf2 Axis
Authors Guo C , Liu X , Qiu K, Tu L, Liu D
Received 4 February 2024
Accepted for publication 6 May 2024
Published 12 June 2024 Volume 2024:17 Pages 1387—1404
DOI https://doi.org/10.2147/CCID.S460845
Checked for plagiarism Yes
Review by Single anonymous peer review
Peer reviewer comments 4
Editor who approved publication: Prof. Dr. Rungsima Wanitphakdeedecha
Chunyan Guo,1,2,* Xiaoxiao Liu,1,* Keqing Qiu,2 Longxiang Tu,1 Dewu Liu1
1Medical Center of Burn Plastic and Wound Repair, The First Affiliated Hospital, Jiangxi Medical College, Nanchang University, Nanchang, Jiangxi, People’s Republic of China; 2Department of Dermatology, The Second Affiliated Hospital, Jiangxi Medical College, Nanchang University, Nanchang, Jiangxi, People’s Republic of China
*These authors contributed equally to this work
Correspondence: Dewu Liu, Email [email protected]
Purpose: Hypertrophic scarring (HS) is commonly described as an abnormal post-traumatic tissue repair characterized by excessive hypercellularity and extracellular matrix (ECM) deposition. Mounting evidence suggests that MALAT1 is maladjusted in many fibrotic diseases, but its contribution to HS progression remains poorly understood. Hence, we sought to elucidate the fundamental role of MALAT1 in HS.
Methods: The expression of MALAT1, miR-29a-3p, and Smurf2 in skin tissues and fibroblasts was assessed by RT-qPCR and Western blotting. Furthermore, lentiviruses, RNAi, or plasmids were utilized to transfect hypertrophic scar fibroblasts (HSFs) for gene overexpression or downregulation. The biological behaviors of HSFs were quantified by the CCK-8 assay, wound healing assay, transwell assay, and flow cytometry. Mechanistically, bioinformatics analysis, dual-luciferase reporter assays, and rescue experiments were performed to verify the relationship between miR-29a-3p and MALAT1 or Smurf2.
Results: Our data indicate that MALAT1, Smurf2 were overexpressed while miR-29a-3p was suppressed in HS tissues and fibroblasts. Downregulation of MALAT1 may lead to decreased proliferation, migration, and invasion of fibroblasts, accompanied by enhanced apoptosis, reduced TGF-β signal transduction, and ECM accumulation in HSFs, by enhancing miR-29a-3p and suppressing Smurf2 expression. Mechanistically, MALAT1 acted as a sponge for miR-29a-3p, while miR-29a-3p directly targeted Smurf2. More importantly, rescue experiments suggested that MALAT1 downregulation induced impact on the proliferation, migration, and invasion of HSFs could be partially overturned through miR-29a-3p knockdown or Smurf2 overexpression.
Conclusion: MALAT1 knockdown inhibits the proliferation, migration, invasion, and collagen deposition of HSFs via targeting the miR-29a-3p/Smurf2 axis, which may reveal a promising therapeutic exploitable vulnerability to HS.
Keywords: hypertrophic scar, fibroblasts, MALAT1, miR-29a-3p, Smurf2, TGF-β signaling pathway
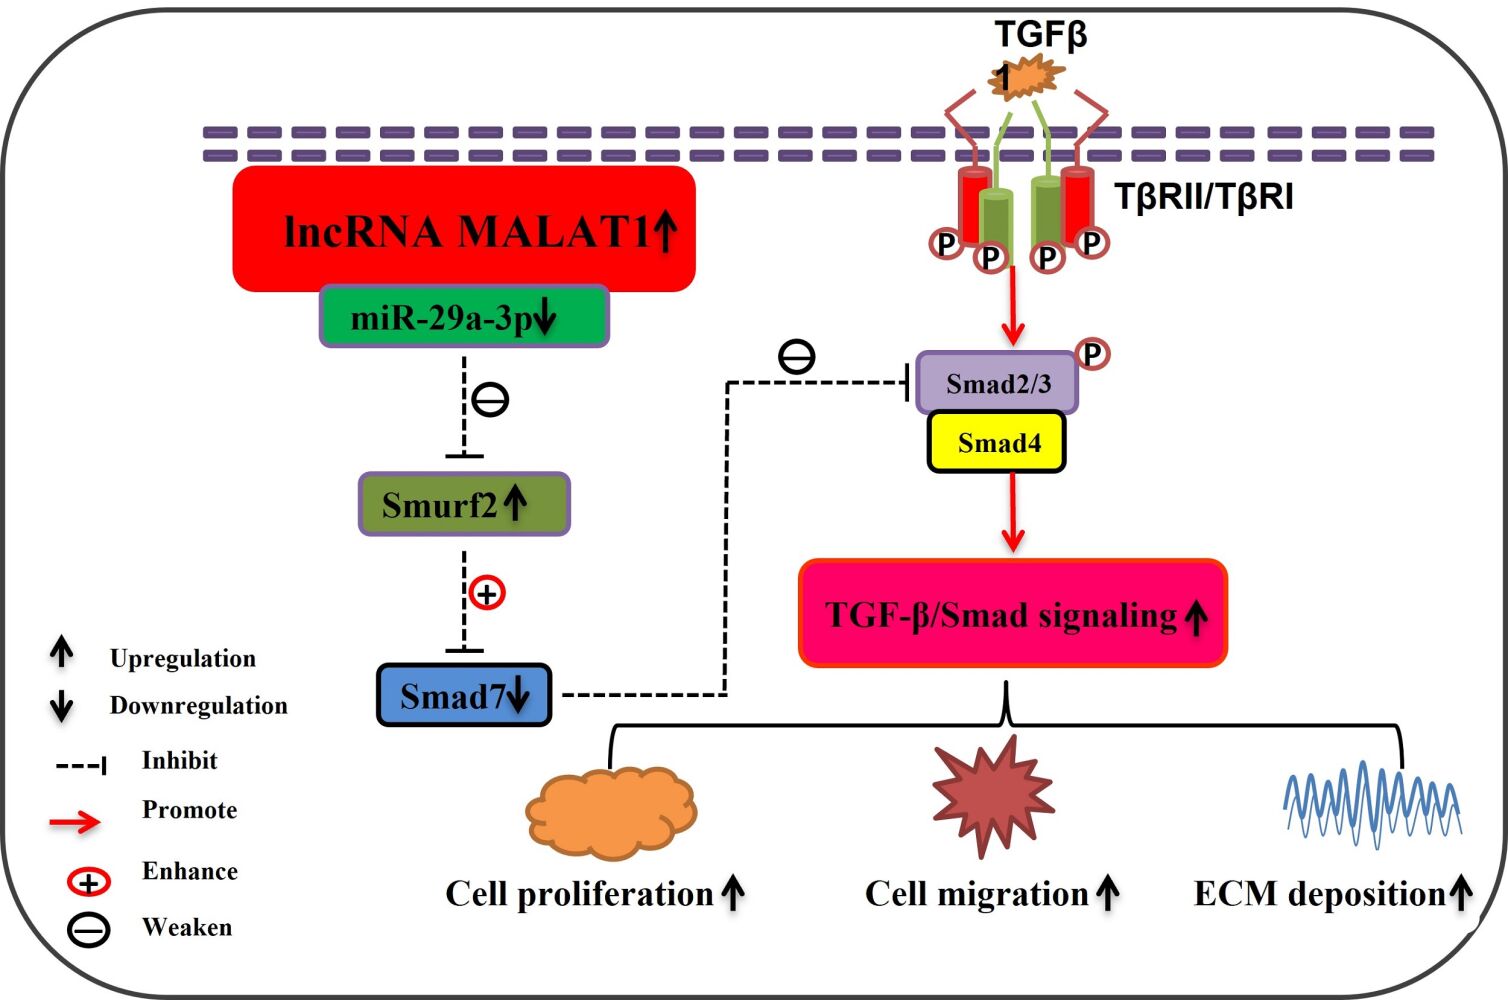
Graphical Abstract:
Introduction
Hypertrophic scarring (HS) is characterized by a fibroproliferative disorder resulting from an irregular healing process triggered by trauma, burns, surgery, skin ailments etc.1 HS can result in intense itching, pain, and contracture, negatively affecting the physical and psychological well-being of patients.2 The pathological processes underlying HS are intricate and not fully understood. At present, prophylactic and treatment strategies such as topical silicone gel, corticosteroid injections, pressure therapy, laser therapy, and surgical excision remain unsatisfactory, leaving HS with a high recurrence rate, which is a difficult problem in clinical practice.3–5 Thus, further investigation of the detailed mechanisms and identification of new effective therapeutic agents for HS are crucial for the management of this condition.
LncRNAs are a subgroup of RNAs greater than 200 nucleotides in length that have little or no protein-coding capacity. Increasing evidence suggests that lncRNAs are involved in a series of biological processes including development, differentiation, and metabolism,6 and can exert their functions by sponging microRNAs (miRNAs).7 In addition, lncRNAs have been shown to play critical roles in the development of HS.8 Among the numerous lncRNAs, MALAT1, one of the most extensively studied, has drawn our attention and has been documented to participate in various fibrotic conditions including liver fibrosis,9 renal fibrogenesis,10 cardiac fibrosis,11 and skin fibrosis.12 Hence, considering fibrosis as the primary pathological mechanism of HS, our hypothesis suggests a potential association between MALAT1 expression and HS progression. However, MALAT1 is not completely understood in terms of its biological functions and underlying mechanisms in HS.
MicroRNAs (miRNAs) are a class of RNAs that without protein-coding ability, and are typically composed of approximately 21–23 nucleotides. Generally, miRNAs can hinder translation or enhance the breakdown of target genes via post-transcriptional regulation by targeting the 3’UTR of mRNAs,13 which enables miRNAs to regulate diverse biological processes. Accumulating evidence suggests that miRNAs are pivotal factors in the development of HS.8,14 Importantly, miR-29 has been suggested to be down-regulated in HS and other fibrotic disorders.15–17
Smurf2, an E3 ubiquitin ligase known as Smad ubiquitin regulatory factor 2, has the ability to impede and facilitate the TGF-β signaling pathway, which is considered essential for scar formation.18,19 Moreover, previous research has demonstrated that Smurf2 is overexpressed in hypertrophic scar fibroblasts (HSFs), potentially leading to the degradation of Smad7 protein through ubiquitin, thus, the ability of Smad7 to provide negative feedback on TGF-β1 and hinder HS formation of HS was weakened.20,21
In accordance with previous studies, we explored the relationship between MALAT1, miR-29a-3p, and Smurf2 in HS formation. First, the abundance of MALAT1, miR-29a-3p, and Smurf2 was determined in HS tissues and fibroblasts. Moreover, we investigated the influence of MALAT1 on proliferation, migration, invasion, apoptosis, TGF-β signaling pathway, and extracellular matrix (ECM) accumulation in HSFs. Additionally, we investigated the underlying regulatory network of MALAT1/miR-29a-3p/Smurf2 in HSFs. We aimed to acquire a deeper understanding of the pathogenesis of HS by elucidating a new mechanism, thereby providing prophylactic and therapeutic strategies for hypertrophic scars.
Materials and Methods
Specimen Collection
The study was approved by the Medical Research Ethics Committee of the First Affiliated Hospital, Jiangxi Medical College, Nanchang University (approval number is (2023)CDYFYYLK(02–009). Written informed consent was obtained from all patients. We collected HS and corresponding normal skin (NS) tissues from patients undergoing surgery at the Medical Center of Burn Plastic and Wound Repair and the Department of Plastic Surgery in our hospital, according to the specified inclusion and exclusion criteria. Totally, 8 HS tissues with their adjacent normal skin tissues were collected, the demographic characteristics of each involved participants were represented in Table 1. Each specimen was divided into three sections under low-temperature conditions: one section for isolating fibroblasts, another for hematoxylin-eosin (HE) staining and Masson staining, and the third section for RNA and protein detection.
 |
Table 1 The Demographic Characteristics of Each Involved Participants |
Hematoxylin-Eosin and Masson Staining
The HS and NS tissues were preserved in 4% formaldehyde at room temperature (RT) for more than 48 h. Subsequently, they were dehydrated, embedded, sliced into sections that were 4-µm-thick, and finally stained using the HE staining kit (AR1180; Boster Biological Technology, Wuhan, China) and with Masson staining kit (BA4079; BaSO Biological Technology, Zhuhai, China), obeying the guidelines provided by the manufacturer. An Olympus microscope was used to capture the images.
Cell Culture
Skin fibroblasts obtained from the HS and NS groups were extracted and cultivated according to the “tissue block adherence” methodology. In brief, HS and NS specimens were individually rinsed three times with sterile PBS, then we removed the epidermis and hypodermal adipose tissues, the remaining dermis specimens were chopped into pieces approximately 3mm × 3mm × 3mm size, then modest amounts of 0.25% trypsin were added to digest the tissue pieces for 4 h at 37°C. Upon completion of digestion, the pieces were meticulously affixed to a petri dish in the absence of DMEM. Subsequently, cells were incubated in a cell incubator with inverted dishes for 1 h. Following Next, moderate amount of mixed medium containing DMEM (Solarbio, Beijing, China), 10% FBS (Gibco, USA), and 1% penicillin/streptomycin was added to the dishes, the dermal tissue fragments were then cultivated in an incubator with 5% CO2. Daily inspections were conducted to observe regular cell development. After reaching confluence, cells were subcultured. The third to fifth passages (P3-P5) of the fibroblasts were used for further experiments.
Cell Identification
Immunofluorescence staining was used to identify fibroblasts. After attachment to cell climbing sheets, cells were fixed for 30 min in 4% paraformaldehyde, treated with 0.05% Triton X-100 for 10 min, then incubated with 2% goat serum for 1 h at RT to prevent non-specific binding. Next, vimentin primary antibody (Proteintech,10,366-1-AP) was then diluted 1:100 and incubated overnight on the fixed cells at 4°C. The secondary antibody (Abcam; ab150077) conjugated with Alexa Fluor 488 was added in the dark environment at 37 °C for 1 hour, using a dilution of 1:1000. Then, the nuclei were stained with DAPI. Confocal microscopy (Olympus) was used to observe and photograph the cells. A positive status was assigned to fibroblasts exhibiting cytoplasmic coloration in green. Three randomly selected areas were used to determine the percentage of positive cells.
RT-qPCR
TRIzol reagent (catalogue no.ET111-01-V2) was used to extract the total RNA. EasyScript® One-Step gDNA Removal and cDNA Synthesis SuperMix (catalogue no. AE311) was used to synthesize the cDNA. The PerfectStart® Green qPCR SuperMix (catalogue no. AQ601) was used for RT-qPCR according to the manufacturer’s instructions (Bio-Rad). Data were calculated using the 2−∆∆CT method and standardized to GAPDH and U6 as internal references. The primer sequences are presented in Table 2. All the reagents were purchased from TransGen Biotech (Shanghai, China).
 |
Table 2 Sequences of the Primers Used in RT-qPCR |
Western Blot (WB)
RIPA lysis buffer (Solarbio, Beijing, China) containing phenylmethylsulfonyl fluoride (PMSF) and protease inhibitors was used to extract total proteins. The BCA method was used to determine protein concentrations. SDS-PAGE was used to separate the protein samples. The PVDF membranes were then used to transfer the protein bands. The blots were blocked for 2 h at RT with 5% skim milk (Yili, Beijing, China). Then probed at 4°C overnight using the primary antibodies as follow: Smurf2 (1:1000, ab53316, Abcam), TβR1 (1:1000, ab235578, Abcam), Smad2 (1:1000, no. 5339, Cell Signaling Technology), Smad3 (1:1000, no.9523, Cell Signaling Technology), COL1A1 (1:2000, ab138492, Abcam), α-SMA (1:4000, no.55135-1-AP, Proteintech), Smad7 (1:1000, no.25840-1-AP, Proteintech), GAPDH (1:1000, no.60004–1, Proteintech). The membranes were incubated with horseradish peroxidase–conjugated immunoglobulin G (IgG) anti-mouse/rabbit secondary antibodies (1:5000, SA00001-1/SA00001-2, Proteintech) for 1 h at RT. A chemiluminescent reagent (S6009S; UE, Beijing, China) was used to treat the membranes, and a ChemiDoc XRS Imaging System (Bio-Rad) was used to visualize the results. GAPDH was used as an internal control. Relative protein abundance was quantified using ImageJ software.
Cell Transfection
MALAT1 knockdown lentiviruses were provided by the Genechem Company (Shanghai, China). The constructed target sequences were sh-MALAT1-1:5′-ATGCGAGTTGTTC TCCGTCTA-3,’sh-MALAT1-2:5′-CATGACGGAGGTTGAGATGAA-3,’and sh-MALAT1-3: 5′-CTGCTATCTTAGCTGTCCTTA −3′. We screened for appropriate transfection conditions (MOI= 10+ HiTransG P). After 72 hours of transfection, puromycin was added to select stably infected HSFs.
The miR-29a-3p mimic, mimic negative control (mimic-NC), miR-29a-3p inhibitor, and inhibitor negative control (inhibitor-NC) were obtained from GeneChem. The pcDNA-Smurf2 overexpression plasmid (oe-Smurf2) and empty pcDNA vector (oe-NC) were provided by GenePharma (Shanghai, China). Lipofectamine 3000 Reagent (Invitrogen) was used for transfection. The sequences of synthetic oligonucleotides and vectors are listed in Table 3.
 |
Table 3 The Small Interferences Sequence |
Dual-Luciferase Reporter Assay
Bioinformatic databases were used to predict the possible complementary sequences between miR-29a-3p and MALAT1 or Smurf2. GenePharma manufactured the wild-type reporter plasmid (MALAT1-WT, Smurf2-WT) and mutant-type plasmid (MALAT1-MUT, Smurf2-MUT) according to the anticipated miR-29a-3p binding sites. Subsequently, the constructed reporter vector and miR-29a-3p mimic or mimic-NC were cotransfected into HSFs. Finally, a dual-luciferase Reporter Assay System (Promega, USA) was used to evaluate luciferase activity after 48 h.
CCK-8 Assay
Cell proliferation was estimated using the CCK-8 reagent (Dojindo, Japan). Each well of a 96-well plate was filled with 100μL of HSFs at a density of 5×10⁴ cells/mL. After 0, 24, 48, and 72 h, the 100uL mixture containing 10uL CCK-8 reagent and 90uL DMEM was added to each well and incubated for 2h. A microplate reader was used to assess the absorbance at 450 nm. Data were collected from six independent replicate wells for each group.
Wound Healing Assays
The wound healing assay was performed using the 2 wells ibidi Culture–Insert (ibidi, Germany) to detect the cell migration abilities of different groups. First, the culture inserts were placed in the center of 6-well plates to ensure that the bottoms were closely attached to the Petri dishes. Next, apply 70 µL of cell suspension at a density of approximately 5×10⁵ cells/mL and incubated under the standard conditions of 37°C and 5% CO2. Avoiding shaking as it can lead to uneven distribution of cells. The outer region can be optionally filled with a regular amount of the cell suspension or cell medium. The culture insert was gently removed when the cells reached confluence (approximately 24 h), using sterile tweezers. To aid the removal of cells that were not attached or had debris, the cells were washed twice with PBS. Then fill the wells with serum-free medium or medium containing 2%FBS. At 0, 12, 24, and 36-hour time intervals a Leica microscope (Leica, Germany) was used to capture digital images of scratch distance. Three independent replicate wells were used for each group.
Transwell Migration and Invasion Assays
The Transwell migration assay was performed using Transwell chambers (Corning, USA) containing 8-μm permeable pores. The upper chambers were filled with 100μL of cell suspension at a concentration of approximately 2×10⁵ cells/mL in serum-free medium. Meanwhile, the lower chambers were supplemented with 600μL medium containing 10% FBS. After incubated for 36h, the trans-membrane cells were treated with 4% paraformaldehyde and subsequently subjected to staining with 0.1% crystal violet. Images were obtained from three random areas using a microscope (Olympus). The obtained results were analyzed using ImageJ software. Notably, for the Transwell invasion assay, Matrigel (BD Biosciences, USA) was introduced into the upper chamber, and the following procedures resembled those of the migration test.
Flow Cytometry Apoptosis Assay
The Annexin V-FITC/propidium iodide (PI) Staining Apoptosis Detection Kit (catalogue no. FA101, TransGen Biotech, Beijing, China) or an Annexin V-APC/PI staining apoptosis detection kit (catalogue no.BB41033; Bestbio, Beijing, China) was used to detect cell apoptosis by Flow Cytometry (FCM). Briefly, when the cells were successfully transfected, the samples were collected, resuspended in 1×PBS Binding Buffer, and adjusted to the appropriate concentration. Next, 5 μL of Annexin V-APC or Annexin V-FITC along with 5μL of PI were introduced into a single-cell suspension in each labeled tube and cultivated in the dark for the appropriate time according to the manufacturer’s instructions. A NovoCyte D3000 flow cytometer (Agilent Technologies, USA) was used to analyze apoptotic cells.
Statistical Analysis
Analyses were conducted using GraphPad Prism software (version 8.0). Data are presented as the mean ± SEM of at least three independent experiments. To analyze the variation between groups, we used t-tests, one-way ANOVA, and two-way ANOVA. The correlation between miR-29a-3p and MALAT1 or Smurf2 expression was investigated using Pearson’s correlation analysis. Statistical significance was set at P< 0.05.
Results
MALAT1 Was Up-Regulated and TGF-β Signaling Pathway Was Overactivated in HS and HSFs
Tissues were collected from both the HS and matched normal skin (NS). Figures from HE and Masson staining revealed that the dermis layer in HS exhibited notable thickening due to the irregular deposition of collagen fibers, along with a substantial increase in fibroblast count compared to NS (Figure 1A and B). Primary skin fibroblasts were cultured using a previously established protocol,22 as illustrated in Figure 1C. Pieces of dermal tissue were affixed to a petri dish filled with moderate DMEM supplemented with 10% FBS. After approximately one week, a few fibroblasts were observed around the tissue edges. Over time, fibroblasts persistently emerged from the periphery of the tissue, displaying elongated spindle, triangular, or irregular shapes. Upon confluence, fibroblasts were closely arranged, intertwined, and cultured for several passages. Further experiments were conducted using fibroblast passages ranging from three to five. Immunofluorescence staining showed that the fibroblasts had blue nuclei and a green-stained cytoplasm, indicating the presence of vimentin, a standard fibroblast marker. Almost all cells exhibited positive staining, confirming that the cultured cells were indeed fibroblasts (Figure 1D).
 |
Figure 1 MALAT1 was up-regulated and TGF-β signaling pathway was over activated in HS and HSFs. (A and B) HE and Masson staining were used to analyze the histopathological features of HS and the matched NS tissues (×100, scale bar = 100 µm). (C) The process of primary skin fibroblasts culture was described (×100, scale bar = 100 µm). (D) Immunofluorescence staining was applied for fibroblasts identification (×200, scale bar = 50 µm). (E–J) RT-qPCR and Western Blot were employed to determine the abundance of MALAT1, the genes associated with TGF-β signaling pathway, such as TβRI, Smad7, Smad2, Smad3, and fibrosis indicators such as α-SMA and COL1A1 in HS and NS, as well as in HSFs and NSFs. ns P≥0.05,**P<0.01, *** P<0.001. |
RT-qPCR and WB were used to measure the abundance of MALAT1, along with genes associated with the TGF-β signaling pathway, including TβRI, Smad7, Smad2, Smad3, and fibrosis indicators such as α-SMA and COL1A1, in HS and NS, as well as in HSFs and NSFs. The results showed that MALAT1, TβRI, Smad2, Smad3, α-SMA, and COL1A1 expression was significantly enhanced in HS and HSFs compared to that in NS and NSFs. However, no significant difference was observed between the two groups in terms of the abundance of Smad7, a suppressor of the TGF signaling pathway. These findings suggest that MALAT1 is upregulated and that the TGF-β signaling pathway is overactivated in HS tissues and fibroblasts (Figure 1E-J). Thus, we postulated that MALAT1 might play a crucial role in triggering the TGF-β signaling pathway and promoting the advancement of HS.
MALAT1 Downregulation Impeded the Proliferation, Migration, Invasion, Induced Apoptosis and Suppressed TGF-β Signaling Pathway in HSFs
MALAT1 downregulation lentiviruses (Genechem, Shanghai, China) were transfected into the HSFs. According to the RT-qPCR findings, when compared to the blank and sh-NC groups, the expression of MALAT1 in sh-MALAT1-1, sh-MALAT1-2, and sh-MALAT1-3 groups was decreased in HSFs, while the reduction was more pronounced in the sh- MALAT1-1 and sh-MALAT1-2 groups (Figure 2A), confirming that the transfection interference efficiency was satisfactory and we successfully constructed the interference HSFs model.
 |
Figure 2 MALAT1 downregulation impeded the development of HS. HSFs were transfected with sh-NC, sh-MALAT1-1, sh-MALAT1-2 or sh-MALAT1-3. (A) The interference efficiency of MALAT1 downregulation lentiviruses was evaluated by RT-qPCR. (B) Cell proliferation ability was manifested by CCK-8 assay. (C and D) Wound healing assay and Transwell migration assay were utilized both to determine cell migration. (E) Transwell invasion assay was performed to measure cell invasion abilities (×50, scale bar = 100 µm). (F) FCM was applied to analyze cell apoptosis. (G) The protein expression of TβRI, Smad2, Smad3, Smad7, α-SMA, COL1A1 were estimate by Western blot assay. *P<0.05, **P<0.01, *** P<0.001. |
We further verified the effects of MALAT1 on the physiological characteristics of HSFs. CCK-8 assays showed that MALAT1 silencing significantly inhibited the proliferation of HSFs (Figure 2B). Notably, wound healing and Transwell assays revealed that MALAT1 downregulation restrained the migration of HSFs (Figure 2C and D). Matrigel invasion assays suggested that MALAT1 knockdown represses the invasion of HSFs (Figure 2E). Moreover, flow cytometry (FCM) assay results showed that the apoptosis were increased after MALAT1 downregulation in HSFs (Figure 2F). Western blotting results indicated that MALAT1 downregulation significantly reduced the protein abundance of TβRI, Smad2, Smad3, α-SMA, and COL1A1 and increased the protein expression of Smad7 (Figure 2G). Conclusively, MALAT1 knockdown negatively affects HS formation through the regulation of proliferation, migration, invasion, apoptosis, and the TGF-β signaling pathway in HSFs.
MALAT1 Directly Targeted miR-29a-3p in HSFs
The prediction results of the BiBiServ2-RNAhybrid database exhibited that miR-29a-3p interacts with MALAT1 in several regions (Figure 3A). MiR-29a-3p mimic co-transfection weakened the luciferase activity of HSFs in the WT-MALAT1 group but did not affect the MUT-MALAT1 group (Figure 3B). RT-qPCR analysis implied that miR-29a-3p expression in the HS and HSFs groups was lower than that in the NS and NSFs groups (Figure 3C and D). Concomitantly, MALAT1 knockdown resulted in upregulation of miR-29a-3p in HSFs (Figure 3E). Pearson’s correlation analysis indicated that MALAT1 was negatively correlated with miR-29a-3p expression in HS tissues (Figure 3F). In conclusion, miR-29a-3p is a direct target of MALAT1 and is negatively regulated by MALAT1 in HSFs.
 |
Figure 3 MALAT1 directly targeted miR-29a-3p in HSFs. (A) MALAT1 had several possible interaction regions with miR-29a-3p. (B) The relative luciferase activity was evaluated by dual-luciferase reporter assay in HSFs. (C and D) RT-qPCR was utilized to analyze the expression of miR-29a-3p in HS and NS, as well as in HSFs and NSFs. (E) The expression of miR-29a-3p was calculated by RT-qPCR in HSFs transfected with MALAT1 knockdown lentiviruses. (F) Pearson correlation analysis was carried out to analyze the expression correlation between MALAT1 and miR-29a-3p in HS tissues. **P<0.01, *** P<0.001. |
MALAT1 knockdown regulated the proliferation, migration, invasion and apoptosis of HSFs by impacting miR-29a-3p
HSFs were transfected with mimic-NC, miR-29a-3p mimic, inhibitor-NC, or miR-29a-3p inhibitor. Initially, the transfection efficiency of miR-29a-3p was calculated by RT-qPCR. As presented in Figure 4A after transfection, the abundance of miR-29a-3p was increased in the miR-29a-3p mimic group but decreased in the miR-29a-3p inhibitor group, suggesting satisfactory transfection efficiency in HSFs. Subsequently, the effects of miR-29a-3p on the biological processes of HSFs were investigated. CCK-8 assays indicated that miR-29a-3p downregulation enhanced the proliferation of HSFs, whereas miR-29a-3p overexpression markedly reduced cell proliferation (Figure 4B). As shown in Figure 4C and D Transwell migration assay and wound healing assay results both indicated that in the miR-29a-3p mimic group, the migration capacity of HSFs was repressed, but in the miR-29a-3p inhibitor group, cell migration was enhanced. Matrigel invasion assays showed that the number of invasive HSFs was lower than that in the mimic-NC group, whereas there were more invasive cells in the miR-29a-3p inhibitor group than in the inhibitor-NC group (Figure 4E). These findings demonstrated that miR-29a-3p is crucial for inhibiting the progression of HS.
 |
Figure 4 MALAT1 knockdown suppressed the progression of HS by impacting miR-29a-3p. (A–E) HSFs were transfected with mimic-NC, miR-29a-3p mimic, Inhibitor-NC, or miR-29a-3p inhibitor. (F– I) HSFs were transfected with sh-NC, sh-MALAT1-2, sh-MALAT1-2+inhibitor-NC, or sh-MALAT1-2 + miR-29a-3p inhibitor. (A) Transfection efficiency of miR-29a-3p was quantified by RT-qPCR. (Band F) CCK-8 assay was performed to evaluate cell proliferation ability. (Cand H) Transwell migration assay was utilized to determine cell migration abilities (×50, scale bar = 100 µm). (Dand G) Wound healing assay was performed to exam cell migration abilities (×100, scale bar = 100 µm). (Eand I) Transwell invasion assay was applied to measure cell invasion abilities (×50, scale bar = 100 µm). *P<0.05, **P<0.01, *** P<0.001. |
To further elucidate whether the involvement of MALAT1 in the progression of HS was mediated by its interaction with miR-29a-3p, rescue assays were performed. HSFs were transfected with sh-NC, sh-MALAT1-2, sh-MALAT1-2+ inhibitor-NC, or sh-MALAT1-2 + miR-29a-3p inhibitors. CCK-8, scratch, transwell migration, and invasion assays indicated that the decrease in miR-29a-3p partially mitigated the suppressive effect of MALAT1 deficiency on proliferation, migration, and invasion (Figure 4F–I). These data revealed that MALAT1 knockdown regulates the proliferation, migration, invasion, and apoptosis of HSFs by affecting miR-29a-3p.
MiR-29a-3p Negatively Regulated Smurf2 Expression in HSFs
Bioinformatic analysis indicated that several predicted binding sites existed between Smurf2 and miR-29a-3p (Figure 5A). In addition, the luciferase activity of HSFs in the Smurf2 3 UTR-WT group was significantly repressed by the miR-29a-3p mimic, but in the Smurf2 3 UTR-MUT group, the luciferase activity was unaffected (Figure 5B). In addition, the mRNA and protein expression of Smurf2 was elevated in HS and HSFs compared to that in the corresponding NS and NSFs, respectively (Figure 5C–F). Additionally, increased miR-29a-3p expression led to decreased Smurf2 expression in HSFs (Figure 5G and H). Finally, correlation analysis demonstrated that Smurf2 and miR-29a-3p were negatively correlated with their expression in HS tissues (Figure 5I). In summary, Smurf2 was overexpressed in HS and HSFs and was negatively regulated by miR-29a-3p in HSFs.
 |
Figure 5 MiR-29a-3p negatively regulated Smurf2 expression in HSFs. (A) The predicted potential interaction sites between miR-29a-3p and Smurf2, along with the mutated nucleotides of Smurf2 were displayed. (B) Dual-luciferase reporter assay was applied to analyze the luciferase activities in HSFs. (C–F) The mRNA and protein expression of Smurf2 were assessed using RT-qPCR and Western blot assays in HS and NS, as well as in HSFs and NSFs. (G and H) RT-qPCR and Western blot assays were performed to quantify the expression of Smurf2 in HSFs after silencing or overexpressing of miR-29a-3p. (I) The relationship between miR-29a-3p and Smurf2 was conducted by Pearson correlation analysis in HS tissues. *P<0.05, **P<0.01, *** P<0.001. |
Smurf2 Downregulation Suppressed Proliferation, Migration, Invasion, and TGF-β Signaling Pathway but Induced Apoptosis in HSFs
Since the expression of Smurf2 was elevated, we designed three small interfering RNAs (si-Smurf2-1, si-Smurf2-2, and si-Smurf2-3) to knockdown the expression of Smurf2 in HSFs, thus investigating the influence of Smurf2 on the progression of HS formation. RT-qPCR findings verified that Smurf2 mRNA expression significantly decreased following the introduction of the three si-Smurf2 molecules, with the reduction being more pronounced in the si-Smurf2-2 group. Moreover, the Western blot assay demonstrated a noticeable decrease in Smurf2 protein expression, suggesting successful transfection of si-Smurf2-2 into HSFs (Figure 6A and B). The CCK-8 assay confirmed that Smurf2 knockdown inhibited the proliferation of HSFs (Figure 6C). Transwell migration and wound healing assays showed that Smurf2 downregulation inhibited the migration HSFs (Figure 6E and F). Transwell invasion assay results implied that the downregulation of Smurf2 suppressed the invasion ability of HSFs (Figure 6G). Furthermore, FCM results suggested that Smurf2 knockdown led to a significant increase in the apoptosis of HSFs (Figure 6H). In addition, we estimated the protein expression after transfection with si-Smurf2 in HSFs. As presented in Figure 6D, the protein expression of TGF-β signaling-related molecules, such as TβRI, Smad2, and Smad3, decreased, while that of Smad7 increased. Proteins associated with the ECM, such as Collagen I and α-SMA, were repressed in the si-Smurf2 group compared to those in the si-NC group. In summary, these data implied that Smurf2 downregulation suppressed proliferation, migration, and invasion, reduced the TGF-β signaling pathway and ECM accumulation while inducing apoptosis in HSFs.
 |
Figure 6 Smurf2 downregulation suppressed the development of HS. Transfection of HSFs was performed using si-NC or si-Smurf2. (A and B) RT−qPCR and Western blot assay were performed both to measure the interference efficiency of si-Smurf2. (C) CCK-8 assay was utilized to analyze cell proliferation. (D) The expression of TGF-β signaling-related and ECM-related proteins were estimated by Western blot assay. (E and F) Scratch Assays and Transwell migration assay were used both to determine cell migration abilities (×50, scale bar = 100 µm). (G) Transwell invasion assay was utilized to assess migratory capabilities of cells (×50, scale bar = 100 µm). (H) Flow cytometry was applied to test cell apoptosis. **P<0.01, ***P<0.001. |
MALAT1 Knockdown Hindered the Progression of HS via Downregulating Smurf2 Expression
Next, we explored the relationship between MALAT1 and Smurf2 expressions in HSFs. The findings manifested that MALAT1 knockdown led to a decline in both RNA and protein levels of Smurf2 (Figure 7A and B), indicating that MALAT1 positively regulates Smurf2. Furthermore, we transfected HSFs with sh-NC, sh-MALAT1-2, sh-MALAT1-2 +oe-NC, and sh-MALAT1-2 +oe-Smurf2 for the purpose of further investigate whether the influence of MALAT1 was mediated by Smurf2. These findings suggest that Smurf2 overexpression may be able to somewhat mitigate the inhibitory effect of MALAT1 knockdown on proliferation, migration and invasion of HSFs (Figure 7C -F). These findings suggested that through suppressing Smurf2 expression, MALAT1 knockdown hampers the development of HS.
 |
Figure 7 MALAT1 knockdown hindered the progression of HS via downregulating Smurf2 expression. (A and B) RT-qPCR and Western blot assays were performed to detect the mRNA and protein expression of Smurf2 in HSFs after downregulation of MALAT1. (C–F) HSFs were transfected with sh-NC, sh-MALAT1-2, sh-MALAT1-2 + oe-NC, or sh-MALAT1-2 +oe-Smurf2. (C) Cell proliferation ability was evaluated by CCK-8 assay. (D and E) Cell migration capacity was determined by Scratch Assays (×100, scale bar = 100 µm) and Transwell migration assay (×50, scale bar = 100 µm). (F) Cell invasion ability was tested by Transwell invasion assay (×50, scale bar = 100 µm). *** P<0.001. |
Discussion
The overactivation of fibroblasts and excessive ECM deposition are typical features of HS.23 Substantial evidence suggests that fibroblasts are key players in the pathophysiological mechanisms of HS and that abnormal proliferation of fibroblasts directly affects scar formation.24,25 Additionally, it is widely believed that the TGF-β signaling pathway contributes significantly to the regulation of the biological functions of fibroblasts in HS.26,27 Consistent with previous studies, our findings also demonstrated that the TGF-β signaling pathway is excessively activated in HS. Nonetheless, the upstream regulatory mechanisms need to be thoroughly elucidated. With the development of modern biomedical science, mounting evidence suggests that ncRNAs are involved in the development of HS.8,22 As mentioned previously, MALAT1 is upregulated in various fibrotic diseases, and notably enhanced MALAT1 expression was confirmed in HS and HSFs in this study. Furthermore, loss-of-function experiments indicated that MALAT1 knockdown suppressed proliferation, migration, and invasion, inhibited the TGF-β signaling pathway and excessive ECM accumulation, while simultaneously enhancing apoptosis in HSFs. Our findings suggest that MALAT1 has the potential of being a biomarker of HS.
Moreover, lncRNAs are thought to attenuate the influence of miRNAs on target genes by acting as miRNA sponges.28 Hence, we explored the possible binding regions between MALAT1 and miR-29a-3p using a bioinformatic website. Subsequently, this prediction was confirmed through a dual-luciferase reporter assay, which demonstrated that MALAT1 is a direct target of miR-29a-3p. Furthermore, our findings demonstrate that MALAT1 downregulation results in the upregulation of miR-29a-3p. As previously described, miR-29 is believed to be of importance in fibrotic diseases.29 It had been reported that the scar group exhibited significantly lower levels of miR-29a-3p, which negatively regulates TGF-β1 and COL1 expression and ECM deposition.17,30 Further investigation revealed that miR-29 mimics suppressed collagen accumulation and the development of fibroplasia, suggesting their potential as promising therapeutic agent for HS.16 Analogously, in our study, RT-qPCR results showed downregulation of miR-29a-3p in HS and HSFs compared to the corresponding NS and NSFs. We also observed a negative correlation between MALAT1 and miR-29a-3p expression in the HS tissues. Next, we demonstrated that elevation of miR-29a-3p hindered the proliferation, migration, and invasion abilities of HSFs. Conversely, knockdown of miR-29a-3p resulted in the opposite effect. Rescue experiments suggested that MALAT1 knockdown’s detrimental effects on the proliferation, migration, and invasion abilities of HSFs may be partially reversed by miR-29a-3p downregulation. The combined findings verified that MALAT1 functions as a ceRNA by directly targeting miR-29a-3p, thereby positively regulating the formation of HS.
Generally, miRNAs are thought to directly interact with the 3’-UTR region of mRNAs, thus emphasizing the negative regulation of target genes.31 To identify the potential target of miR-29a-3p, we conducted bioinformatic prediction and found that it could also bind to Smurf2. This result was further validated by a dual-luciferase test, which confirmed that miR-29a-3p specifically targeted Smurf2 in HSFs. As an important member of the HECT-type E3 ubiquitin ligase family, Smurf2 regulates the degradation of TGF-β receptors (TβRs) and Smad-associated proteins via the Ubiquitin Proteasome Pathway (UPP).32 In addition, our prior investigation revealed crosstalk between UPP and the TGF-β signaling pathway.33 Smad7, a member of the I-Smad subfamily, is believed to exert a detrimental influence on the TGF-β signaling pathway by inhibiting the activation of SMAD proteins. According to several researches, Smad7 attracts Smurf2 to form I-Smad-Smurf2 in the nucleus and then attaches to the TβRs in the cytoplasm to form the Smad7-Smurf2-TβRs complex, which facilitates the breakdown of the TβRs through the UPP pathway.34,35 A previous study showed that Smurf2 expression was notably enhanced in HSFs and mediated the degradation of smad7 through the UPP, relieving the inhibitory impact of smad7 on TGF-β signaling and promoting scar development.21 Likewise, RT-qPCR and WB assays confirmed that Smurf2 was also upregulated in HS tissues and fibroblasts. Additionally, the abundance of Smurf2 and miR-29a-3p in HS tissues was negatively correlated with the Pearson’s correlation analysis. Furthermore, miR-29a-3p upregulation suppressed the expression of Smurf2, whereas miR-29a-3p downregulation promoted Smurf2 expression. We then focused on the function of Smurf2 in HS. Following transfection with si-RNAs, the expression of Smurf2 was downregulated following siRNA transfection. Subsequently, the proliferation, migration, invasion, TGF-β signal transduction, and collagen synthesis of HSFs were attenuated, whereas cell apoptosis was enhanced. In summary, these findings imply that Smurf2 directly interacts with miR-29a-3p and positively regulates the development of HS through elevated expression. In addition, our prior investigation revealed crosstalk between UPP and the TGF-β signaling pathway.
Finally, we elucidated the regulatory connection between MALAT1 and Smurf2 in HS. We noticed that inhibition of MALAT1 impeded the RNA and protein expression of Smurf2. Furthermore, rescue assays indicated that the upregulation of Smurf2 could partially overturn the effects of MALAT1 silencing on the proliferation, migration, and invasion capabilities of HSFs.
Collectively, our investigation initially discovered that MALAT1 and Smurf2 exhibited increased expression, whereas miR-29a-3p displayed decreased expression in both HS and HSFs. Furthermore, MALAT1 downregulation hinders the development of HS by upregulating miR-29a-3p and downregulating Smurf2 expression. Mechanistically, downregulation of MALAT1 hampered proliferation, migration, and invasion, while stimulating apoptosis of HSFs, inhibited TGF-β signal transduction, and excessive accumulation of ECM by targeting the miR-29a-3p/Smurf2 axis. This discovery could aid in elucidating the mechanisms underlying the development of HS and provide new insights into potential therapeutic strategies for HS.
Nevertheless, there were certain limitations to our research. First, we discovered that MALAT1 expression was enhanced in HS and HSFs; however, the factors responsible for the upregulation of MALAT1 have not been investigated. Second, since the regulatory networks encompassing lncRNAs/miRNAs/mRNAs exhibit a high degree of complexity, we only elucidated the underlying mechanism of the MALAT1/miR-29a-3p/Smurf2 axis in HSFs in vitro. Therefore, the precise influence of the MALAT1/miR-29a-3p/Smurf2 axis on HS requires thorough in vivo researches in the further investigations.
Conclusion
In conclusion, our results indicate that MALAT1 and Smurf2 are overexpressed in HS tissues and fibroblasts, whereas miR-29a-3p is suppressed. MALAT1 knockdown inhibits the proliferation, migration, invasion, and collagen deposition of HSFs via targeting the miR-29a-3p/Smurf2 axis, which may reveal a promising therapeutic target for HS.
Abbreviations
HS, hypertrophic scar; NS, normal skin; lncRNA, long non-coding RNAs; MALAT1, metastasis-associated lung adenocarcinoma transcript 1; miRNA, microRNA; Smurf2, Smad ubiquitin regulatory factor 2; NSFBs, normal skin fibroblasts; HSFBs, hypertrophic scar fibroblasts; TGF-β, growth factor beta; ECM, extracellular matrix.
Data Sharing Statement
All data used and analyzed to support the findings of this study are available from the corresponding author upon reasonable request.
Ethics Approval and Informed Consent
All the procedures were performed in accordance with the principles of the Declaration of Helsinki. The study was approved by the Medical Research Ethics Committee of the First Affiliated Hospital, Jiangxi Medical College, Nanchang University ((2023)CDYFYYLK(02-009), December 14, 2022). Written informed consent was obtained from each patient.
Acknowledgments
The authors express their deep gratitude to Zhujun Cheng from the Institute of Burn Research at the First Affiliated Hospital, Jiangxi Medical College, Nanchang University, for kindly providing valuable guidance during experimental procedures.
Author Contributions
Chunyan Guo and Xiaoxiao Liu: Conceptualization, Data curation, Formal Analysis, Investigation, Methodology, Validation, Visualization, Software, Writing–original draft, writing–review, and editing. Keqing Qiu: Conceptualization, Methodology, Investigation, Formal analysis, writing, review, and editing. Longxiang Tu: Project administration, Validation, Funding acquisition, writing, review, and editing. Dewu Liu: Conceptualization, Funding acquisition, Resources, Project administration, Supervision, Writing, review, and editing. All authors made a significant contribution to study design, data analysis, drafting or revising the article, have agreed on the journal to which the article has been submitted, gave final approval of the version to be published, and agree to be accountable for all aspects of the work.
Funding
This research was funded by the National Natural Science Foundation of China (Grant Number: 82160378, Grant Number:81860340) and the Young Talent Research and Cultivation Project of The First Affiliated Hospital, Jiangxi Medical College, Nanchang University (Grant Number: YFYPY202205).
Disclosure
The authors declare that they have no known competing financial interests or personal relationships that could have appeared to influence the work reported in this paper.
References
1. Finnerty CC, Jeschke MG, Branski LK, Barret JP, Dziewulski P, Herndon DN. Hypertrophic scarring: the greatest unmet challenge after burn injury. Lancet. 2016;388(10052):1427–1436. doi:10.1016/S0140-6736(16)31406-4
2. Zhang J, Li Y, Bai X, Li Y, Shi J, Hu D. Recent advances in hypertrophic scar. Histol Histopathol. 2018;33(1):27–39. doi:10.14670/HH-11-908
3. Ogawa R. The most current algorithms for the treatment and prevention of hypertrophic scars and keloids: a 2020 update of the algorithms published 10 years ago. Plast Reconstr Surg. 2022;149(1):79–94. doi:10.1097/PRS.0000000000008667
4. Frech FS, Hernandez L, Urbonas R, Zaken GA, Dreyfuss I, Nouri K. Hypertrophic scars and keloids: advances in treatment and review of established therapies. Am J Clin Dermatol. 2023;24(2):225–245. doi:10.1007/s40257-022-00744-6
5. Shirakami E, Yamakawa S, Hayashida K. Strategies to prevent hypertrophic scar formation: a review of therapeutic interventions based on molecular evidence. Burns Trauma. 2020;8:tkz003. doi:10.1093/burnst/tkz003
6. Wang KC, Chang HY. Molecular mechanisms of long noncoding RNAs. Mol Cell. 2011;43(6):904–914. doi:10.1016/j.molcel.2011.08.018
7. Paraskevopoulou MD, Hatzigeorgiou AG. Analyzing MiRNA-LncRNA Interactions. Methods Mol Biol. 2016;1402:271–286. doi:10.1007/978-1-4939-3378-5_21
8. Chen L, Li J, Li Q, et al. Non-coding RNAs: the new insight on hypertrophic scar. J Cell Biochem. 2017;118(8):1965–1968. doi:10.1002/jcb.25873
9. Wang Y, Mou Q, Zhu Z, Zhao L, Zhu L. MALAT1 promotes liver fibrosis by sponging miR‑181a and activating TLR4‑NF‑kappaB signaling. Int J Mol Med. 2021;48(6):215. doi:10.3892/ijmm.2021.5048
10. Liu P, Zhang B, Chen Z, et al. m(6)A-induced lncRNA MALAT1 aggravates renal fibrogenesis in obstructive nephropathy through the miR-145/FAK pathway. Aging. 2020;12(6):5280–5299. doi:10.18632/aging.102950
11. Yan Y, Song D, Song X, Song C. The role of lncRNA MALAT1 in cardiovascular disease. IUBMB Life. 2020;72(3):334–342. doi:10.1002/iub.2210
12. Jin J, Liu Y, Tang Q, et al. Bioinformatics-integrated screening of systemic sclerosis-specific expressed markers to identify therapeutic targets. Front Immunol. 2023;14:1125183. doi:10.3389/fimmu.2023.1125183
13. Tay Y, Rinn J, Pandolfi PP. The multilayered complexity of ceRNA crosstalk and competition. Nature. 2014;505(7483):344–352. doi:10.1038/nature12986
14. Banerjee J, Sen CK. MicroRNAs in skin and wound healing. Methods Mol Biol. 2013;936:343–356. doi:10.1007/978-1-62703-083-0_26
15. Cushing L, Kuang P, Lu J. The role of miR-29 in pulmonary fibrosis. Biochem Cell Biol. 2015;93(2):109–118. doi:10.1139/bcb-2014-0095
16. Gallant-Behm CL, Piper J, Lynch JM, et al. A microRNA-29 mimic (Remlarsen) represses extracellular matrix expression and fibroplasia in the skin. J Invest Dermatol. 2019;139(5):1073–1081. doi:10.1016/j.jid.2018.11.007.
17. Bi S, Cao C, Chai LL, Li SR, Yang DY. Regulatory mechanism of miR-29 over TGF-beta1 and COL1 in scar cells. Eur Rev Med Pharmacol Sci. 2017;21(10):2512–2517.
18. Ogunjimi AA, Briant DJ, Pece-Barbara N, et al. Regulation of Smurf2 ubiquitin ligase activity by anchoring the E2 to the HECT domain. Mol Cell. 2005;19(3):297–308. doi:10.1016/j.molcel.2005.06.028
19. Bai Y, Ying Y. The post-translational modifications of Smurf2 in TGF-beta Signaling. 10.3389/fmolb.2020.00128. Front Mol Biosci. 2020;7:128.
20. Zhang Z, Finnerty CC, He J, Herndon DN. Smad ubiquitination regulatory factor 2 expression is enhanced in hypertrophic scar fibroblasts from burned children. Burns. 2012;38(2):236–246. doi:10.1016/j.burns.2011.08.012
21. Zhang Z, Liu C, Chen B, et al. Smad7 down-regulation via ubiquitin degradation mediated by Smurf2 in fibroblasts of hypertrophic scars in burned patients. Burns. 2021;47(6):1333–1341. doi:10.1016/j.burns.2020.12.017
22. Tu L, Huang Q, Fu S, Liu D. Aberrantly expressed long noncoding RNAs in hypertrophic scar fibroblasts in vitro: a microarray study. Int J Mol Med. 2018;41(4):1917–1930. doi:10.3892/ijmm.2018.3430
23. Nabai L, Pourghadiri A, Ghahary A. Hypertrophic scarring: current knowledge of predisposing factors, cellular and molecular mechanisms. J Burn Care Res. 2020;41(1):48–56. doi:10.1093/jbcr/irz158
24. Bainbridge P. Wound healing and the role of fibroblasts. J Wound Care. 2013;22(8):407–8, 410–12. doi:10.12968/jowc.2013.22.8.407
25. Darby IA, Desmouliere A. Scar Formation: cellular Mechanisms. Cellular Mech. 2020;19–26. doi:10.1007/978-3-030-44766-3_3
26. Lichtman MK, Otero-Vinas M, Falanga V. Transforming growth factor beta (TGF-beta) isoforms in wound healing and fibrosis. Wound Repair Regen. 2016;24(2):215–222. doi:10.1111/wrr.12398
27. Carthy JM. TGFbeta signaling and the control of myofibroblast differentiation: implications for chronic inflammatory disorders. J Cell Physiol. 2018;233(1):98–106. doi:10.1002/jcp.25879
28. Su K, Wang N, Shao Q, Liu H, Zhao B, Ma S. The role of a ceRNA regulatory network based on lncRNA MALAT1 site in cancer progression. Biomed Pharmacother. 2021;137:111389. doi:10.1016/j.biopha.2021.111389
29. Schneider MR. MicroRNAs as novel players in skin development, homeostasis and disease. Br J Dermatol. 2012;166(1):22–28. doi:10.1111/j.1365-2133.2011.10568.x
30. Cheng J, Wang Y, Wang D, Wu Y. Identification of collagen 1 as a post-transcriptional target of miR-29b in skin fibroblasts: therapeutic implication for scar reduction. Am J Med Sci. 2013;346(2):98–103. doi:10.1097/MAJ.0b013e318267680d
31. Lu TX, Rothenberg ME. MicroRNA. J Allergy Clin Immunol. 2018;141(4):1202–1207. doi:10.1016/j.jaci.2017.08.034
32. Shen W, Zhang Z, Ma J, Lu D, Lyu L. The Ubiquitin Proteasome System and Skin Fibrosis. Mol Diagn Ther. 2021;25(1):29–40. doi:10.1007/s40291-020-00509-z
33. Tu L, Lin Z, Huang Q, Liu D. USP15 enhances the proliferation, migration, and collagen deposition of hypertrophic scar–derived fibroblasts by deubiquitinating TGF-βR1 In Vitro. Plastic Recons Surg. 2021;148(5):1040–1051. doi:10.1097/PRS.0000000000008488
34. Asano Y, Ihn H, Yamane K, Kubo M, Tamaki K. Impaired Smad7-Smurf-mediated negative regulation of TGF-beta signaling in scleroderma fibroblasts. J Clin Invest. 2004;113(2):253–264. doi:10.1172/JCI16269
35. Wojtowicz S, Lee S, Chan E, Ng E, Campbell CI, Di Guglielmo GM. SMURF2 and SMAD7 induce SARA degradation via the proteasome. Cell Signal. 2020;72:109627. doi:10.1016/j.cellsig.2020.109627
 © 2024 The Author(s). This work is published and licensed by Dove Medical Press Limited. The
full terms of this license are available at https://www.dovepress.com/terms.php
and incorporate the Creative Commons Attribution
- Non Commercial (unported, v3.0) License.
By accessing the work you hereby accept the Terms. Non-commercial uses of the work are permitted
without any further permission from Dove Medical Press Limited, provided the work is properly
attributed. For permission for commercial use of this work, please see paragraphs 4.2 and 5 of our Terms.
© 2024 The Author(s). This work is published and licensed by Dove Medical Press Limited. The
full terms of this license are available at https://www.dovepress.com/terms.php
and incorporate the Creative Commons Attribution
- Non Commercial (unported, v3.0) License.
By accessing the work you hereby accept the Terms. Non-commercial uses of the work are permitted
without any further permission from Dove Medical Press Limited, provided the work is properly
attributed. For permission for commercial use of this work, please see paragraphs 4.2 and 5 of our Terms.