")
Back to Journals » International Journal of Nanomedicine » Volume 19
Mesoporous Graphene Oxide Nanocomposite Effective for Combined Chemo/Photo Therapy Against Non-Small Cell Lung Cancer
Authors Zhang P, Zheng L, Zhang X, Liu M, Li M, Zhang M, Wu JL , Choi MM , Bian W
Received 7 March 2024
Accepted for publication 12 July 2024
Published 24 July 2024 Volume 2024:19 Pages 7493—7508
DOI https://doi.org/10.2147/IJN.S460767
Checked for plagiarism Yes
Review by Single anonymous peer review
Peer reviewer comments 2
Editor who approved publication: Dr Farooq A. Shiekh
Video abstract of “Mesoporous graphene oxide nanocomposite against Non-Small Cell Lung Cancer” [460767].
Views: 4
Peigang Zhang,1,2,* Lingling Zheng,1,3,4,* Xiaorui Zhang,1,3 Miao Liu,1,3 Mingli Li,2 Mengting Zhang,1 Jian-Lin Wu,4 Martin MF Choi,5 Wei Bian1– 3
1Department of Medical Chemistry, School of Basic Medical Science, Shanxi Medical University, Taiyuan, Shanxi, 030000, People’s Republic of China; 2Department of Cardiothoracic Surgery, People’s Hospital of Lvliang, Lvliang, Shanxi, 033099, People’s Republic of China; 3Key Laboratory of Cellular Physiology at Shanxi Medical University, Ministry of Education, Taiyuan, Shanxi, 030000, People’s Republic of China; 4State Key Laboratory for Quality Research of Chinese Medicine, Macau University of Science and Technology, Taipa, Macao, People’s Republic of China; 5Department of Chemistry, The Hong Kong University of Science and Technology, Clear Water Bay, Kowloon, Hong Kong SAR, People’s Republic of China
*These authors contributed equally to this work
Correspondence: Wei Bian, Department of Medical Chemistry, School of Basic Medical Science, Shanxi Medical University, Taiyuan, Shanxi, 030000, People’s Republic of China, Email [email protected]
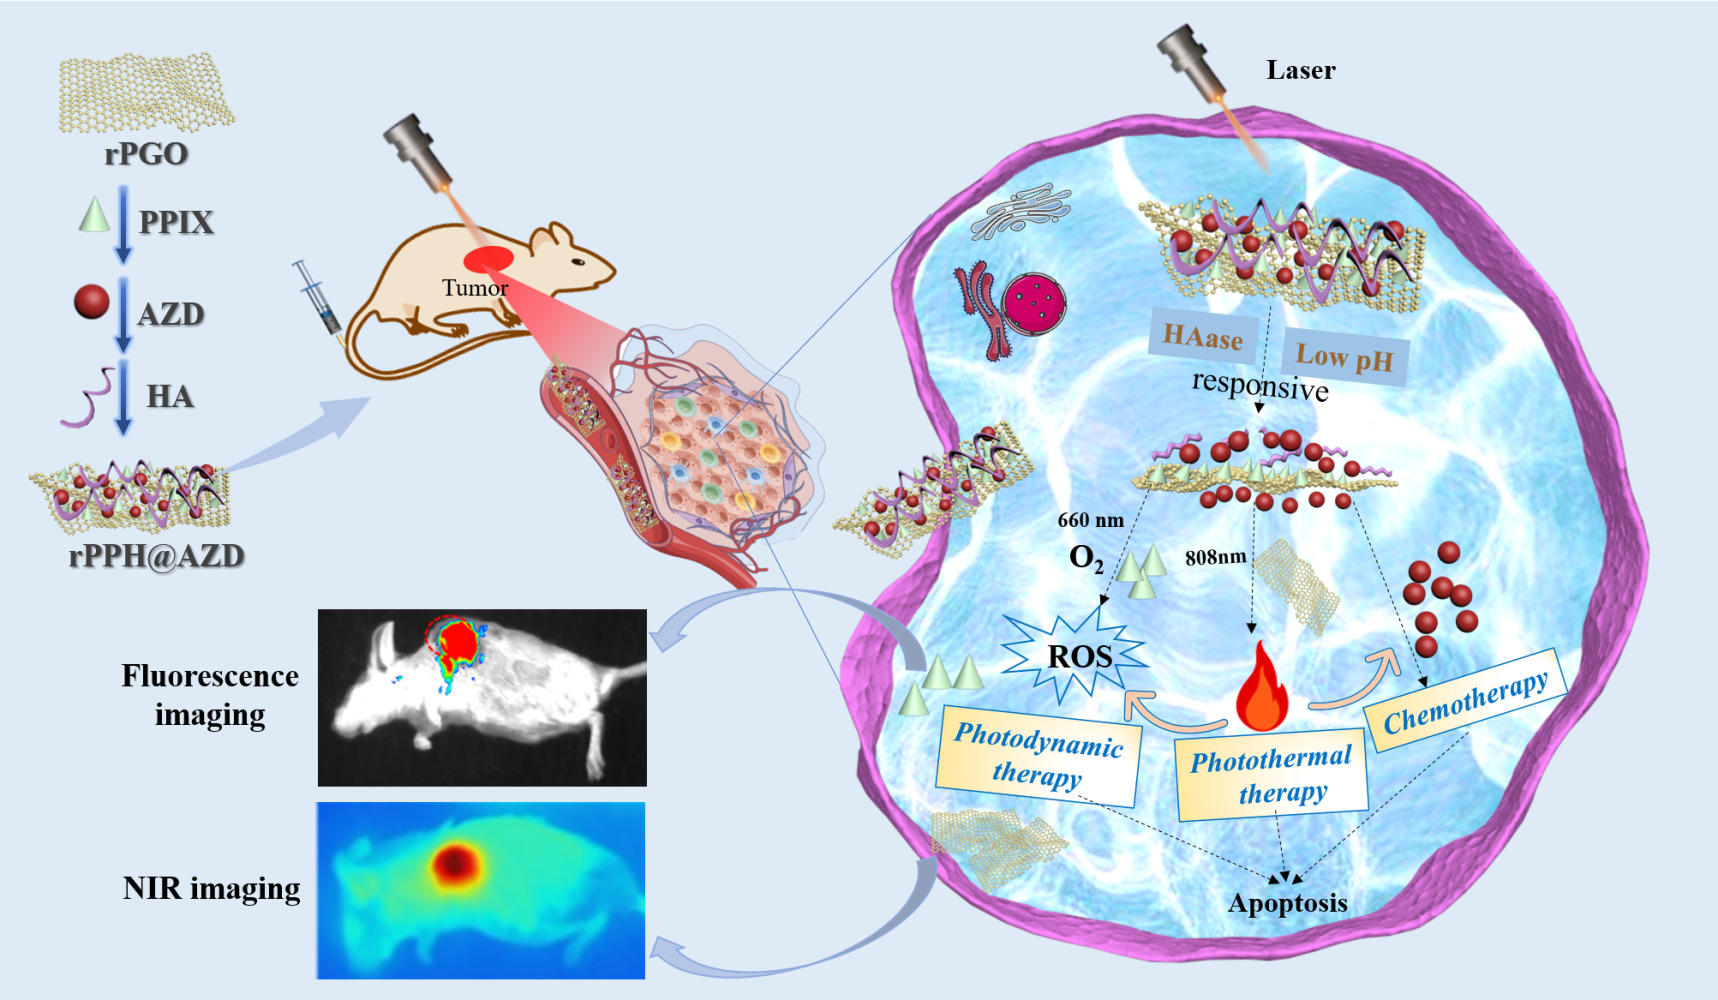
Introduction: Lung cancer is the most common cancer worldwide, among which non-small cell lung cancer (NSCLC) accounts for about 80% of all lung cancers. Chemotherapy, a mainstay modality for NSCLC, has demonstrated restricted effectiveness due to the emergence of chemo-resistance and systemic side effects. Studies have indicated that combining chemotherapy with phototherapy, such as photodynamic therapy (PDT) and photothermal therapy (PTT), can enhance efficacy of therapy. In this work, an aminated mesoporous graphene oxide (rPGO)-protoporphyrin IX (PPIX)-hyaluronic acid (HA)@Osimertinib (AZD) nanodrug delivery system (rPPH@AZD) was successfully developed for combined chemotherapy/phototherapy for NSCLC.
Methods: A pH/hyaluronidase-responsive nanodrug delivery system (rPPH@AZD) was prepared using mesoporous graphene oxide. Its morphology, elemental composition, surface functional groups, optical properties, in vitro drug release ability, photothermal properties, reactive oxygen species production, cellular uptake and cell viability were evaluated. In addition, the in vivo therapeutic effect, biocompatibility, and imaging capabilities of rPPH@AZD were verified by a tumor-bearing mouse model.
Results: Aminated mesoporous graphene oxide (rPGO) plays a role as a drug delivery vehicle owing to its large specific surface area and ease of surface functionalization. rPGO exhibits excellent photothermal conversion properties under laser irradiation, while PPIX acts as a photosensitizer to generate singlet oxygen. AZD acts as a small molecule targeted drug in chemotherapy. In essence, rPPH@AZD shows excellent photothermal and fluorescence imaging effects in tumor-bearing mice. More importantly, in vitro and in vivo results indicate that rPPH@AZD can achieve hyaluronidase/pH dual response as well as combined chemotherapy/PTT/PDT anti-NSCLC treatment.
Conclusion: The newly prepared rPPH@AZD can serve as a promising pH/hyaluronidase-responsive nanodrug delivery system that integrates photothermal/fluorescence imaging and chemo/photo combined therapy for efficient therapy against NSCLC.
Keywords: NSCLC, mesoporous graphene oxide, combination therapy, hyaluronidase/pH dual-response, nanodrug delivery system
Graphical Abstract:
Introduction
According to the latest Global Cancer Epidemiology Report (2024), lung cancer ranks as the most prevalent form of cancer worldwide. The incidence of new lung cancer cases in 2022 reached a staggering 2.5 million, constituting approximately 1/8 (12.4%) of the total number of new cancer cases, with non-small cell lung cancer (NSCLC) accounting for about 85%.1 Osimertinib is a third generation inhibitor approved for the treatment of NSCLC.2 The NSCLC cases are often accompanied by epidermal growth factor receptor (EGFR) activating mutation.3 Osimertinib can inhibit the downstream signaling pathway of EGFR, accelerate cell apoptosis, antagonize angiogenesis, inhibit tumor metastasis, and block tumor growth.4 Therefore, Osimertinib has been approved by the FDA, European Union and CFDA for the treatment of NSCLC.5 However, chemotherapy drugs for NSCLC have limitations such as low water solubility, side effects and poor tolerability.6,7 Research has demonstrated that the utilization of nano-drug delivery systems can enhance the overall therapeutic efficacy of medicinal compounds.8 Mesoporous graphene oxide (PGO) has the characteristics of large specific surface area, ease of synthesis, and surface functionalization, thus possessing significant advantages for drug delivery. In addition, PGO represents an excellent candidate for photothermal therapy due to its remarkable photothermal conversion in the near-infrared (NIR) range, high loading efficiency, and ease of surface functionalization. Compared with individual chemotherapeutic drugs, although nano-drug delivery systems achieve drug accumulation in tumors, premature drug release may still occur during the delivery process.9 Nano-drug delivery systems responsive to enzymes such as hyaluronidase, protease, glycosidase, and pH have been developed due to the tumor microenvironment (TME) of high enzyme concentration and low pH characteristics.10,11 For instance, Duan et al12 prepared hyaluronic acid (HA) and heparin functionalized carbon dots for the targeted release of doxorubicin (DOX) at tumor sites stimulated by hyaluronidase (HAase) and low pH. Wu et al13 synthesized Eu3+ ion and Ga3+ ion doped mesopore silica that can release DOX upon pH and hyaluronidase stimulation.
Because of the intricate and diverse characteristics of tumors, attaining significant therapeutic outcomes through singular chemotherapy proves challenging. As a result, the approach to tumor treatment has progressively transitioned from solitary therapy to a multimodal combination therapy.14,15 Phototherapy, specifically photodynamic therapy (PDT) and photothermal therapy (PTT), has garnered significant attention in the realm of tumor treatment owing to its advantages of non-invasive, locally controllable, and precise treatment.16 Photodynamic therapy utilizes specific light to activate photosensitizers which producing cytotoxic reactive oxygen species (ROS) to induce tumor cell apoptosis.17 Photothermal therapy generates localized heat at the tumor site using photothermal agents like polydopamine, gold nanospheres, and graphene oxide to trigger tumor cell death.18 Recent studies have confirmed that combining chemotherapy with phototherapy results in significant therapeutic effects on tumor growth, recurrence, and metastasis.19–27 Han et al28 used mesoporous silica and reduced graphene oxide as carriers to load chlorine and DOX, which could achieve chemotherapy/PTT/PDT combined cancer treatment with good therapeutic effects. Mao et al29 used bovine serum albumin as a carrier, to load chemotherapy drugs Sorafenib and FeS2 nanoparticles for chemotherapy/PTT/PDT combined tumor therapy. These studies suggest that combination therapies can enhance the therapeutic effectiveness of tumor treatments.
Herein, we develop a mesoporous graphene oxide (rPGO)-based nanocomposite loaded with Osimertinib (AZD), a photosensitizer (protoporphyrin, PPIX), and a targeted agent (hyaluronic acid, HA), denoted as rPPH@AZD, which can induce the specific release of therapeutic agents through hyaluronidase/pH and achieve tumor-specific chemotherapy/PTT/PDT combination therapy against NSCLC.
Materials and Methods
Graphite powder was obtained from Xianfeng Nanomaterials Technology Co., Ltd. (Nanjing, China). Hydrogen peroxide (H2O2), 1-ethyl-3-(3-dimethylaminopropyl)carbodiimide (EDC), N-hydroxysuccinimide (NHS), protoporphyrin IX (PPIX), HAase, and AZD were purchased from Shanghai Macklin Biochemical Co., Ltd. (Shanghai, China). Thiazolyl blue tetrazolium bromide (MTT), penicillin-streptomycin, Calcein acetyl methoxy methyl ester-propidium iodide (AM-PI), Annexin VFITC/PI apoptosis assay kit, and dimethyl sulfoxide (DMSO) were from Solarbio Co., Ltd. (Beijing, China). Concentrated sulfuric acid (H2SO4), concentrated phosphoric acid (H3PO4), concentrated hydrochloric acid (HCl), potassium permanganate (KMnO4), HA, ethylenediamine, ethanol, N,N’-dimethylformamide (DMF), 2-(N-morpholino)ethanesulfonic acid (MES), phosphate buffer saline (PBS), and dichlorodihydrofluorescein diacetate (DCFH-DA) were obtained from Bodi Chemical Co., Ltd. (Tianjin, China). Dulbecco’s modified Eagle medium (DMEM) was bought from HyClone Co., Ltd. (South Logan, UT, USA). Fetal bovine serum (FBS) was purchased from Sijiqing (Zhejiang, China). Human embryonic lung fibroblast (HFL) cells were purchased from the Cell Bank of the Chinese Academy of Sciences (Beijing, China) and human lung cancer A549 cells were obtained from Beijing Solebao Technology Co., Ltd. (Beijing, China). All chemicals of analytical grade were used as received. Ultrapure water was used throughout the experiments.
Preparation of Mesoporous Graphene Oxide Nanocomposite
Preparation of aminated mesoporous graphene oxide (rPGO): Graphite powder (1 g) was dissolved into a three-necked flask containing 140 mL concentrated H2SO4/concentrated H3PO4 (9:1 v/v) and then stirred at 25°C for 12 h. Subsequently, KMnO4 (6 g) was gradually introduced into the solution and stirred for an additional 12 h at 50°C. The solution turned to reddish-brown color. Afterwards, the chilled solution was dispersed into 133 mL of ice water and 30% H2O2 was slowly added. Subsequently, the solution was centrifuged at 4000 rpm for 20 min. The ensuing precipitate was sequentially rinsed with a solution of 30% HCl and then water until it reached a neutral state. The precipitate was freeze-dried to obtain the graphene oxide (GO) solid. Then 6 mL acetic acid and 6 mL 30% H2O2 aqueous solution were added into 50 mL GO aqueous solution (2 mg/mL) and stirred at 100°C for 2 h. The resulting solution was further centrifuged with water to pH ca. 7 to obtain mesoporous graphene oxide (PGO). 0.2 g of PGO and 30 μmol of ethylenediamine were mixed with 30 mL water. The mixture was then reacted at 180°C for 15 h. The precipitate was repeatedly washed multiple times with ethanol and water until the precipitate became neutral to obtain rPGO.
Preparation of protoporphyrin IX linked rPGO: In 5 mL DMF, PPIX (5 mg), EDC (5 mg) and NHS (3 mg) were dissolved and stirred for 1 h under dark. The solution was added to 5 mL rPGO (1 mg/mL) solution and stirred at 50°C for 6 h in the dark. The product, protoporphyrin IX linked rPGO (denoted as rPP) was washed thrice with water to eliminate any residual PPIX.
Preparation of Osimertinib-loaded rPP: Various amounts of AZD were dissolved in DMSO to prepare different concentrations of AZD solutions which were stirred with rPP aqueous solution (10 mg/mL, 5 mL) overnight. To eliminate free AZD and acquire rPP@AZD, the resulting product (denoted as rPP@AZD) underwent triple washing with water.
Preparation of Hyaluronic Acid-loaded rPP@AZD: 50 mg HA was firstly activated with 25 mg NHS and 50 mg EDC in 2 mL MES buffer (pH 5.6) for 15 min, then the activated HA solution was dropped into 20 mL rPP@AZD solution (1 mg/ mL) and stirred at 40°C for 4 h. Finally, the unreacted HA was washed to obtain the HA-loaded rPP@AZD (denoted as rPPH@AZD).
Characterization of Nanomaterials
The morphologies of PGO, rPGO, rPP, and rPPH@AZD were recorded on a field emission transmission electron microscopy (TEM, JEM-2100F, JEOL Ltd., Tokyo, Japan). D8 X-ray powder diffractometer (Bruker, Madison USA) was used to collect x-ray diffraction (XRD) patterns for PGO, rPGO and rPP. AXIS X-ray photoelectron spectroscope (Kratos Analytical Ltd., Manchester, UK) was employed to scan the x-ray photoelectron spectra (XPS) of the nanocomposites. Bruker Fourier transform infrared spectrometer (Billerica, MA, USA) was used to record the Fourier transform infrared (FT-IR) spectra of PGO, rPGO, rPP, and rPPH@AZD. The zeta potentials of PGO, rPGO, rPP, rPP@AZD, and rPPH@AZD were measured on a zeta potential analyzer (Malvern Panalytical Ltd., Malvern, UK). The optical properties of PGO, rPGO, rPP, AZD and rPPH@AZD were analyzed by a Hitachi Ultrospec UH-5300 UV-vis spectrophotometer (Tokyo, Japan) and a Hitachi F-7000 fluorescence spectrophotometer (Tokyo, Japan). The Brunauer-Emmett-Teller (BET) surface areas, pore sizes, and pore volumes of PGO and rPP were measured by a Micromeritics ASAP-2020 nitrogen adsorption instrument (Shanghai, China). Cell images were taken on a FSV1000 confocal laser scanning microscope (Olympus Corporation, Tokyo, Japan). The fluorescence images of mice were presented by the small animal live imaging system (Xtreme, Bruker, Billerica, MA, USA).
Drug Loading Determination of rPP@AZD
1.0 mg/mL AZD solution was prepared by dissolving 10 mg AZD in 10 mL water. This solution was then diluted to prepare various concentrations of AZD standards (1–100 μg/mL). The drug loading experiments were conducted using different AZD/rPP mass ratios (0.75:1, 1:1, 1:1.5, 1:2, 1:2.5, and 1:3). Different concentrations of AZD solution (5 mL) and rPP solution (5 mL, 0.5 mg/mL) were mixed and stirred for 6 h and centrifuged at 12,000 rpm for 20 min. The drug loading capacity was quantified by absorption at 320 nm. The drug loading rate was calculated as: Drug Loading Rate = (mass of total AZD−mass of AZD in the supernatant)/mass of rPP@AZD × 100%.
Release of AZD
To investigate the pH/HA sensitivity of rPPH@AZD release behavior, 5 mL of HAase treated and untreated rPPH@AZD solution were respectively placed into dialysis bags (MWCO 3.5kDa). The dialysate was put into a beaker containing 195 mL PBS (pH=7.4 or 5.5). 2 mL dialysate was taken out to measure its absorption at 317 nm at various times. The AZD-release rate was then determined by the AZD standard curve.
Photothermal Properties of rPPH@AZD
The photothermal properties of rPPH@AZD were evaluated by irradiating a quartz cuvette containing the rPPH@AZD nanocomposite solution. Heating-cooling cycle experiments were employed to assess the photothermal stability of rPPH@AZD. The photothermal conversion efficiency (η) was calculated according to the following equations:


h and S represent the heat transfer coefficient and the surface area of the calorimeter, respectively. Tmax and Tsurr refer to the maximum temperature of the solution and the ambient temperature, respectively. Qdis represents the heat absorbed by the quartz calorimeter itself, I is the laser power, A is the absorbance of the material at the laser wavelength, τs is the heat transfer time constant of the system, m is the mass of the solution, Cwater is the specific heat capacity of water, t is time, and θ is the heat change of the solvent.
In vitro Determination of ROS
1.3-Diphenylisobenzofuran (DPBF) was used to evaluate the production of ROS. Reactive oxygen species could break the pyran ring in the DPBF structure, resulting in a significant decrease in its absorption at 425 nm. To assess the ROS production capacity of rPPH@AZD, the experiments were divided into four groups: DPBF, PBS and DPBF, rPGO and DPBF, and rPPH@AZD and DPBF. Each group had 50 μg/mL of rPGO and rPPH@AZD. The solution of each group was mixed with 5.0 μg/mL DPBF and irradiated by a 660-nm laser (1.8 W/cm2, 10 min). The absorbance of the solution at 425 nm was recorded.
Cell Viability by the MTT Assay
The biocompatibility of rPPH was assessed by the MTT assay. The HFL and A549 cells were cultured in DMEM containing 10% fetal bovine serum and 1% antibiotic solution. All cells were incubated at 37°C with 5% CO2. A549 and HLF cells were cultivated for 24 h with DMEM containing various concentrations of rPPH in 96-well plates. Cells were washed and treated with MTT (5 mg/mL, 100 μL) for 4 h. Finally, 150 μL DMSO was used to replace MTT and the absorbance at 490 nm was measured by a microplate reader. Cell viability was determined using the equation: Cell viability = (Aexperimental − Ablank)/(Auntreated − Ablank) × 100%, where A represents the absorbance.
The cytotoxicity of rPPH (control group), rPPH@AZD (chemotherapy group), rPPH with 808 nm light irradiation (PTT group), rPPH with 660 nm light irradiation (PDT group), and rPPH@AZD with 660 nm and 808 nm lights irradiation (chemotherapy/PTT/PDT group) was evaluated. A549 cells were initially seeded overnight. Then they were incubated with serum-free DMEM containing rPPH and rPPH@AZD, respectively. The concentrations of rPPH and rPPH@AZD were 5–50 μg/mL. The cells in the control and chemotherapy groups were incubated for 24 h. The cells of the PTT, PDT, and combined chemotherapy/PTT/PDT groups were first incubated for 4 h. Cells in the PTT group were irradiated with an 808-nm laser for 10 min per well, while cells in the PDT group received 660 nm laser irradiation for 10 min per well. The combined chemotherapy/PTT/PDT group had 808 and 660 nm lasers irradiation for 10 min, respectively. Subsequently, the cells were incubated for an additional 20 h. After washing the cells, MTT solution (100 μL, 0.5 mg/mL) was added to each well and incubated for 4 h. 150 μL of DMSO was employed as a substitute for the MTT solution. To evaluate the cell viability in each group, the absorbance at 490 nm of the solution in every well was measured by the microplate reader.
Hemolysis Assay of rPPH@AZD
Blood compatibility of rPPH@AZD was assessed by the hemolysis test. Red blood cells (RBCs) were collected from mice and thoroughly washed with saline. For the experimental group, suspensions of varying concentrations of rPPH@AZD (10–100 μg/mL) were dispersed in 1.2 mL saline. These suspensions were then mixed with 0.3 mL of RBCs. The negative and positive control groups were treated with saline and distilled water, respectively. All groups underwent incubation at 37°C for 3 h and were subsequently centrifuged at 1500 rpm for 15 min. The absorbance of the supernatant in each group at 541 nm was measured by a UV-vis spectrophotometer. The hemolysis rate was calculated using the formula: hemolysis rate = (ODexperimental − ODnegative)/(ODpositive – ODnegative) ×100%, where OD is the absorbance.
Cellular Uptake Study
The uptake of rPPH@AZD by A549 cells was evaluated by confocal laser scanning microscopy (CLSM). Adherent A549 cells (1×10⁵ cells/mL) were treated with serum-free DMEM containing rPPH@AZD (50 μg/mL) for 4 h. Subsequently, the cells were rinsed and incubated with 4% paraformaldehyde for 15 min. CLSM images of the cells were acquired.
Staining of Living and Dead Cells
Using A549 cells as a model, the cells were treated with various procedures and divided into groups: (1) PBS, (2) 660 and 808 nm lasers irradiation, (3) rPPH, (4) rPPH@AZD (chemotherapy), (5) rPPH with 808 nm irradiation (PTT), (6) rPPH with 660 nm irradiation (PDT), and (7) rPPH@AZD with 808 and 660 nm irradiation (chemotherapy/PTT/PDT). The therapeutic efficacy of rPPH@AZD on NSCLC was evaluated through living and dead cells staining. The incubation and laser irradiation time were 4 h and 10 min, respectively. Subsequently, the cells were washed and incubated with 250 μL of Calcein AM-PI for 20 min to facilitate cell imaging. Flow cytometry was used to observe apoptotic status and the experimental groups (1)–(7). The Annexin VFITC/PI apoptosis assay kit was used for cell apoptosis analysis.
Detection of Intracellular ROS
DCFH-DA was employed to detect the intracellular ROS. A549 cells were cultured on confocal dishes and incubated with PBS, rPGO, rPPH, and rPPH@AZD for 4 h, respectively. After 660 nm laser irradiation for 10 min, the cells were rinsed and incubated with DCFH-DA (10 μM) for 30 min. Intracellular fluorescence was observed by CLSM.
In vivo Antitumor Effect Analysis
Female Balb/c mice (20–25 g) were from Bev Technology Co., Ltd. (Beijing, China). The mice experiments received approval from the Animal Ethics Committee of Shanxi Medical University. All animal experiments complied with the National Laboratory Animal Management Regulations and the Experimental Animal Management Ordinance of Shanxi Province. A549 cells (1×10⁷) were subcutaneously injected under the skin of the mice’s right armpit. When the tumor volume reached about 100 mm3, the tumor-bearing mice were randomly divided into 7 groups (n = 5) and injected various formulations via tail vein: (1) saline, (2) NIR irradiation, (3) rPPH, (4) rPPH@AZD (chemotherapy), (5) rPPH with 808-nm laser irradiation (PTT), (6) rPPH with 660-nm laser irradiation (PDT), and (7) rPPH@AZD with 808 and 660-nm laser irradiation (chemotherapy/PTT/PDT). Mice received the injection reagent every 3 days. The tumor volume and mouse weight were recorded every other day until the mice were euthanized 14 days later. Nine hours after injection, the tumor sites were irradiated with the 808-nm laser (0.6 W/cm2). Thermal images of the mice were captured by an IR thermal imaging camera every 2 min.
In vivo Fluorescence Imaging
Mice were administered intravenous injections of rPPH@AZD (5.0 mg/kg). The fluorescence images of the mice were captured at 0–24 h through the small animal in vivo imaging system. After 24 h, the tissues including tumor, kidney, spleen, liver, lung, and heart were subjected to fluorescence imaging analysis at excitation/emission of 530/600 nm. In vivo biosafety evaluation of the mice’s tumor and major organs was conducted. After 14 days of treatment, the tumor, and major organs such as kidney, spleen, liver, lung, and heart were collected and placed in 4% formalin for subsequent tissue sections and hematoxylin and eosin (H&E) staining. Blood routine and biochemical indices were analyzed after eyeball blood collection.
Statistical Analysis
Student’s t-test was applied to evaluate statistical significance (*p < 0.05, **p < 0.01, and ***p < 0.001). The experimental data were expressed as the mean ± standard deviation.
Results and Discussion
Nanocarriers possessing mesoporous architectures exhibit a notable specific surface area and large pore volume, thereby showcasing immense potential as nano-drug delivery systems.30 Heretofore, different kinds of mesoporous materials have been applied as excellent drug-loading nanocarriers, which were usually loaded with drug molecules through non-covalent electrostatic, π–π stacking and hydrogen bonding.31,32 Owing to its large specific surface area and ease of surface functionalization, aminated mesoporous graphene oxide (rPGO) has significant potential as a drug delivery carrier. As such, a nanodrug delivery system based on mesoporous graphene oxide-protoporphyrin IX-hyaluronic acid@Osimertinib (rPPH@AZD) has been developed. The micromorphology of the as-prepared nanomaterials was characterized by TEM as displayed in Figure 1. The surface of PGO in (Figure 1a) exhibits abundant mesoporous structures. The loading of ethylenediamine in (Figure 1b) and PPIX in (Figure 1c) do not change the mesoporous structure of PGO,33 while the surface of rPPH in (Figure 1d) becomes blurred when HA is grafted onto the rPP surface. (Figure 1e) depicts the XRD patterns of PGO, rPGO, rPP, and rPPH. PGO shows a characteristic diffraction peak at 27.4° (2θ), representing the crystal plane of graphitized carbon (002) and corresponding to the interlayer distance of 0.356 nm.34 Compared with PGO, the diffraction peak of rPGO is shifted to 25° after reduction with ethylenediamine. After rPGO modifying with PPIX and HA, the diffraction peak of rPPH does not change much, demonstrating that the crystal structure of rPGO does not affect by PPIX and HA.
 |
Figure 1 TEM of (a) PGO, (b) rPGO, (c) rPP, and (d) rPPH. (e) XRD patterns of PGO, rPGO, rPP, and rPPH. (f) Overall XPS survey spectra of PGO, rPGO, rPP, and rPPH@AZD. (g) Zeta potentials of PGO, rPGO, rPP, rPP@AZD, and rPPH@AZD. (h) Nitrogen adsorption-desorption isotherms of PGO and rPP. (i) UV-vis absorption spectra of rPGO, PPIX, rPP, AZD, and rPPH@AZD. (j) Fluorescence emission spectra of PGO, rPGO, PPIX, rPP, and rPPH@AZD at an excitation of 420 nm. |
Figure 1f displays the XPS survey spectra of PGO, rPGO, rPP, and rPPH@AZD, indicating the presence of C, N, and O elements. Figure S1 depicts the XPS fine C1s, N1s, and O1s spectra of rPPH@AZD. The C1s spectrum of rPPH@AZD in (Figure S1a) has three peaks at 284.6, 286.1, and 287.9 eV, corresponding to the binding energies of C=C/C–C, C–O, and O–C–C, respectively. (Fig. 1Sb) shows the N1s spectrum of rPPH@AZD with the peaks at 397.7, 399.8, and 400.8 eV corresponding to the binding energies of pyridine nitrogen, N–H, and N–H–C–O, respectively. The peaks of the O1s spectrum at 531.3 and 532.4 eV in (Figure S1c) are attributing to the binding energies of C=O and C–O, respectively.35,36 (Figure 1e) displays the negative zeta potentials of PGO, rPGO, rPP, rPP@AZD, and rPP@AZD, indicating that they are negatively charged. The zeta potentials of rPGO and rPP are −19.3 and −16.3 mV, respectively. PGO has the highest zeta potential of −34.3 mV because of the presence of abundant carboxyl groups on its surface. The zeta potential of rPP@AZD drops to −9.58 mV after loading the positively charged AZD, indicating the possible electrostatic interaction between rPP and AZD. However, when rPP@AZD is modified with HA, the zeta potential of rPPH@AZD increases to −30.2mV, attributing to large number of carboxyl groups on HA.37,38
The hysteresis adsorption-desorption isotherms of PGO and rPP in (Figure 1h) belong to type IV according to the IUPAC classification,39 inferring that PGO and rPP have mesoporous structure. The BET specific surface area, pore volume, and average pore size of PGO and rPP are given in Table 1. The specific surface area, pore size and pore volume of rPP are smaller than that of PGO because of the loading of PPIX onto PGO. The pore volume of rPP drops significantly owing to the possible occupancy or coverage of PPIX onto PGO, inferring the successful immobilization of PPIX onto PGO.
 |
Table 1 BET Specific Surface Area, Pore Volume and Average Pore Diameter of PGO and rPP |
(Figure 1i) depicts the UV-vis absorption spectra of rPGO, PPIX, rPP, AZD, and rPPH@AZD. rPGO exhibits broad absorption at 300–800 nm. AZD possesses an absorption peak at 317 nm. PPIX has a Soret band at 405 nm and other small absorption peaks at 510, 540, 580, and 630 nm. rPP possesses the characteristics absorption bands of PPIX as it has been immobilized with PPIX. rPPH@AZD shows the two main absorption peaks of 317 and 405 nm of AZD and PPIX, respectively since it has been loaded with both PPIX and AZD. (Figure 1j) depicts the fluorescence emission spectra of PGO, rPGO, PPIX, rPP, and rPPH@AZD at excitation of 420 nm. PGO and rPGO do not show any fluorescence since they do not have absorption at 420 nm. By contrast, PPIX has a large and a small emission peak at 636 and 703 nm, respectively. Both rPP and rPPH@AZD display the characteristic emission peaks of PPIX as they have been loaded with PPIX. The large emission peak of rPP is slightly blue shifted to 630 nm while its small emission peak remains at 701 nm. After rPPH loading the drug AZD, the emission peaks of rPPH@AZD are more red-shifted to 655 and 717 nm, possibly attributing to the π–π interaction between AZD and rPPH.40,41
The surface functionalities of PGO, rPGO, rPP, and rPPH are characterized by IR spectroscopy as shown in (Figure S1d). The stretching vibration of –OH in PGO is identified at 3439 cm–1. In addition, the stretching vibrations of C=O, C=C, C–OH, and C–O–C are observed at 1734, 1624, 1393, and 1096 cm–1, respectively. These peaks serve as evidence that PGO contains carboxyl, hydroxyl, and epoxide oxygen-functionalities. The diversity of functional groups such as hydroxyl, epoxy, and carboxyl groups on the PGO surface provides unique opportunities to anchor a variety of chemicals. rPGO has two new peaks at 2935 and 1567 cm–1, assigning to the asymmetric stretching vibration of C–H and the bending vibration of N–H, respectively. But the peaks of C=O at 1734 cm−1 and C–O–C at 1096 cm−1 disappear, revealing that the surface of PGO has been reduced and successfully modified with amino groups.42 Upon PPIX modification of rPGO, a new peak of rPP at 1685 cm–1 appears and is corresponding to the stretching vibration of C=O in the amide bond, demonstrating that PPIX has been grafted to the surface of rPGO. When the rPP surface is loaded with HA, the absorption of the amide bond at 1658 cm–1 increases, demonstrating that HA has been successfully immobilized onto the rPPH surface through an amidation reaction.43
A key parameter for evaluating the drug-loading performance of nanomaterials is the drug loading capacity, which is the mass ratio of drug to drug-loaded nanoparticles. The highest drug loading was obtained by optimizing the ratio between drug and carrier. (Figure S1e) displays the % loading of AZD on rPP against the mass ratio of AZP to rPP. The AZD loading increases with increasing AZD/rPP mass ratio in the range 1–3 and then decreases in the range 3–3.5. The AZD loading achieves the maximum 81.1% when AZD/rPP is 3. As such, the mass AZD/rPP ratio of 3 is chosen as the optimal loading of AZD onto rPP. The payload of AZD may be attributed to the presence of rPP mesoporous pores, further illustrating that mesoporous graphene oxide has good drug loading and release properties which can load and deliver anticancer drugs effectively.
Currently, nano-drug delivery systems can respond to exogenous or endogenous stimuli such as pH, enzyme, light, and temperature, to achieve targeted drug release in tumor tissues and minimize negative effects on normal tissues.44,45 (Figure 2a) displays the AZD release from rPPH@AZD in PBS at pH 5.5 and 7.4 in the presence and absence of HAase. rPPH@AZD in the absence of HAase at pH 5.5 and 7.4 shows about 8% AZD release in the first 10 min and then stops the further release of AZD. However, in the presence of HAase, rPPH@AZD has more significant release of AZD with 55.5% at pH 5.5 and 20% at pH 7.4, indicating that the drug release of rPPH@AZD can be stimulated by HAase. The lower the pH, the higher the release of AZD from rPPH@AZD. Thus, the lower pH of the tumor tissue environment could serve as a stimulus to control drug release. In the physiological environment of tumors, the pH is lower than that of normal tissues. The π−π stacking effect between AZD and rPPH is weakened in the acidic environment of tumor tissue, resulting in increased AZD diffusion movement. Since the TME is characterized by high enzyme concentration and low pH, rPPH@AZD as a hyaluronidase/pH-responsive nanodrug delivery systems can enhance drug penetration and accumulation at the tumor site.
 |
Figure 2 (a) AZD release in PBS at pH 5.5 and 7.4 with or without HAase. (b) ROS generation ability of rPGO and rPPH@AZD: Absorbances at 425 nm of DPBF, PBS and DPBF, rPGO and DPBF, and rPPH@AZD and DPBF under 660 nm light irradiating at various times. (c) Temperatures of PBS, PGO, rPGO, and rPPH@AZD after irradiating by an 808-nm laser at various times. (d) Photothermal stability of rPPH@AZD solution for five consecutive cycles of heating and cooling. (e) Photothermal images of PBS, PGO, rPGO, and rPPH@AZD after irradiating by an 808-nm laser for 0–10 min. |
The ROS generation ability of rPGO and rPPH@AZD under 660 nm light irradiation was assessed by the change in absorbance of DPBF at 425 nm. (Figure 2b) shows the absorbances of DPBF, PBS and DPBF, rPGO and DPBF, and rPPH@AZD and DPBF. After 13 min of 660 nm laser irradiation, the change in absorbance at 425 nm is negligible for DPBF, and DPBF in PBS. By contrast, the absorbance at 425 nm for rPGO and DPBF decreases with time under 660 nm irradiation, demonstrating that rPGO could generate ROS. For rPPH@AZD and DPBF, the decrease in absorbance at 425 nm is more significant, inferring that rPPH@AZD possesses a stronger ROS generation capability under 660 nm light irradiation. In essence, rPPH@AZD multifunctional nanocarriers have excellent ROS generation ability, which is crucial for joint and synergistic treatment.
Since PGO has strong NIR absorption ability and excellent photothermal properties, it can be used as a photothermal agent to convert light energy and generate localized thermal energy to kill tumor cells. (Figure 2c) displays the temperature changes of PBS, PGO, rPGO, and rPPH@AZD solutions under 808 nm laser irradiation (1.5 W/cm2). PBS shows little temperature change after 10 min. But the temperatures of PGO, rPGO, and rPPH@AZD increase from 26 to 40.5, 47.3, and 49.0°C, respectively, demonstrating that rPGO and rPPH@AZD have good photothermal property. This is attributed to the fact that rPGO and rPPH@AZD possess graphene structure with its aromatic networks capable of absorbing NIR light. Photothermal stability is important for nanoparticles possessing photothermal therapeutic ability because continuous multiple laser irradiation is unavoidable during the experimental process. However, some photothermal materials will be gradually inactivated after multiple laser irradiations resulting in a gradual decrease of photothermal conversion efficiency and loss of photothermal therapeutic effect. Thus, the photothermal stability of rPPH@AZD was assessed by five cycles of heating and cooling as shown in (Figure 2d). The thermal stability of rPPH@AZD under 808 nm light irradiation is good even after five consecutive cycles of heating and cooling. The calculated photothermal conversion efficiency of rPPH@AZD is 47.6%, indicating that rPPH@AZD has good photothermal stability and conversion efficiency. These results demonstrate that rPPH@AZD nanocomposite has good photothermal stability and can be used as a thermosensitive agent for photothermal therapy.
The therapeutic effect of rPPH@AZD on A549 cells was evaluated by the MTT assay. (Figure 3a) depicts the viability of A549 cells incubated with 0–50 μg/mL rPPH, rPPH@AZD, rPPH under 808 nm (PTT group), rPPH under 660 nm (PDT group), and rPPH@AZD under 660 and 808 nm (chemotherapy/PPT/PDT group) for 24 h. In general, increasing the concentration of these nanomaterials will cause cell viability to decrease. The survival rates of cells treated with 50 μg/mL rPPH for the PTT and PDT group are 59.3 and 55.9%, respectively. The cell viability of A549 cells incubated with 50 μg/mL rPPH@AZD in the chemotherapy/PTT/PDT group is only 19%, revealing that the combination of chemotherapy, PTT and PDT could achieve excellent therapeutic effect on cancer cells.
 |
Figure 3 (a) Cell viability of A549 cells incubated with 0–50 μg/mL rPPH, rPPH@AZD, rPPH with 808 nm irradiation, rPPH with 660 nm irradiation, and rPPH@AZD with 660 and 808 nm irradiation for 24 h. The data are expressed as means ± SD (n = 3). *p < 0.05, **p < 0.01, and ***p < 0.001. (b) The hemolysis % of rPPH@AZD. The inset displays the images of hemolysis assay at various concentrations of rPPH@AZD. (c) CLSM images of A549 cells subjected to PBS and rPPH@AZD. (d) Calcein AM-PI stained CLSM images of A549 cells subjected to PBS, 660 and 808 nm irradiation, rPPH, rPPH@AZD, rPPH with 808 nm irradiation, rPPH with 660 nm irradiation, and rPPH@AZD with 660 and 808 nm irradiation. (e) DCF fluorescence images of A549 cells treated with PBS, rPGO, rPPH, and rPPH@AZD in DCFH-DA after 660 nm laser irradiation. |
The blood compatibility of rPPH@AZD was assessed by in vitro hemolysis assay as depicted in (Figure 3b). The inset of (Figure 3b) shows the pictures of hemolysis assay at various concentrations of rPPH@AZD. The highest hemolysis % of rPPH@AZD ranging 10–100 μg/mL is smaller than 0.92%, which is much lower than the hemolysis rate (5%) stipulated by the International Organization for Standardization. This suggests that rPPH@AZD does not cause hemolysis and possesses excellent blood compatibility. Figure S2 shows the cell viability of A549 and HLF cells after incubating with various concentrations of rPPH for 24 h. The activities of A549 and HLF cells maintain above 80% even after treating with 0–50 μg/mL rPPH for 24 h, manifesting that rPPH has good biocompatibility.
A549 cells were used as cell models for expressing CD44 receptors. (Figure 3c) depicts the CLSM images of the uptake of rPPH@AZD by A549 cells. No fluorescence is observed for A549 cells in PBS. However, intense red fluorescence is observed for A549 cells incubated with rPPH@AZD, demonstrating that rPPH@AZD has specific targeting capability to A549 cells.
The intracellular antitumor properties of the nanomaterials were evaluated by living and dead cell staining. (Figure 3d) depicts the CLMS images of A549 cells subjected to PBS, 660 and 808 nm lasers irradiation, rPPH, rPPH@AZD (chemotherapy), rPPH with 808 nm irradiation (PTT), rPPH with 660 nm irradiation (PDT), and rPPH@AZD with 660 and 808 (chemotherapy/PTT/PDT). Cells with PBS, NIR irradiation and rPPH show almost no cell death, proving that tumor cells are hardly damaged when only illuminated without nanomedicine. Cells with PPH@AZD, rPPH with 808 nm, and rPPH with 660 nm show partial cell death, while almost all cells are died under rPPH@AZD with 660 and 808 nm irradiation. All these results suggest that the combined chemotherapy, PTT and PDT is a more effective way to induce apoptosis in A549 cells.
The ability of nanomaterials to generate ROS was determined by the DCFH-DA probe as shown in (Figure 3e). The DCFH-FA probe reacts with ROS, resulting in the production of 2’,7’-dichlorofluorescein with green fluorescence. Cells subjected to PBS display no fluorescence. Cells treated with rPGO exhibit faint green emission, inferring that rPGO with 660 nm irradiation can generate only a small quantity of ROS. By contrast, cells treated with rPPH and rPPH@AZD and 660 nm irradiation exhibit strong green emissions, implying that both rPPH and rPPH@AZD possess ROS generation capability under laser irradiation. These ROS have strong oxidizing properties and can damage the cell membrane, mitochondria, and other structures of tumor cells, leading to cell death. At the same time, ROS can also destroy the signaling pathways of tumor cells and inhibit the proliferation of tumor cells.
Flow cytometry was applied to evaluate nanomaterial-induced apoptosis. (Figure 4a) displays the apoptosis images of A549 cells subjected to PBS, 660 and 808 nm (NIR), rPPH, rPPH@AZD (chemotherapy), rPPH with 808 nm (PTT), rPPH with 660 nm (PDT), and rPPH with 660 and 808 nm (chemotherapy/PPT/PDT). The top right panel in (Figure 4a) shows the apoptosis rates under PBS, NIR, rPPH, chemotherapy, PTT, PDT, and chemotherapy/PPT/PDT treatments. The apoptosis rates under chemotherapy, PTT group, and PDT treatments reach 28.7, 33.4, and 52%, respectively. Under the combined chemotherapy, PTT and PDT treatment, the apoptosis rate is as high as 72.1%, indicating that rPPH@AZD could induce apoptosis of A549 cells through the combined chemotherapy/PTT/PDT therapy with 660 and 808 nm lasers irradiation. (Figure 4b) shows the temperature images of mice with tumors which are real-time captured by an in vivo IR thermal camera. Mice were injected with PBS, rPPH, and rPPH@AZD via the tail veins, following exposure to an 808 nm laser for 10 min after 9 h. The color intensity from blue to red indicates the temperature from 20°C to 50°C. Mouse with PBS injection has only a slight increase in temperature. For the mice injected with rPPH and rPPH@AZD, their tumor center can reach 50°C, confirming that both rPPH and rPPH@AZD could generate enough heat under laser irradiation to achieve better PTT efficacy. In other words, long term exposure of rPPH@AZD to NIR would not deteriorate its photothermal stability. The thermogenesis of photothermic agents can elevate the local temperature of tumor tissues, leading to enhanced blood flow and mitigation of tumor hypoxia to some extent. This in turn reduces drug resistance caused by anoxic environments and further enhances the synergistic therapeutic effect of composite nanosystems.
 |
Figure 4 (a) Apoptosis images of A549 cells subjected to PBS, 660 and 808 nm, rPPH, rPPH@AZD, rPPH with 808 nm, rPPH with 660 nm, and rPPH with 660 and 808 nm. The top right panel displays the apoptosis % at various conditions. The data are expressed as means ± SD (n = 3). *p < 0.05, **p < 0.01, and ***p < 0.001. (b) Photothermal images of mice treated with PBS injection and 808 nm, rPPH and 808 nm, and rPPH@AZD and 808 nm. (c) In vivo fluorescence images of mouse after various times (0–24 h) of injection. (d) In vitro fluorescence images of tissues: tumor, kidney, spleen, liver, lung, and heart after 24 h. |
(Figure 4c) shows the fluorescence images of the mouse at 0–24 h after injected with rPPH@AZD via the tail vein. The fluorescence of rPPH@AZD in the tumor grows gradually from 0 to 9 h and subsequently decreases after 9 h. The fluorescence of the tumor site is strongest at 9 h post-injection, inferring that the concentration of rPPH@AZD at the tumor site reaches the highest level. These results demonstrate that rPPH@AZD could be accurately enriched into A549 tumor tissues with high CD44 receptor expression through blood circulation. (Figure 4d) displays the fluorescence images of the mice’s tumor and major organs after 24 h injection of rPPH@AZD. Fluorescence emissions from the tumor and liver are observed, showing that some rPPH@AZD still remain in the tumor after 24 h and are metabolized by the liver. The rapid accumulation of rPPH@AZD in the tumor site is attributed to the active targeting effect of HA, which improves the utilization rate of rPPH@AZD and enhances the tumor treatment effect. This demonstrates that rPPH@AZD makes the in vivo distribution, metabolism and targeting of multifunctional nano-delivery systems more convenient and visual through in vivo optical imaging.
The combined therapeutic effects of rPPH@AZD for NSCLC were assessed through in vivo anti-tumor experiments on mice. Figure 5 shows (a) the relative change in tumor volume and (b) body weight of mice during 14 days of treatments: Mice were treated with saline, 660 and 808 nm (NIR), rPPH, rPPH@AZD (chemotherapy), rPPH with 808 nm (PTT), rPPH with 660 nm (PDT), and rPPH@AZD with 660 and 808 nm (chemotherapy/PTT/PDT). The body weight of the mice does not change much for all the treatments (Figure 5b), suggesting that the nanomaterials in the treatment group had no side effects on mice. There are continual growths of tumors for those mice subjected to saline, NIR and rPPH treatments, indicating that these treatments have no inhibition effect on the tumors. The tumor growth rates are slightly lower for mice subjected to chemotherapy, PTT and PDT treatments. However, mice with the combined chemotherapy/PTT/PDT treatment can efficiently inhibit the growth of tumor. More importantly, the tumor diminishes in size and eventually vanishes after 10 days of treatment. The combination therapy can induce simultaneous heat stress and oxidative stress in cancer cells, leading to the disruption of their heat resistance mechanism and activation of the apoptosis pathway. As a result, the combined therapy exerts a synergistic effect while allowing for lower treatment temperatures and improved safety. (Figure 5c and d) display the pictures of tumors and mice under various treatments. (Figure 5e) depicts the H & E staining of tumor tissue sections of mice subjected to various treatments. No abnormality is found in the tumor tissue sections for saline, NIR and rPPH treatments. Tumor cells showed normal morphology with clearly visible cell membranes and nuclei. There is a small amount of cell necrosis for mice with PTT and PDT treatments. Noticeably, the tissue sections in the combined chemotherapy/PTT/PDT group displayed the largest ablation area. And the tumor cells showed obvious destruction with nuclear condensation leading to cell apoptosis and necrosis. Our results prove that the therapeutic effect of chemotherapy/PTT/PDT is significantly better than that of other single treatment modalities. rPPH@AZD could achieve good combined therapeutic effect without any significant ex vivo and in vivo toxicity in mice. The safety and high efficacy of this nanomaterial provide ideas for designing new therapeutic strategies for tumor.
 |
Figure 5 The mice are treated with saline, 660 and 808 nm (NIR), rPPH, rPPH@AZD, rPPH with 808 nm, rPPH with 660 nm, and rPPH@AZD with 808 and 660 nm irradiation for 14 days: (a) Relative change of tumor volume. The data are expressed as means ± SD (n = 3). ***p < 0.001. (b) Mice body weight. (c) Pictures of tumors. (d) Pictures of mice. (e) H&E staining of tumor tissues with various treatments. |
Owing to the obvious therapeutic effect of rPPH@AZD, it is necessary to evaluate its biosafety. The body weights of mice with various treatments are relatively stable within 14 days as shown in (Figure 5b), confirming that the as-prepared nanomaterial has no acute toxicity. H&E staining of major organs reveals no histomorphological damage as depicted in Figure S3. The morphology and structure of all tissues in mice are normal and clear, in which the transverse striations of the heart are clearly visible. For liver, the lobules and other characteristic structures are obvious, and no oedema is seen. For spleen, the corpuscle is clearly structured, and the central artery is visible. For lung, clear alveoli, and no thickening of the walls of the alveoli can be seen. For kidney, a clear distribution of the glomerulus and the peripheral tubule is observed. All these suggest that rPPH@AZD does not cause pathological changes in various organs and tissues. The biosafety of rPPH@AZD was evaluated by assessing the liver and kidney function indexes in Figure S4 and blood indices of mice in Figure S5. In liver function tests, AST and ALT are the standards for judging whether liver cells are damaged. BUN and CRE are the body’s nitrogen catabolism products. Their specific concentrations are closely related to the excretion capacity of the kidneys and can reflect the degree of damage to kidney function. All these indices indicate that rPPH@AZD is safe for the mice. Hematological parameters, liver function indicators and renal function indicators are within the normal range, implying that rPPH@AZD induces negligible in vivo toxicity and has good biosafety.
Conclusion
In this work, a nanodrug delivery system (rPPH@AZD) based on mesoporous graphene oxide nanocomposite was developed. The obtained rPPH@AZD can maximize its accumulation at tumor site by active tumor-targeting effect endowed by HA. After tumoral accumulation, rPPH@AZD generates ROS and heat after laser irradiation at the tumor site and combines with the targeted anti-tumor drug Osimertinib for chemo/photo therapy. rPPH @AZD possesses pH/hyaluronidase dual responsive drug release behavior, which will facilitate the controlled release of AZD in the weakly acidic TME; thus, this study overcomes the shortcomings of single therapy and provides a reference for further exploration of chemo/photo combination therapy. More importantly, rPPH @AZD has excellent photothermal imaging and fluorescence imaging capabilities. Armed with its excellent imaging performance and effective therapy, rPPH@AZD is anticipated to have a unique tumor detection and treatment system. Both in vitro and in vivo studies have also demonstrated the excellent biocompatibility of rPPH@AZD. As a nanoplatform for combination therapy, rPPH@AZD is worthy of further research. In summary, this study provides new ideas for the construction of TME-responsive nanodrug delivery systems and provides a theoretical basis for clinical combination treatment of NSCLC.
Data Sharing Statement
Data will be made available on request.
Ethical Approval
This study was conducted in the ARRIVE guidelines and in accordance with the requirements of the Medical Ethics Committee of Shanxi Medical University (ID: 2019SLL188).
Acknowledgments
This work was supported by the Natural Science Foundation of Shanxi Province of China (202203021221186, 202103021224239 and 201901D111210) and Special Project of Lvliang for Introducing High-Level Science and Technology Talents (2021RC-2-33).
Disclosure
All authors have no conflicts of interest to disclose for this work.
References
1. Bray F, Laversanne M, Sung H, et al. Global cancer statistics 2022: GLOBOCAN estimates of incidence and mortality worldwide for 36 cancers in 185 countries. Ca a Cancer J Clinicians. 2024;74(3):229–263. doi:10.3322/caac.21834
2. Ard van V, Veerman MGD, Marjon VV, et al. 1130P Real-world data of osimertinib (osi) for the treatment of metastatic epidermal growth factor receptor (EGFR+) non-small cell lung cancer (NSCLC) patients (pts), with a focus on age, body mass index (BMI) and trough levels. Ann Oncol. 2022. doi:10.1016/j.annonc.2022.07.1254
3. Lavinia T, Chris B, Antony M, et al. A Phase II trial of alternating osimertinib and gefitinib therapy in advanced EGFR-T790M positive non-small cell lung cancer: OSCILLATE. Nat Commun. 2024. doi:10.1038/s41467-024-46008-1
4. Yufeng L, Tianyu M, Jing W, et al. Toward the next generation EGFR inhibitors: an overview of osimertinib resistance mediated by EGFR mutations in non-small cell lung cancer. Cell Commun Signaling. 2023. doi:10.1186/s12964-023-01082-8
5. Icaro Alves P, Rodrigo de Oliveira C, Aline Larissa Virginio da S, et al. EGFR Mutations and PD-L1 expression in early-stage non-small cell lung cancer: a real-world data from a single center in Brazil. Oncologist. 2022. doi:10.1093/oncolo/oyac167
6. Ken AO, Sophie PV. Predictors of chemotherapy efficacy in non-small-cell lung cancer: a challenging landscape. Ann Oncol. 2016. doi:10.1093/annonc/mdw321
7. Leena G, Delvys R-A, Shirish MG, et al. Pembrolizumab plus chemotherapy in metastatic non–small-cell lung cancer. New Engl J Med. 2018. doi:10.1056/nejmoa1801005
8. Ping S, Xinyi Z, Ni D, et al. Glutathione and esterase dual-responsive smart nano-drug delivery system capable of breaking the redox balance for enhanced tumor therapy. ACS Appl Mater Interfaces. 2023. doi:10.1021/acsami.3c01155
9. Fangyuan G, Yunlong J, Yinzhou D, et al. Enzyme-responsive nano-drug delivery system for combined antitumor therapy. Int J Biol Macromol. 2022. doi:10.1016/j.ijbiomac.2022.08.123
10. Kaijun G, Xin W, Jinying L, et al. A pH-responsive chiral mesoporous silica nanoparticles for delivery of doxorubicin in tumor-targeted therapy. Colloids Surf B. 2023. doi:10.1016/j.colsurfb.2022.113027
11. Mohammad S, Mohammad Kiani S, Mohsen C, et al. Stimuli-sensitive nano-drug delivery with programmable size changes to enhance accumulation of therapeutic agents in tumors. Drug Delivery. 2023. doi:10.1080/10717544.2023.2186312
12. Qianqian D, Lan M, Boye Z, et al. Construction and application of targeted drug delivery system based on hyaluronic acid and heparin functionalised carbon dots. Colloids Surf B. 2020. doi:10.1016/j.colsurfb.2019.110768
13. Zhiyuan W, Cheng-Chang L, Hsiu‐Mei L. Hyaluronidase-responsive mesoporous silica nanoparticles with dual-imaging and dual-target function. Cancers. 2019. doi:10.3390/cancers11050697
14. Fan C, Qunfa H, Yanhong L, et al. Combined chemo and photo therapy of programmable prodrug carriers to overcome delivery barriers against nasopharyngeal carcinoma. Biomat Advan. 2023. doi:10.1016/j.bioadv.2023.213451
15. Jinzha Z, Ke Z, Yijie H, et al. Polydopamine nanomotors loaded indocyanine green and ferric ion for photothermal and photodynamic synergistic therapy of tumor. J Colloid Interface Sci. 2023. doi:10.1016/j.jcis.2022.11.099
16. Lizhen Z, Aijia Y, Changping R, et al. Copper-nitrogen-coordinated carbon dots: transformable phototheranostics from precise PTT/PDT to post-treatment imaging-guided PDT for residual tumor cells. ACS Appl Mater Interfaces. 2023. doi:10.1021/acsami.2c17525
17. Shuang Z, Chen C, Liuwei Z, et al. Activation of pyroptosis by specific organelle-targeting photodynamic therapy to amplify immunogenic cell death for anti-tumor immunotherapy. Bioact Mater. 2023. doi:10.1016/j.bioactmat.2022.07.016
18. Hui C, Ye H, Junya L, et al. Degradable iron-rich mesoporous dopamine as a dual-glutathione depletion nanoplatform for photothermal-enhanced ferroptosis and chemodynamic therapy. J Colloid Interface Sci. 2023. doi:10.1016/j.jcis.2023.02.041
19. Bin C, Linrui C, Rangrang F, et al. Multifunctional Ce6-loaded MnO2 as an oxygen-elevated nanoplatform for synergistic photodynamic/photothermal therapy. Mater Des. 2023. doi:10.1016/j.matdes.2023.111702
20. Chunyan M, Xudong X, Qian J, et al. TME-targeting nano-theranostic agent for NIR fluorescence diagnosis and O2-economized PDT-based multimodal synergistic therapy. Mater Des. 2023. doi:10.1016/j.matdes.2023.112251
21. Kang K, Wang L, Yu K, Ma Y, Qu F, Lin H. Z-scheme MoS(2)/Co(3)S(4)@PEG nanoflowers: intracellular NIR-II photocatalytic O(2) production facilitating hypoxic tumor therapy. Biomater Adv. 2023;144:213168. doi:10.1016/j.bioadv.2022.213168
22. Shaowen J, Fukai Z, Lin Y, et al. Photothermal-augmented reactive oxygen species oxidative synergistic therapy based on nanoceria doped mesoporous polydopamine nanoplatform. Mater Des. 2023. doi:10.1016/j.matdes.2023.111590
23. Yiyi L, Song X, Xian Z, et al. Preparation of NIR-sensitive, photothermal and photodynamic multi-functional Mxene nanosheets for laryngeal cancer therapy by regulating mitochondrial apoptosis. Mater Des. 2022. doi:10.1016/j.matdes.2022.110887
24. Yiyu C, Ping L, Chunze Z, et al. Gold nanobipyramid@copper sulfide nanotheranostics for image-guided NIR-II photo/chemodynamic cancer therapy with enhanced immune response. Acta Biomater. 2023. doi:10.1016/j.actbio.2022.12.072
25. Yu M, Congcong W, Lijie S, et al. Composite films based on Bi2Se3 nanosheets and carbon nanotubes with photothermal and photodynamic functions for synergistic treatment. Mater Des. 2023. doi:10.1016/j.matdes.2023.112201
26. Zedong C, Meng‐Lei H, Yaowen Z, et al. Tumor targeted combination therapeutic system for the effective treatment of drug resistant triple negative breast cancer. Int J Pharm. 2023. doi:10.1016/j.ijpharm.2023.122821
27. Zheng Y, Zhou Z, Hanlong C, Yuhua S, Anjian X, Manzhou Z. In-situ fabrication of novel Au nanoclusters-Cu2+@sodium alginate/hyaluronic acid nanohybrid gels for cuproptosis enhanced photothermal/photodynamic/chemodynamic therapy via tumor microenvironment regulation. J Colloid Interface Sci. 2023. doi:10.1016/j.jcis.2023.03.065
28. Renlu H, Keqi T, Yanbing H, Jiancheng Y, Chenlu W, You W. Ultralow-intensity near infrared light synchronously activated collaborative chemo/photothermal/photodynamic therapy. Biomater Sci. 2020. doi:10.1039/c9bm01607
29. Feng M, Meiting L, Rui D, et al. Multifunctional FeS2@SRF@BSA nanoplatform for chemo-combined photothermal enhanced photodynamic/chemodynamic combination therapy. Biomater Sci. 2022. doi:10.1039/d1bm01597
30. Yuanyuan Y, Siqi W, Qinlin Z, et al. A multi-responsive targeting drug delivery system for combination photothermal/chemotherapy of tumor. J biomater sci Poly ed. 2022. doi:10.1080/09205063.2022.2112310
31. Albert Cheung Hoi Y, Xiaoyong D, Zixian W, Huaqing C, Bing G, Laiqiang H. Recent advances of mesoporous silica as a platform for cancer immunotherapy. Biosensors. 2022. doi:10.3390/bios12020109
32. Biki G, Bijay Kumar P, Hima Bindu R, et al. Hyaluronic acid-capped compact silica-supported mesoporous titania nanoparticles for ligand-directed delivery of doxorubicin. Acta Biomater. 2018. doi:10.1016/j.actbio.2018.09.006
33. Ting S, Fei C, Jianqin Y, et al. Hierarchical nanocomposites of graphene oxide and PEGylated protoporphyrin as carriers to load doxorubicin hydrochloride for trimodal synergistic therapy. J Mat Chem B. 2018. doi:10.1039/c8tb00733k
34. Temilolu JP, Afamefuna Elvis O, Olugbenga Oludayo O, Matthew AA. Preparation, characterization, and application of a homemade graphene for the removal of Congo red from aqueous solutions. Environ Sci Pollut Res. 2021. doi:10.1007/s11356-021-14434-z
35. Zhechen F, Zhongsheng J, Feng Z, et al. Charge reversal hairpin peptide modified synergy therapeutic nanoplatforms for tumor specific drug shuttling. Biomater Sci. 2022. doi:10.1039/d2bm00817c
36. Zhen W, Hao C, Song Y, et al. Biofunctionalized graphene oxide nanosheet for amplifying antitumor therapy: multimodal high drug encapsulation, prolonged hyperthermal window, and deep-site burst drug release. Biomaterials. 2022. doi:10.1016/j.biomaterials.2022.121629
37. Kenji M, Ryuichi N, Izumi S, et al. Development of radiohalogenated osimertinib derivatives as imaging probes for companion diagnostics of osimertinib. J Med Chem. 2022. doi:10.1021/acs.jmedchem.1c01211
38. Weikai C, Chenxi Z, Dagui C, et al. Tumor redox microenvironment modulating composite hydrogels for enhanced sonodynamic therapy of colorectal cancer. J Mat Chem B. 2022. doi:10.1039/d2tb00170e
39. Swarup Kumar M, Su-Bin Y, Choi E, et al. Anisotropic plasmonic gold nanorod–indocyanine Green@Reduced graphene oxide–doxorubicin nanohybrids for image-guided enhanced tumor theranostics. ACS Omega. 2022. doi:10.1021/acsomega.2c01306
40. Anna L-A, Ewelina G, Tomasz P, et al. Understanding structure–properties relationships of porphyrin linked to graphene oxide through π–π-stacking or covalent amide bonds. Sci Rep. 2022. doi:10.1038/s41598-022-16931-8
41. Junyao Z, Dapeng L, Qingqing O, Yang L, Jia H. Covalent coupling of porphyrins with monolayer graphene for low-voltage synaptic transistors. ACS Appl Mater Interfaces. 2022. doi:10.1021/acsami.1c22073
42. Magaela NB, Refilwe M, Tebello N. The effect of charge on Zn tetra morpholine porphyrin conjugated to folic acid-nitrogen doped graphene quantum dots for photodynamic therapy studies. Photodiagn Photodyn Ther. 2022;39:102898. doi:10.1016/j.pdpdt.2022.102898
43. Mariadoss Asha J, Nithya C, Arunkumar K. Unravel the interaction of protoporphyrin IX with reduced graphene oxide by vital spectroscopic techniques. Spectrochimica Acta. 2017. doi:10.1016/j.saa.2017.01.059
44. Jun W, Yanyan W, Kai L, et al. pH/thermal dual-responsive multifunctional drug delivery system for effective photoacoustic imaging-guided tumor chemo/photothermal therapy. APL Bioeng. 2023. doi:10.1063/5.0139929
45. Yuxin F, Yan L, Jiahe G, Xiaofan Y, Heng S. Redox‐ and pH‐responsive water‐soluble flexible organic frameworks realize synergistic tumor photodynamic and chemotherapeutic therapy. Macromol Rap Communic. 2022. doi:10.1002/marc.202200690
 © 2024 The Author(s). This work is published and licensed by Dove Medical Press Limited. The
full terms of this license are available at https://www.dovepress.com/terms.php
and incorporate the Creative Commons Attribution
- Non Commercial (unported, v3.0) License.
By accessing the work you hereby accept the Terms. Non-commercial uses of the work are permitted
without any further permission from Dove Medical Press Limited, provided the work is properly
attributed. For permission for commercial use of this work, please see paragraphs 4.2 and 5 of our Terms.
© 2024 The Author(s). This work is published and licensed by Dove Medical Press Limited. The
full terms of this license are available at https://www.dovepress.com/terms.php
and incorporate the Creative Commons Attribution
- Non Commercial (unported, v3.0) License.
By accessing the work you hereby accept the Terms. Non-commercial uses of the work are permitted
without any further permission from Dove Medical Press Limited, provided the work is properly
attributed. For permission for commercial use of this work, please see paragraphs 4.2 and 5 of our Terms.