")
Back to Journals » Drug Design, Development and Therapy » Volume 18
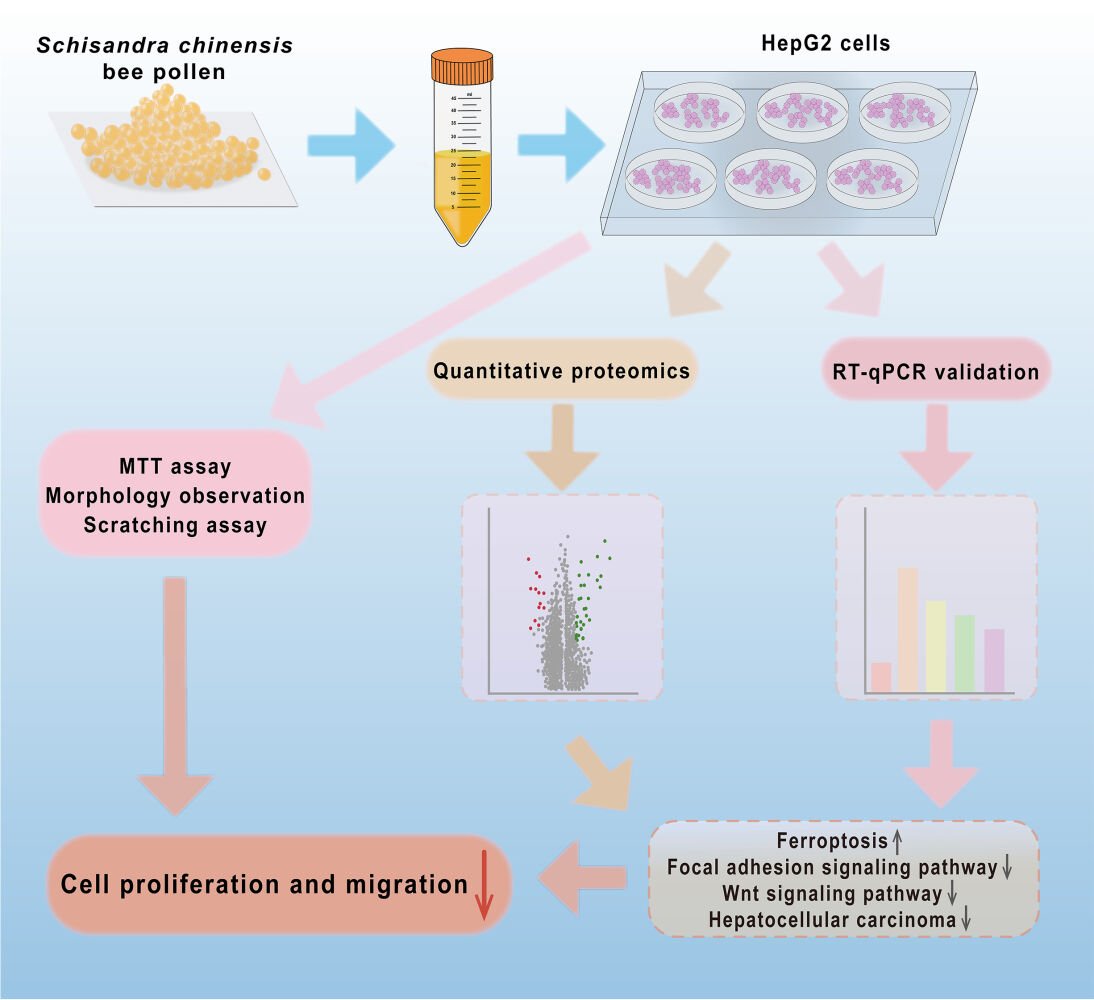
Schisandra chinensis Bee Pollen Extract Inhibits Proliferation and Migration of Hepatocellular Carcinoma HepG2 Cells via Ferroptosis-, Wnt-, and Focal Adhesion–Signaling Pathways
Authors Li Z, Yang J, Sun Y, Han S, Gong J, Zhang Y, Feng Z, Yao H , Shi P
Received 5 March 2024
Accepted for publication 18 June 2024
Published 2 July 2024 Volume 2024:18 Pages 2745—2760
DOI https://doi.org/10.2147/DDDT.S461581
Checked for plagiarism Yes
Review by Single anonymous peer review
Peer reviewer comments 2
Editor who approved publication: Professor Anastasios Lymperopoulos
Zhiliang Li,1,2,* Jiali Yang,1,3,* Yang Sun,1 Shuo Han,1 Jietao Gong,1 Yi Zhang,1,3 Zhiyuan Feng,1 Hong Yao,4 Peiying Shi1,5
1College of Bee Science and Biomedicine, Fujian Agriculture and Forestry University, Fuzhou, 350002, People’s Republic of China; 2College of Food Science, Fujian Agriculture and Forestry University, Fuzhou, 350002, People’s Republic of China; 3College of Animal Sciences, Fujian Agriculture and Forestry University, Fuzhou, 350002, People’s Republic of China; 4Department of Pharmaceutical Analysis, School of Pharmacy, Fujian Medical University, Fuzhou, 350122, People’s Republic of China; 5State and Local Joint Engineering Laboratory of Natural Biotoxins, Fujian Agriculture and Forestry University, Fuzhou, 350002, People’s Republic of China
*These authors contributed equally to this work
Correspondence: Hong Yao, Department of Pharmaceutical Analysis, School of Pharmacy, Fujian Medical University, Fuzhou, 350122, People’s Republic of China, Email [email protected] Peiying Shi, College of Bee Science and Biomedicine, Fujian Agriculture and Forestry University, Fuzhou, 350002, People’s Republic of China, Email [email protected]
Purpose: Bee pollen possesses favorable anticancer activities. As a medicinal plant source, Schisandra chinensis bee pollen (SCBP) possesses potential pharmacological properties, such as reducing cisplatin-induced liver injury, but its anti–liver cancer effect is still rarely reported. This paper aims to investigate the effect and mechanism of SCBP extract (SCBPE) on hepatocellular carcinoma HepG2 cells.
Methods: The effect of SCBPE on cell proliferation and migration of HepG2 cells was evaluated based on MTT assay, morphology observation, or scratching assay. Furthermore, tandem mass tag-based quantitative proteomics was used to study the effect mechanisms. The mRNA expression levels of identified proteins were verified by RT-qPCR.
Results: Tandem mass tag-based quantitative proteomics showed that 61 differentially expressed proteins were obtained in the SCBPE group compared with the negative-control group: 18 significantly downregulated and 43 significantly upregulated proteins. Bioinformatic analysis showed the significantly enriched KEGG pathways were predominantly ferroptosis-, Wnt-, and hepatocellular carcinoma-signaling ones. Protein–protein interaction network analysis and RT-qPCR validation revealed SCBPE also downregulated the focal adhesion–signaling pathway, which is abrogated by PF-562271, a well-known inhibitor of FAK.
Conclusion: This study confirmed SCBPE suppressed the cell proliferation and migration of hepatocellular carcinoma HepG2 cells, mainly through modulation of ferroptosis-, Wnt-, hepatocellular carcinoma-, and focal adhesion–signaling pathways, providing scientific data supporting adjuvant treatment of hepatocellular carcinoma using SCBP.
Keywords: Schisandra chinensis bee pollen extract, HepG2 cells, proteomics, ferroptosis, Wnt-signaling pathway, focal adhesion–signaling pathway
Graphical Abstract:
Introduction
Hepatocellular carcinoma (HCC) is the most common malignant liver tumor in the world.1 According to statistics, 905,677 new cases of liver cancer were estimated worldwide in 2020, and the incidence rate of liver cancer was highest in East Asia.2 Chemotherapeutic drugs, such as cisplatin, are widely used for various solid tumors. However, their clinical use is limited by toxic side effects, such as nephrotoxicity, ototoxicity, neurotoxicity, and hepatotoxicity.3
Bee pollen is one of the by-products of bee pollination of crops, and comprises a pollen ball made from male germ cells collected by the bees from flowering plants and processed by binding them to their own glandular secretions.4 Bee pollen is rich in nucleosides, flavonoids, phenolic acids, carbohydrates, polyamines, amino acids, and other active ingredients.5–7 It possesses anticancer, antioxidant, antibacterial, anti-inflammatory, and hepatoprotective properties.8–10 In recent years, food scientists have been increasingly inclined to use natural products instead of synthetic compounds.11 The abundant resources of bee pollen can provide sufficient raw materials for its use as a health food.
Anticancer activities of bee pollen and its active fractions have been reported for breast cancer,12,13 lung cancer,14 prostate cancer,15,16 liver cancer,13 colon cancer,17 and myeloid cancer.18 For instance, bee pollen aqueous extract–based synthesis of silver nanoparticles demonstrated considerable anticancer activity against human liver and breast carcinoma cell lines.13 The combination of Malaysian stingless bee pollen with cisplatin enhanced the inhibition effect of cisplatin on breast cancer MCF7 cells, allowed a reduction in the dosage of cisplatin, and mitigated physiological damage.12 Schisandra chinensis (Turcz.) Baill is a traditional Chinese medicine with high medicinal value and good anticancer prospects.19 S. chinensis bee pollen (SCBP) collected by honeybees from the flowers of S. chinensis is rich in phenolic acids, nucleosides, and carbohydrates.7 As a medicinal plant source, SCBP can reduce damage to the liver caused by cisplatin,9 but its anti–liver cancer effect has been rarely reported.
Proteomics is the study of the function and structure of all proteins expressed by organisms, including sequence, modification status, expression level, subcellular distribution, active structure, and interaction between proteins.20,21 With the development of proteomics, quantitative proteomics has become a research hot spot in life science, providing technical support to reveal the potential effect mechanisms of functional foods or herbal medicines against diseases.22–26
In this paper, the effects of SCBP extract (SCBPE) in combination with cisplatin on the proliferation of HCC HepG2 cells and normal adult liver epithelial THLE2 cells and on cell proliferation and migration of HepG2 cells were evaluated. Furthermore, tandem mass tag (TMT)-based quantitative proteomics was used to study the effect mechanism of SCBPE on HepG2 cells, and real-time quantitative PCR (qPCR) validation was performed to validate the affected genes and signaling pathways.
Methods
Chemicals and Reagents
SCBP was purchased from a beekeeping cooperative in Lu’an, Anhui, China. That with purity >95% was identified according to GB/T 30359-2021 by Associate Professor Peiying Shi and stored at 4°C at the Traditional Chinese Medicine Pharmacology Laboratory of Fujian Agriculture and Forestry University. HepG2 cell-culture medium (minimal essential medium [MEM] with 10% fetal bovine serum [FBS] and 1% penicillin–streptomycin) was obtained from Procell Life Science and Technology (Wuhan, China). High-sugar DMEM and FBS were purchased from CellMax (Beijing, China). Penicillin and streptomycin solutions were purchased from TransGen (Beijing, China). Trypsin was purchased from HyClone (Logan, UT, USA). Cell-grade DMSO was obtained from Solarbio (Beijing, China). Absolute alcohol was obtained from Sinopharm Chemical Reagent (Shanghai, China). Phosphate-buffered saline (PBS) was purchased from Biosharp (Hefei, China). MTT (3-[4,5-dimethylthiazol-2-yl]-2,5-diphenyltetrazolium bromide) was acquired from Macklin (Shanghai, China). Cisplatin was purchased from Yuanye Bio-Technology (Shanghai, China). PF-562271 was purchased from ABclonal (Wuhan, China). A TransZol Up kit was purchased from TransGen Biotech (Beijing, China). HiScript II Q RT SuperMix for qPCR (+ gDNA wiper) and ChamQ universal SYBR qPCR Master Mix were procured from Vazyme (Nanjing, China).
SCBPE Preparation and Ultrahigh-Performance Liquid Chromatography–Quadrupole Time-of-Flight Mass Spectrometry Analysis
As per our previous research,7 the SCBP was crushed and then mixed with 70% ethanol at a ratio of 1:15 (w:v). The extract was shaken in an incubator for 24 h at 37°C and then ultrasonicated for 30 min twice. The extract was subjected to vacuum decompression filtration, and the filtrate was centrifuged for 10 min (7500 g, 4°C). The supernatant was subjected to rotary evaporation to remove ethanol, and the substrate was collected and freeze-dried for 36 h to obtain lyophilized SCBPE powder with an extraction rate at 51.90%. SCBPE (1.29 g) was dissolved in 5 mL of a solvent composed of DMSO:alcohol:water (7:7:3) as SCBPE stock solution and stored at −20°C.
Lyophilized SCBPE powder (10 mg) was dissolved in 1 mL of 70% aqueous methanol. After vortexing for 2 min and ultrasonic extraction for 5 min, the solution was centrifuged at 12,704 g for 10 min and 5 μL of supernatant was transferred for ultrahigh-performance liquid chromatography–quadrupole time-of-flight mass spectrometry (UHPLC-QTOF MS) analysis. The analysis was performed on an Agilent 1290 Infinity LC (Agilent, Waldbronn, Germany) connected to an Agilent 6530 QTOF mass spectrometer (Agilent, Santa Clara, CA, USA) as per our previous research with a little modification (Figure S1).7
Cell Culture and Group Administration
HepG2 (CL-0103) and THLE2 (CL-0833) cell lines were purchased from the cell bank of Procell Life Science and Technology. Because the cells came from the commercial provider and the present experiments did not involve such activities as human embryonic/reproductive cloning, chimerism, or heritable gene manipulation, this study was considered exempt from ethical review under the Ethical Review Measures for Life Sciences and Medical Research Involving Human Beings regulation jointly issued by the National Health Commission of China and three other departments on February 18, 2023 (https://www.gov.cn/zhengce/zhengceku/2023-02/28/content_5743658.htm).
The HepG2 and THLE2 cells were cultured in MEM or DMEM, respectively, with 10% FBS and 1% penicillin–streptomycin at 37°C in a 5% CO2 incubator (C150, Binder). SCBPE stock solution and cisplatin stock solution (1 mg∙mL−1 in water) were diluted to appropriate concentrations with culture media. To study the effect of SCBPE on HepG2 cells, the cultured cells were divided into a negative-control group and SCBPE groups (0.25, 0.5, 0.75, and 1 mg∙mL−1) after 8, 12, and 24 h treatment, respectively. To study the effect of SCBPE combined with cisplatin on HepG2 or THLE2 cells, the cultured cells were divided into a negative-control group, SCBPE groups (0.5, 0.75, and 1 mg∙mL−1), cisplatin group (1.5 μg∙mL−1), and SCBPE + cisplatin groups (0.5, 0.75, and 1 mg∙mL−1 SCBPE combined with cisplatin, respectively). First, except for the negative-control and cisplatin groups, the groups were treated with SCBPE for 12 h, then all the groups were washed with PBS and the cisplatin and SCBPE + cisplatin groups were treated with 1.5 μg∙mL−1 cisplatin for 24 h.
MTT Assay
Cells were seeded at a density of 5×10³ cells per well in a 96-well microplate. After treatment, the cells were washed with PBS twice, then 100 μL of culture medium and 10 μL of MTT solution (5 mg∙mL−1) were added to each well. Then, cells were incubated in a lightproof incubator for 4 h. Finally, 100 μL of DMSO was added to each well and the absorbance value was measured at 490 nm. The proliferation-inhibition rate of HepG2 cells = (Acontrol−Aspiked) / (Acontrol−Ablank) × 100%.
Cell-Morphology Observation
HepG2 cells were inoculated at a density of 1.5×10⁵ per well in six-well plates and treated with different concentrations of SCBPE for 12 and 24 h, respectively. The cells were placed under an inverted microscope (TS-100f, Nikon) to observe morphological changes.
Scratch Assay
Logarithmic growth–phase cells were seeded at a density of 5×10⁵ per well in 24-well plates and grew until cell confluence was >90%. Then, cell monolayers were scratched in a straight line with a sterile 10 μL pipette tip and the scraped cells washed off with PBS. Images were taken under an inverted microscope at 0 h and after 24 h SCBPE treatment. The data were analyzed by ImageJ 1.53t software (National Institutes of Health, Bethesda, MD, USA). Cell-migration rate = (scratch area0h−scratch area24h)/scratch area0h × 100%.
Tandem Mass Tag–Based Proteomic Analysis
Protein Extraction
HepG2 cells in the negative-control group and 0.75 mg∙mL−1 SCBPE group were sonicated on ice in lysis buffer (8 M urea, 1% protease-inhibitor cocktail). The remaining debris was removed by centrifugation at 12,000 g for 10 min at 4°C. Finally, the supernatant was collected and the protein concentration determined using the BCA kit according to the manufacturer’s instructions.
Protein Digestion
An equal amount of each sample protein added to an appropriate amount of standard protein was adjusted to the same volume using lysis solution. Trichloroacetic acid (20%) was added, vortex-mixed well, and precipitated at 4°C for 2 h. The supernatant was discarded and the precipitate washed two to three times with precooled acetone. Then, the precipitate was dried, added to 200 mM triethylammonium bicarbonate, and dispersed by ultrasound. Trypsin was added at 1:50 trypsin-to-protein mass ratio for digestion overnight. Dithiothreitol was added to achieve a final concentration of 5 mM, then reduced at 56°C for 30 min. After that, iodoacetamide was added to achieve a final concentration of 11 mM and incubated at room temperature in the dark for 15 min.
TMT Labeling
The peptide segments obtained were desalinated with Strata X C18 (Phenomenex) and vacuum freeze-dried. Peptide segments were dissolved in 0.5 M triethylammonium bicarbonate. Each channel of peptide was labeled with its TMT reagent (ThermoFisher Scientific) and incubated for 2 h at room temperature. Then, the labeled peptide segments were mixed, desalinated, and vacuum freeze-dried.
HPLC Fractionation
Sample was divided into fractions by high-pH reverse-phase HPLC using an Agilent 300 Extend C18 column (4.6×250 mm, 5 μm). Briefly, peptides were separated with a gradient of 8%–32% acetonitrile (pH 9) over 60 min into 60 fractions. Then, the peptides were combined into six fractions and vacuum freeze-dried.
LC–MS/MS Analysis
The peptides were dissolved in mobile phase A (0.1% formic acid and 2% acetonitrile in water) and separated using an EASY-nLC 1200 UHPLC system (ThermoFisher Scientific). Mobile phase B was 0.1% formic acid and 90% acetonitrile in water. The gradient condition was 0–4 min, 7%–11% B; 4–53 min, 11%–32% B; 53–57 min, 32%–80% B; and 57–60 min, 80% B with a flow rate of 500 nL/min. The separated peptides were analyzed in an Orbitrap Exploris 480 mass spectrometer (ThermoFisher Scientific) with a nano-electrospray ion source. The electrospray voltage was 2.3 kV and the FAIMS compensation voltage −45 V. The full MS scan resolution was set to 60,000 for a scan range of 400–1200 m/z. The product ion scan resolution was set to 15,000, and the product ion was scanned from a fixed starting point at 110 m/z. TurboTMT was set to “TMT reagents.” A data-dependent acquisition program was used. Up to 25 of the most abundant precursor ions were selected and sequentially subjected to higher-energy collisional dissociation using 35% collision energy followed by secondary MS analysis. The automatic gain control was set to 100%, the intensity threshold to 5E4 ions/s, the maximum injection time to Auto, and the dynamic exclusion time to 30 s.
Database Search
The resulting MS/MS data were processed using Proteome Discoverer (v2.4.1.15). The database was Homo_sapiens_9606_SP_20210721.fasta (20,387 entries) concatenated with a reverse-decoy database. Trypsin (full) was specified as cleavage enzyme allowing up to two missing cleavages. The mass tolerance for precursor ions and product ions were set as 10 ppm and 0.02 Da, respectively. Carbamidomethyl (C), TMT6plex (peptide N-terminus), and TMT6plex (K) were specified as fixed modification, and acetyl (protein N-terminus), oxidation (M), and deamidation (N, Q) were specified as variable modifications. The quantitative method was set to TMT6plex. The false-discovery rate was adjusted to<1%.
Bioinformatic Methods
Proteins with a fold change >1.3 (or <1/1.3) and p<0.05 were considered significantly differentially expressed between the two samples. Gene Ontology (GO) annotation by proteome was derived from the UniProt GOA database (http://www.ebi.ac.uk/GOA). COG/KOG functional classification was conducted through COG/KOG database comparison. Wolf PSort, a subcellular localization predication software package, was used to predict subcellular localization. The Kyoto Encyclopedia of Genes and Genomes (KEGG) database was used to identify enriched pathways by a two-tailed Fisher’s exact test to test the enrichment of the differentially expressed proteins (DEPs) against all identified proteins. Pathways with corrected p<0.05 were considered significant. All the procedures for quantitative proteomics were performed by PTM Bio (Hangzhou, China).
Construction of Protein–Protein Interaction Network of Differential Proteins in Focal Adhesion–Signaling Pathway
A protein–protein interaction (PPI) network of differential proteins in the focal adhesion–signaling pathway was constructed using the STRING database. The highest confidence level (0.7) was chosen to construct a network map of differential protein interactions in the focal adhesion–signaling pathway.
Real-Time qPCR
The TransZol Up kit was used to extract total RNA according to the instructions, and then RNA was quantified. The desired cDNA was obtained by reverse transcription with the HiScript II Q RT SuperMix kit, and then qPCR was performed using the ChamQ Universal SYBR qPCR Master Mix kit. The mRNA-expression levels of HMOX1, CCND1, AKAP12, TAGLN, TGM2, and FZD6 were calculated relatively to that of β-actin with the 2−ΔΔCt method, while the mRNA-expression levels of RAC1, RHOA, ARHGAP35, ITGA1, ITGAV, MAPK1, TLN1, PARVA, and ITGB4 were calculated relative to that of GAPDH. The primer was designed through the NCBI and synthesized and purified by Fuzhou Shangya Biotechnology (Table 1).
 |
Table 1 Primers sequences for PCR amplification |
Blocking FAK by PF-562271
HepG2 cells were cultivated and divided into different treatment groups: negative control, SCBPE (0.75 mg∙mL−1), PF-562271 (2 μmol∙L−1), and SCBPE + PF-562271 (0.75 mg∙mL−1 SCBPE +2 μmol∙L−1 PF-562271). Cells were incubated with FAK inhibitor PF-562271 for 4 h before SCBPE treatment to verify whether SCBPE affects the focal adhesion–signaling pathway. Then, the cells were collected for MTT assay.
Statistical Analysis
All statistical tests were performed using GraphPad Prism 8.0.2 (San Diego, California USA), and results are expressed as means ± SD. Before performing the statistical analyses, the data pool was tested for normality using the Shapiro–Wilk test and for homoscedasticity using the Brown–Forsythe test. The results indicated that our data were normally distributed and the variance has homogeneous. To analyze the differences between the groups, Student’s paired t test or one-way ANOVA was used, with p<0.05 considered statistically significant.
Results
Identification of the Main Components in SCBPE
A UV chromatogram at 254 nm and total ion–current chromatogram in negative-ion mode for SCBPE are shown in Figure S1. Three nucleosides (uridine, adenosine, and guanosine), occupying 32% according to peak area normalization in the UV chromatogram, two carbohydrates (4%), and nine quinic acid nitrogen-containing derivatives (56%) were preliminarily characterized by comparison of the [M − H]− ions, molecular weight, double-bond equivalence, and formulae in accordance with the literature.7
Effects of SCBPE on the Proliferation of HepG2 and THLE2 Cells
We studied the effects of SCBPE on HepG2 cell proliferation through MTT assay and cell-morphology observation. As shown in Figure 1A, the cell proliferation–inhibition rate of 0.25–1 mg∙mL−1 SCBPE on HepG2 cells increased with rises in concentration and action time. Meanwhile, the proliferation-inhibition rate in the SCBPE + CP groups increased significantly compared with that at the same concentration in the SCBPE or CP group (p<0.01), indicating that SCBPE enhanced the anticancer efficacy of cisplatin (Figure 1B). Furthermore, the proliferation-inhibition rates of SCBPE or SCBPE + CP on normal adult liver epithelial THLE2 cells were lower than those on HepG2 cells (Figure S2).
 |
Figure 1 (A) Effects of SCBPE on the proliferation of HepG2 cells (n=6). Compared with negative-control group for the same treatment time: *p<0.05; **p<0.01. Compared with each SCBPE group at the same concentration: #p<0.05; ##p<0.01. (B) Effects of SCBPE in combination with cisplatin (CP) on the proliferation of HepG2 cells (n=6). Compared with the same concentration of SCBPE group: **p<0.01. Compared with the CP group: ##p<0.01. (C) Effects of SCBPE on the morphology of HepG2 cells (×200). |
As shown in Figure 1C, cells in the negative-control group grew together and were in a normal state. After 12 h and 24 h treatment, compared with the negative-control group, the cells treated with 0.25 mg∙mL−1 SCBPE had no significant changes in cell morphology. In the 0.5, 0.75, and 1 mg∙mL−1 SCBPE groups, the number of cells in the field of vision decreased, the cells shrank, floated, and no longer grew in groups, and a large amount of cell debris was produced. The effect of SCBPE treatment on the morphology of HepG2 cells showed an obvious dose- and time-dependent trend, suggesting the inhibition of SCBPE of the proliferation of HepG2 cells. To sum up, these results show that SCBPE can suppress HepG2 cell proliferation.
Effects of SCBPE on the Migration of HepG2 Cells
We studied the effects of SCBPE on HepG2 cell migration through scratch assay. As shown in Figure 2A and B, 0.25–0.75 mg∙mL−1 SCBPE significantly inhibited the migration of HepG2 cells compared with the negative-control group (p<0.01). SCBPE at 0.75 mg∙mL−1 was the most effective in inhibiting cell migration and was significantly different from the 0.25 mg∙mL−1 SCBPE group (p<0.01). These results showed that SCBPE suppressed the migration of HepG2 cells. HepG2 cells exposed to 0.75 mg∙mL−1 of SCBPE for 24 h were used for the subsequent quantitative proteomic experiments. These results show that SCBPE can suppress HepG2 cell migration.
 |
Figure 2 Effects of SCBPE on the migration (×100) (A) and migration rates (B) of HepG2 cells (n=6–7). Compared with the negative control group: **p<0.01. Compared with each SCBPE group: ##p<0.01. |
TMT-Based Quantitative Proteomics
Differentially Expressed Proteins
Before the quantitative proteomic study, six samples were monitored by SDS-PAGE analysis: including three controls and three SCBPE groups. As shown in Figure 3A, protein bands were uniform and clear, and the parallelism of each lane in each group was satisfactory. There were 339,048 maps in total. Among these, 85,898 were effective maps. In sum, 35,183 peptides and 6,016 proteins were identified. Depending on the screening level of DEPs (P<0.05, FC >1.3 or FC <1/1.3), 61 DEPs were obtained in the SCBPE group compared with the control group: 18 significantly downregulated proteins and 43 significantly upregulated proteins (Figure 3B, Tables S1, and S2).
 |
Figure 3 (A) SDS-PAGE analysis for all proteins of control (C1–3) and SCBPE (E1–3). (B) Volcano map of DEPs in comparison for SCBPE vs control. The green dots denote the downregulated DEPs, the red dots denote the upregulated DEPs. (C) Subcellular localization prediction of DEPs. (D and E) COG/KOG and GO annotation results of DEPs. (F) Bubble chart of KEGG pathway enrichment analysis of DEPs. |
Subcellular Localization and COG/KOG Classification of DEPs
The location of subcellular structure was analyzed based on these DEPs. As shown in Figure 3C, 21 DEPs were located at the nucleus, 20 at the cytoplasm, and 11 at the plasma membrane in the SCBPE group vs control group. COG/KOG classification showed that the proteins that were changed in the SCBPE group vs control group were mainly related to inorganic ion transport and metabolism (COG/KOG category, metabolism), transcription (information storage and processing), and signal-transduction mechanisms (cellular processes and signaling) (Figure 3D).
GO Annotation of DEPs
GO classification was carried out to understand the functional classification of all DEPs between groups. In the annotation of biological processes, most DEPs were involved in the cellular process (47 DEPs), biological regulation (41 DEPs), and response to stimuli (36 DEPs) on comparisons of the SCBPE group vs control group (Figure 3E). Most DEPs in the cellular component annotation were cellular (46 DEPs) and intracellular (44 DEPs). Molecular function analysis showed that most DEPs were related to binding (37 DEPs) and catalytic activities (18 DEPs).
KEGG Pathway Enrichment Analysis of DEPs
KEGG enrichment of DEPs was performed between groups. As shown in Figure 3F, the bubble chart demonstrates that the enriched pathways predominantly included mineral absorption, ferroptosis, drug metabolism—other enzymes, the Wnt-signaling pathway, HCC, and necroptosis. The second–most enriched entry was the ferroptosis-signaling pathway, referring to four DEPs—HMXO1, FTH1, FTL, and IREB2—and warranted validation by other techniques, such as real-time qPCR, due to the fact that the ferroptosis pathway is closely related to cell death.
Real-Time qPCR Validation
To verify the expression of the identified proteins, we analyzed gene expression of six DEPs in the negative-control and 0.5, 0.75, and 1 mg∙mL−1 SCBPE groups by real-time qPCR. The results (Figure 4) showed that compared with the negative-control group, the gene-expression levels of HMOX1 and AKAP12 had significantly increased in the SCBPE groups in a dose-dependent manner (p<0.05 or p<0.01) and those of CCND1, FZD6, TAGLN, and TGM2 had significantly decreased in the SCBPE groups (p<0.05 or p<0.01). The gene-expression levels of the six DEPs correlated significantly with protein-expression levels, indicated that the TMT-based quantitative proteomics data were reliable.
 |
Figure 4 Gene expression of six DEPs, including (A) HMOX1, (B) FZD6, (C) CCND1, (D) AKAP12, (E) TAGLN and (F) TGM2, on real-time qPCR (n=5). Compared with negative-control group: *p<0.05, **p<0.01. |
Effects of SCBPE on the Focal Adhesion Pathway in HepG2 Cells
PPI Network Analysis of Differential Proteins in Focal Adhesion–Signaling Pathway
A total of differential proteins (P<0.05) in the focal adhesion–signaling pathway of the SCBPE groups compared with the control group are shown in Table S3. The differential proteins were entered into the STRING web page (https://cn.string-db.org, accessed on August 13, 2023), and a PPI map of differential proteins in the focal adhesion–signaling pathway was obtained (Figure 5A). Among these, RHOA, TLN1, VCL, ITGA1, ITGAV, and ITGB4 interacted with 12, 12, 11, 10, 10, and 10 proteins, respectively, indicating that RHOA, TLN1, VCL, ITGA1, ITGAV, and ITGB4 played important roles in the focal adhesion pathway in the SCBPE groups compared with the negative-control group.
 |
Figure 5 (A) PPI analysis results of differential proteins in focal adhesion pathway. (B) Expression levels of genes related to the focal adhesion pathway in HepG2 cells exposed to SCBPE for 24 h (n=5). (C) Effects of SCBPE (0.75 mg∙mL−1) and/or PF-562271 (2 μmol∙L−1) on the proliferation of HepG2 cells (n=5). Compared with the negative-control group: *p<0.05; **p<0.01. Compared with each treatment group: ##p<0.01. |
Expression Levels of Genes Related to the Focal Adhesion–Signaling Pathway in HepG2 Cells Exposed to SCBPE for 24 h
Gene-expression levels of RAC1, RHOA, ARHGAP35, ITGA1, ITGAV, MAPK1, ITGB4, PARVA, and TLN1 in HepG2 cells, relating to the focal adhesion–signaling pathway, were detected by RT-qPCR after exposure to SCBPE (0.75 mg∙mL−1) for 24 h (Figure 5B). The results showed that the gene-expression levels had significantly decreased in the SCBPE group compared with the negative-control group (p<0.01 or p<0.05), suggesting that SCBPE can downregulate the focal adhesion–signaling pathway in HepG2 cells.
Blockage of Focal Adhesion–Signaling Pathway Using PF-562271
To further evaluate whether the focal adhesion-signaling pathway is crucial to the anti-HCC effect of SCBPE, we abrogated FAK using PF-562271 (a well-known inhibitor of FAK). As shown in Figure 5C, compared with the negative-control group, similarly to SCBPE, application of PF-562271 alone or combined with SCBPE significantly increased the cell proliferation–inhibition rate (p<0.01). Moreover, combined application of SCBPE and PF-562271 resulted in a significant increase in the cell proliferation–inhibition rate compared with SCBPE or PF-562271 treatment alone (p<0.01).
Discussion
Bee pollen and its active fractions possess inhibitory effects on various cancer cells.12–18 Fourteen main components, occupying 92% according to peak area normalization in the UV chromatogram, were tentatively characterized in SCBPE via UHPLC-QTOF MS.7 Among these components, six compounds were in the caffeoyl quinic acid group. Chlorogenic acid (3-caffeoyl-quinic acid) and adenosine have been reported to inhibit HepG2 cell proliferation.27,28 In this study, SCBPE in combination with cisplatin inhibited the proliferation of HepG2 cells and SCBPE suppressed the cell proliferation and migration of HepG2 cells.
TMT-based proteomics is a mature and high-throughput technology, and has been applied to investigate the anticancer-effect mechanisms of functional food components.29 In this study, TMT-based quantitative proteomics was used to study the effect mechanisms of SCBPE on HepG2 cells, and qPCR validation was performed. The results showed that DEPs were mainly involved in the ferroptosis-, Wnt-, and HCC-signaling pathways. PPI network analysis and RT-qPCR validation revealed SCBPE also downregulated the focal adhesion–signaling pathway.
HMOX1, an important enzyme in heme metabolism, is an intracellular homeostatic regulator that both protects cells and causes cell death through ferroptosis.30 Upregulation of HMOX1 contributes to ferrous accumulation, which leads to cell cytotoxicity via ROS generation.31 HMOX1 reduced the migration and invasion of breast cancer MCF7 cells and inhibited the proliferation and migration of PC3 cells.32,33 In this study, upon treatment of HepG2 cells with SCBPE, there was an elevation in the expression of HMOX1, which triggered cell ferroptosis. IREB2 is an RNA-binding protein that regulates iron levels. miR19a suppresses ferroptosis by inhibiting IREB2.34 Iron-storage proteins, including FTL and FTH1, are responsible for intracellular iron storage and play a key role in iron metabolism.35 In this study, SCBPE induced ferroptosis in HCC cells by upregulating the expression of HMOX1 and IREB2 and downregulating the expression of FTH1 and FTL, leading to suppression of the proliferation and migration of HepG2 cells (Figure 6).
 |
Figure 6 Probable anticancer molecular mechanism of SCBPE on HepG2 cells. |
FZD is a family of seven transmembrane receptors that belong to a family of G protein–coupled receptors.36 FZD is the receptor of secreted Wnt ligands in the Wnt-signaling pathway that can affect the subsequent degradation and stability of β-catenin. It has been reported that miRNA21 targets FZD6, inhibits proliferation, reduces the migration of gastric cancer cells through Wnt classical and nonclassical pathways,37 and that miR497-5p regulates the expression of FZD4 and FZD6, which inhibits the Wnt–β-catenin pathway and suppresses the proliferation, migration, and invasion of pancreatic cancer cells.38 The findings of our research align with the aforementioned studies, wherein SCBPE downregulated FZD6 expression, modulated the Wnt-signaling pathway, and inhibited HCC cell proliferation and migration. In addition, CCND1 is a key protein for cell proliferation in the G1 phase, which activates cyclin-dependent kinases to accelerate cell entry into the S phase, leading to accelerated cell proliferation and division, resulting in migration and invasion of tumor cells.39 Selective degradation of CCND1 blocks the HCC cell cycle at the G1 phase, preventing DNA synthesis, cell proliferation, cloning, and tumor formation.40 It has also shown that CCND1 silencing inhibits the activity of the DNA-repair protein RAD51 and increases the sensitivity of HCC cells to 5-fluorouracil while inhibiting the differentiation of HCC cells.41 Our proteomic and RT-qPCR results showed that SCBPE inhibited the Wnt-signaling pathway in HCC cells by downregulating the expression of FZD and CCND1, leading to suppression of the proliferation and migration of HepG2 cells (Figure 6).
HCC is the main type of primary liver cancer. Studies have shown that mutated genes associated with liver cancer recurrence are highly enriched in several critical signaling processes, such as cell cycle, Wnt–β-catenin and PI3K–Akt–mTOR.42 In this study, SCBPE inhibited the HCC-signaling pathway in HCC cells by downregulating the expression of FZD and CCND1, resulting in suppression of the proliferation and migration of HepG2 cells (Figure 6).
The focal adhesion–signaling pathway is closely related to various biological behaviors, such as proliferation, adhesion, invasion, and migration of cancer cells.43 Integrins (ITGs) form heterodimers with α and β subunits in a noncovalent bond and are mediators of cell–extracellular matrix interactions, providing a physical link to the cytoskeleton and transducing signals from the extracellular matrix to the cell.44 ITGs are essential for several cellular processes, including migration, proliferation, and survival. Liu et al45 reported that silencing ITGA1 inhibited migration and invasion of HCC cells, whereas upregulation of ITGA1 enhanced migration and invasion of HCC cells in vitro. Furthermore, overexpression of ITGA1 has been shown to be a key driver of lymph-node metastasis in HCC.46 Knockdown of ITGAV abrogates lncRNA AY927503-induced migration of HCC cells.47 Recent studies have shown that ITGB4 has an important role in promoting carcinogenesis in prostate cancer48 and lung squamous cell carcinoma,49 and that ITGB4 is involved in prostate cancer invasion and migration. Our study found that SCBPE reduced the expression of ITGA1, ITGAV, and ITGB4, and scratch assays confirmed that SCBPE inhibited the migration of HepG2 cells, suggesting ITGs could be a target for the treatment of liver cancer (Figure 6).
FAK is a non–receptor cytoplasmic tyrosine kinase that transmits signals important in modulating several cell functions, including proliferation, migration, and survival.50 The tyrosine kinase FAK localizes primarily to focal adhesions and is activated upon integrin-mediated adhesion.51 Zhou et al52 observed that treatment with 2-fluoro-
The Rho GTPase-activating protein ARHGAP35 is reported to be a possible molecular target for lung adenocarcinoma. Knockdown of ARHGAP35 decreased cell migration in three cell lines — A549, H1975, and PC9.53 The Rho subfamily, consisting of RhoA, RhoB, and RhoC, regulates the formation of stress fibers and focal adhesions in cells.54 Upregulation of RhoA expression promotes migration and invasion of HCC cells.55 RAC1, a member of the Rho GTPase family, affects angiogenesis and cancer invasion and metastasis, and targeting RAC1 is an effective way to treat cutaneous melanoma.56 A study by Liu et al57 indicated that RAC1 is highly expressed in HCCLM9, a highly aggressive HCC, regulates cell motility and cytoskeletal aggregation, and is a key regulator of HCC cell metastasis in vivo and in vitro. MAPK1 is an oncogene in several cancers, and activation of MAPK1 accelerates the malignant process of thyroid cancer.58 MAPK1 mediates S675 phosphorylation of β-linked protein, which activates the Wnt pathway and promotes intrahepatic cholangiocarcinoma progression.59 TLN1 is one of the key proteins required for cell matrix–adhesion assembly and mediates the interaction between the actin cytoskeleton and ITGs.60 Serum levels of talin are significantly higher in HCC patients than in cirrhotic patients and healthy controls.61 TLN1 can be used as a novel molecular marker of HCC progression through differential tissue proteomics.62 PARVA (α-parvin) is an important component of extracellular matrix adhesion, and has been found to increase metastasis, tumorigenicity and angiogenesis of lung cancer.63
In this study, SCBPE inhibited the focal adhesion–signaling pathway in HCC cells by downregulating the expression of ITGA1, ITGAV, ITGB4, TLN1, PARVA, ARHGAP35, RHOA, RAC1, and MAPK1, resulting in suppression of the proliferation and migration of HepG2 cells (Figure 6). As cell-adhesion molecules, ITGs can regulate tumor proliferation, migration, and invasion, affecting important physiological functions of cells. Their expression was reduced, and binding to ligands induced changes in focal adhesion kinases of downstream signaling pathways, inhibiting the expression of RAC1. Downregulation of ITGs can also cause a decrease in the reception signals of TLN1 and PARVA, the major components of the extracellular matrix, affecting cytoskeletal remodeling and intercellular junctions. In addition, integrin-mediated Rho GTPase is also involved in cell migration (Figure 6).
AKAP12 belongs to a family of kinase-scaffolding proteins that play an important role in cancer signaling and function to anchor protein kinase C, protein kinase A, and cell-cycle proteins to the plasma membrane.64 As a member of the AKAP family of tumor suppressors, AKAP12 expression has been found to be downregulated in a variety of cancers. AKAP12 regulates G protein–coupled receptor–mediated signaling and downregulates the expression and nuclear localization of CCND1, a G1-phase cyclin, hence blocking the cell cycle.65,66 Overexpression of AKAP12 inhibits miR1251-5p-induced proliferation, migration, and invasion of HCC cells.67 These results suggest that AKAP12 has an anticancer role in HCC and could be an effective target for the treatment of HCC. Our research findings revealed a similar pattern: following SCBPE treatment, AKAP12 expression elevated, while CCND1 expression declined. We speculate that AKAP12 may influence the expression level and cellular localization of CCND1, ultimately affecting the cell cycle and inhibiting cell proliferation. This study is an initial investigation of the underlying mechanisms, and in the future, flow cytometry can be used to further investigate the impact of SCBPE on the cell cycle.
TAGLN is an actin-binding/gelling protein that is localized in the cytoplasm. A number of studies have demonstrated that TAGLN is closely associated with the process of tumor development, and TAGLN is overexpressed in malignant tumors, such as lung cancer68 and gastric cancer.69 TGM2, a member of the TGM family, also known as tissue-type transglutaminase, is the key enzyme that catalyzes the formation of irreversible cross-links between polypeptide chains in a Ca2+-dependent manner.70 TGM2 is significantly upregulated in patients with early HCC recurrence, and might be a helpful marker for the early detection of HCC recurrence.71 TGM2 interference in colorectal cancer cells can reduce cell viability and angiogenesis and promote cell apoptosis by inhibiting the Wnt3a–catenin–cyclin D1 pathway.72 In this study, SCBPE downregulated the expression of TAGLN and TGM2, leading to suppression of the proliferation and migration of HepG2 cells (Figure 6).
Conclusion
The present study demonstrates that SCBPE suppresses the cell proliferation and migration of HCC HepG2 cells, mainly through modulation of the ferroptosis-, Wnt-, and focal adhesion–signaling pathways, based on quantitative proteomic and bioinformatic analysis. This research provides scientific data for adjuvant treatment of HCC using SCBP.
Acknowledgments
The authors gratefully acknowledge the key projects supported by the Natural Science Foundation of Fujian Province, China (2021J02033) and Natural Science Foundation of Fujian Province, China (2023J01075).
Disclosure
The authors report no conflicts of interest in this work.
References
1. Zhao M. Hepatic arterial infusion chemotherapy in the era of precise medicine. J Sun Yat-Sen Univ Med Sci. 2019;5(5):648–656.
2. Cao M, Li H, Sun D, et al. Global epidemiology of liver cancer in 2020. Chin J Cancer. 2022;29(5):322–328. doi:10.16073/j.cnki.cjcpt.2022.05.03
3. Qi L, Luo Q, Zhang Y, et al. Advances in toxicological research of the anticancer drug cisplatin. Chem Res Toxicol. 2019;32(8):1469–1486. doi:10.1021/acs.chemrestox.9b00204
4. Yang K, Wu D, Ye X, et al. Characterization of chemical composition of bee pollen in China. J Agric Food Chem. 2013;61(3):708–718. doi:10.1021/jf304056b
5. Han S, Chen L, Zhang Y, et al. Lotus bee pollen extract inhibits isoproterenol-induced hypertrophy via JAK2/STAT3 signaling pathway in rat H9c2 cells. Antioxidants. 2023;12(1):88. doi:10.3390/antiox12010088
6. Li QQ, Wang K, Marcucci MC, et al. Nutrient-rich bee pollen: a treasure trove of active natural metabolites. J Funct Foods. 2018;49:472–484. doi:10.1016/j.jff.2018.09.008
7. Shi P, Geng Q, Chen L, et al. Schisandra chinensis bee pollen’s chemical profiles and protective effect against H2O2-induced apoptosis in H9c2 cardiomyocytes. BMC Compl Med Ther. 2020;20(1):274. doi:10.1186/s12906-020-03069-1
8. Denisow B, Denisow-Pietrzyk M. Biological and therapeutic properties of bee pollen: a review. J Sci Food Agric. 2016;96(13):4303–4309. doi:10.1002/jsfa.7729
9. Huang H, Shen Z, Geng Q, et al. Protective effect of Schisandra chinensis bee pollen extract on liver and kidney injury induced by cisplatin in rats. Biomed Pharmacother. 2017;95:1765–1776. doi:10.1016/j.biopha.2017.09.083
10. Sun L, Guo Y, Zhang Y, et al. Antioxidant and anti-tyrosinase activities of phenolic extracts from rape bee pollen and inhibitory melanogenesis by cAMP/MITF/TYR pathway in B16 mouse melanoma cells. Front Pharmacol. 2017;8:104. doi:10.3389/fphar.2017.00104
11. Katz L, Baltz RH. Natural product discovery: past, present, and future. J Ind Microbiol. 2016;43:155–176. doi:10.1007/s10295-015-1723-5
12. Omar WAW, Azhar NA, Fadzilah NH, et al. Bee pollen extract of Malaysian stingless bee enhances the effect of cisplatin on breast cancer cell lines. Asian Pac J Trop Biomed. 2016;6(3):265–269. doi:10.1016/j.apjtb.2015.12.011
13. Al-Yousef HM, Amina M, Alqahtani AS, et al. Pollen bee aqueous extract-based synthesis of silver nanoparticles and evaluation of their anti-cancer and anti-bacterial activities. Processes. 2020;8:524. doi:10.3390/pr8050524
14. Saisavoey T, Sangtanoo P, Srimongkol P, et al. Hydrolysates from bee pollen could induced apoptosis in human bronchogenic carcinoma cells (ChaGo-K-1). J Food Sci Technol. 2021;58(2):752–763. doi:10.1007/s13197-020-04592-2
15. Tuoheti T, Rasheed HA, Meng L, et al. High hydrostatic pressure enhances the anti-proliferative properties of lotus bee pollen on the human prostate cancer PC-3 cells via increased metabolites. J Ethnopharmacol. 2020;261:113057. doi:10.1016/j.jep.2020.113057
16. Wu YD, Lou YJ. A steroid fraction of chloroform extract from bee pollen of Brassica campestris induces apoptosis in human prostate cancer PC-3 cells. Phytother Res. 2007;21(11):1087–1091. doi:10.1002/ptr.2235
17. Wang B, Diao Q, Zhang Z, et al. Antitumor activity of bee pollen polysaccharides from Rosa rugosa. Mol Med Rep. 2013;7(5):1555–1558. doi:10.3892/mmr.2013.1382
18. Uçar M, Deger O, Gerigelmez AY, et al. Effect of Turkish pollen and propolis extracts on caspase-3 activity in myeloid cancer cell lines. Trop J Pharm Res. 2016;15(11):2445–2449. doi:10.4314/tjpr.v15i11.20
19. Choi SK, Lee YG, Wang RB, et al. Dibenzocyclooctadiene lignans from the fruits of Schisandra chinensis and their cytotoxicity on human cancer cell lines. Appl Biol Chem. 2020;63:39. doi:10.1186/s13765-020-00524-y
20. Ji M, Fu B, Zhang Y. Recent progress of analytical methods of proteomics based on mass spectrometry. J Chin Mass Spectrom Soc. 2021;42(5):862–877. doi:10.7538/zpxb.2021.0091
21. Zhang Y, Cai Q, Luo Y, et al. Integrated top-down and bottom-up proteomics mass spectrometry for the characterization of endogenous ribosomal protein heterogeneity. J Pharm Anal. 2023;13(1):63–72. doi:10.1016/j.jpha.2022.11.003
22. Li S, Liu H, Lin Z, et al. Isoorientin attenuates doxorubicin-induced cardiac injury via the activation of MAPK, Akt, and Caspase-dependent signaling pathways. Phytomed. 2022;101:154105. doi:10.1016/j.phymed.2022.154105
23. Meng Y, Chen J, Liu Y, et al. A highly efficient protein Corona-based proteomic analysis strategy for the discovery of pharmacodynamic biomarkers. J Pharm Anal. 2022;12(6):879–888. doi:10.1016/j.jpha.2022.07.002
24. Shi P, Du T, Meng F, et al. Ethanol extract of propolis alleviates diabetic cardiomyopathy via JAK2/STAT3 signaling pathway. J Funct Foods. 2023;107:105688. doi:10.1016/j.jff.2023.105688
25. Yang Y, Liu M, Li H, et al. Proteomics analysis of the protective effect of canola (Brassica campestris L.) bee pollen flavonoids on the tert-butyl hydroperoxide-induced EA.hy926 cell injury model. J Funct Foods. 2020;75:104223. doi:10.1016/j.jff.2020.104223
26. Zhao L, Pan F, Zhou N, et al. Quantitative proteomics and bioinformatics analyses reveal the protective effects of cyanidin-3-O-glucoside and its metabolite protocatechuic acid against 2-amino-3-methylimidazo[4,5-f]quinoline (IQ)-induced cytotoxicity in HepG2 cells via apoptosis-related pathways. Food Chem Toxicol. 2021;153:112256. doi:10.1016/j.fct.2021.112256
27. Tang H, Liu X, Wang R, et al. Effects of oleanolic acid and chlorogenic acid on HepG2 cells and P450 enzyme expression. Chin Tradit Pat Med. 2013;35:2576–2580.
28. Wu LF, Ye YQ, Huang GY, et al. Involvement of endoplasmic reticulum stress in adenosine-induced human hepatoma HepG2 cell apoptosis. Oncol Rep. 2011;26(1):73–79. doi:10.3892/or.2011.1247
29. Ma RH, Ni ZJ, Thakur K, et al. Transcriptome and proteomics conjoint analysis reveal metastasis inhibitory effect of 6-shogaol as ferroptosis activator through the PI3K/AKT pathway in human endometrial carcinoma in vitro and in vivo. Food Chem Toxicol. 2022;170:113499. doi:10.1016/j.fct.2022.113499
30. Ryter SW, Tyrrell RM. The heme synthesis and degradation pathways: role in oxidant sensitivity, Heme oxygenase has both pro- and antioxidant properties. Free Radic Biol Med. 2000;28(2):289–309. doi:10.1016/s0891-5849(99)00223-3
31. Chang LC, Chiang SK, Chen SE, et al. Heme oxygenase-1 mediates BAY 11-7085 induced ferroptosis. Cancer Lett. 2018;416:124–137. doi:10.1016/j.canlet.2017.12.025
32. Zhu X, Huang S, Zeng L, et al. HMOX-1 inhibits TGF-β-induced epithelial-mesenchymal transition in the MCF-7 breast cancer cell line. Int J Mol Med. 2017;40(2):411–417. doi:10.3892/ijmm.2017.3027
33. Gueron G, De Siervi A, Ferrando M, et al. Critical role of endogenous heme oxygenase 1 as a tuner of the invasive potential of prostate cancer cells. Mol Cancer Res. 2009;7(11):1745–1755. doi:10.1158/1541-7786.MCR-08-0325
34. Fan H, Ai R, Mu S, et al. MiR-19a suppresses ferroptosis of colorectal cancer cells by targeting IREB2. Bioengineered. 2022;13(5):12021–12029. doi:10.1080/21655979.2022.2054194
35. Ebrahimi KH, Hagedoorn P-L, Hagen WR. Unity in the biochemistry of the iron-storage proteins ferritin and bacterioferritin. Chem Rev. 2015;115(1):295–326. doi:10.1021/cr5004908
36. Shi Y, He B, You L, et al. Roles of secreted frizzled-related proteins in cancer. Acta Pharmacol Sin. 2007;28(9):1499–1504. doi:10.1111/j.1745-7254.2007.00692.x
37. Yan J, Liu T, Zhou X, et al. FZD6, targeted by miR-21, represses gastric cancer cell proliferation and migration via activating non-canonical wnt pathway. Am J Transl Res. 2016;8(5):2354–2364.
38. Yang J, Ye Z, Mei D, et al. Long noncoding RNA DLX6-AS1 promotes tumorigenesis by modulating miR-497-5p/FZD4/FZD6/Wnt/β-catenin pathway in pancreatic cancer. Cancer Manage Res. 2019;11:4209–4221. doi:10.2147/CMAR.S194453
39. Montalto FI, De Amicis F. Cyclin D1 in cancer: a molecular connection for cell cycle control, adhesion and invasion in tumor and stroma. Cells. 2020;9(12):2648. doi:10.3390/cells9122648
40. Wu SY, Lan SH, Liu HS. Degradative autophagy selectively regulates CCND1 (cyclin D1) and MIR224, two oncogenic factors involved in hepatocellular carcinoma tumorigenesis. Autophagy. 2019;15(4):729–730. doi:10.1080/15548627.2019.1569918
41. Ding H, Wang Y, Zhang H. CCND1 silencing suppresses liver cancer stem cell differentiation and overcomes 5-Fluorouracil resistance in hepatocellular carcinoma. J Pharmacol Sci. 2020;143(3):219–225. doi:10.1016/j.jphs.2020.04.006
42. Whittaker S, Marais R, Zhu AX. The role of signaling pathways in the development and treatment of hepatocellular carcinoma. Oncogene. 2010;29(36):4989–5005. doi:10.1038/onc.2010.236
43. Parsons JT, Slack-Davis J, Tilghman R, et al. Focal adhesion kinase: targeting adhesion signaling pathways for therapeutic intervention. Clin Cancer Res. 2008;14(3):627–632. doi:10.1158/1078-0432.CCR-07-2220
44. Moreno-Layseca P, Icha J, Hamidi H, et al. Integrin trafficking in cells and tissues. Nat Cell Biol. 2019;21(2):122–132. doi:10.1038/s41556-018-0223-z
45. Liu X, Tian H, Li H, et al. Derivate isocorydine (d-ICD) suppresses migration and invasion of hepatocellular carcinoma cell by downregulating ITGA1 expression. Int J Mol Sci. 2017;18(3):514. doi:10.3390/ijms18030514
46. Wan J, Wen D, Dong L, et al. Establishment of monoclonal HCC cell lines with organ site-specific tropisms. BMC Cancer. 2015;15:678. doi:10.1186/s12885-015-1692-0
47. Kang CL, Qi B, Cai QQ, et al. LncRNA AY promotes hepatocellular carcinoma metastasis by stimulating ITGAV transcription. Theranostics. 2019;9(15):4421–4436. doi:10.7150/thno.32854
48. Yoshioka T, Otero J, Chen Y, et al. β4 Integrin signaling induces expansion of prostate tumor progenitors. J Clin Invest. 2013;123(2):682–699. doi:10.1172/JCI60720
49. Moilanen JM, Löffek S, Kokkonen N, et al. Significant role of collagen XVII and integrin β4 in migration and invasion of the less aggressive squamous cell carcinoma cells. Sci Rep. 2017;7:45057. doi:10.1038/srep45057
50. Hecker TP, Gladson CL. Focal adhesion kinase in cancer. Front Biosci. 2003;8:s705–714. doi:10.2741/1115
51. Siesser PMF, Hanks SK. The signaling and biological implications of FAK overexpression in cancer. Clin Cancer Res. 2006;12(11):3233–3237. doi:10.1158/1078-0432.CCR-06-0456
52. Zhou Y, Fukuda T, Hang Q, et al. Inhibition of fucosylation by 2-fluorofucose suppresses human liver cancer HepG2 cell proliferation and migration as well as tumor formation. Sci Rep. 2017;7(1):11563. doi:10.1038/s41598-017-11911-9
53. Onodera K, Sakurada A, Notsuda H, et al. Growth inhibition of KRAS‑ and EGFR‑mutant lung adenocarcinoma by cosuppression of STAT3 and the SRC/ARHGAP35 axis. Oncol Rep. 2018;40(3):1761–1768. doi:10.3892/or.2018.6536
54. Wang D, Dou K, Xiang H, et al. Involvement of RhoA in progression of human hepatocellular carcinoma. J Gastroe Hepatol. 2007;22(11):1916–1920. doi:10.1111/j.1440-1746.2006.04534.x
55. Wang T, Rao D, Yu C, et al. RHO GTPase family in hepatocellular carcinoma. Exp Hematol Oncol. 2022;11(1):91. doi:10.1186/s40164-022-00344-4
56. Colón-Bolea P, García-Gómez R, Casar B. RAC1 Activation as a potential therapeutic option in metastatic cutaneous melanoma. Biomolecules. 2021;11(11):1554. doi:10.3390/biom11111554
57. Liu S, Yu M, He Y, et al. Melittin prevents liver cancer cell metastasis through inhibition of the Rac1-dependent pathway. Hepatology. 2008;47(6):1964–1973. doi:10.1002/hep.22240
58. Chen H, Li Q, Yi R, et al. CircRNA casein kinase 1 gamma 1 (circ-CSNK1G1) plays carcinogenic effects in thyroid cancer by acting as miR-149-5p sponge and relieving the suppression of miR-149-5p on mitogen-activated protein kinase 1 (MAPK1). J Clin Lab Anal. 2022;36(2):e24188. doi:10.1002/jcla.24188
59. Zheng Y, Zhou C, Yu XX, et al. Osteopontin promotes metastasis of intrahepatic cholangiocarcinoma through recruiting MAPK1 and mediating Ser675 phosphorylation of β-Catenin. Cell Death Dis. 2018;9(2):179. doi:10.1038/s41419-017-0226-x
60. Goult BT, Gingras AR, Bate N, et al. The domain structure of talin: residues 1815-1973 form a five-helix bundle containing a cryptic vinculin-binding site. FEBS Lett. 2010;584(11):2237–2241. doi:10.1016/j.febslet.2010.04.028
61. Ibrahim ESH, Naguib H, Emara DM, et al. Assessment of serum Talin-1 in liver cirrhosis and hepatocellular carcinoma. Egypt Liver J. 2022;12:19. doi:10.1186/s43066-022-00184-1
62. Kanamori H, Kawakami T, Effendi K, et al. Identification by differential tissue proteome analysis of talin-1 as a novel molecular marker of progression of hepatocellular carcinoma. Oncology. 2011;80(5):406–415. doi:10.1159/000330734
63. Huang AH, Pan SH, Chang WH, et al. PARVA promotes metastasis by modulating ILK signalling pathway in lung adenocarcinoma. PLoS One. 2015;10(3):e0118530. doi:10.1371/journal.pone.0118530
64. Radeva MY, Kugelmann D, Spindler V, et al. PKA compartmentalization via AKAP220 and AKAP12 contributes to endothelial barrier regulation. PLoS One. 2014;9(9):e106733. doi:10.1371/journal.pone.0106733
65. Gelman IH. Suppression of tumor and metastasis progression through the scaffolding functions of SSeCKS/Gravin/AKAP12. Cancer Metastasis Rev. 2012;31(3):493–500. doi:10.1007/s10555-012-9360-1
66. Yoon D-K, Jeong C-H, O JH, et al. AKAP12 induces apoptotic cell death in human fibrosarcoma cells by regulating CDKI-cyclin D1 and caspase-3 activity. Cancer Lett. 2007;254(1):111–118. doi:10.1016/j.canlet.2007.02.017
67. Han S, Wang L, Sun L, et al. MicroRNA-1251-5p promotes tumor growth and metastasis of hepatocellular carcinoma by targeting AKAP12. Biomed Pharmacother. 2020;122:109754. doi:10.1016/j.biopha.2019.109754
68. Fu J, Wang X, Yue Q. Functional loss of TAGLN inhibits tumor growth and increases chemosensitivity of non-small cell lung cancer. Biochem Biophys Res Com. 2020;529(4):1086–1093. doi:10.1016/j.bbrc.2020.06.066
69. Yu B, Chen X, Li J, et al. Stromal fibroblasts in the microenvironment of gastric carcinomas promote tumor metastasis via upregulating TAGLN expression. BMC Cell Biol. 2013;14:17. doi:10.1186/1471-2121-14-17
70. Tatsukawa H, Hitomi K. Role of Transglutaminase 2 in Cell Death, Survival, and Fibrosis. Cells. 2021;10(7):1842. doi:10.3390/cells10071842
71. Yamaguchi H, Kuroda K, Sugitani M, et al. Transglutaminase 2 is upregulated in primary hepatocellular carcinoma with early recurrence as determined by proteomic profiles. Int J Oncol. 2017;50(5):749–1759. doi:10.3892/ijo.2017.3917
72. Yang P, Yu D, Zhou J, et al. TGM2 interference regulates the angiogenesis and apoptosis of colorectal cancer via Wnt/β-catenin pathway. Cell Cycle. 2019;18(10):1122–1134. doi:10.1080/15384101.2019.1609831
 © 2024 The Author(s). This work is published and licensed by Dove Medical Press Limited. The full terms of this license are available at https://www.dovepress.com/terms.php and incorporate the Creative Commons Attribution - Non Commercial (unported, v3.0) License.
By accessing the work you hereby accept the Terms. Non-commercial uses of the work are permitted without any further permission from Dove Medical Press Limited, provided the work is properly attributed. For permission for commercial use of this work, please see paragraphs 4.2 and 5 of our Terms.
© 2024 The Author(s). This work is published and licensed by Dove Medical Press Limited. The full terms of this license are available at https://www.dovepress.com/terms.php and incorporate the Creative Commons Attribution - Non Commercial (unported, v3.0) License.
By accessing the work you hereby accept the Terms. Non-commercial uses of the work are permitted without any further permission from Dove Medical Press Limited, provided the work is properly attributed. For permission for commercial use of this work, please see paragraphs 4.2 and 5 of our Terms.