")
Back to Journals » International Journal of Nephrology and Renovascular Disease » Volume 17
Simplified Creatinine Index as Predictor of Malnutrition in Stage 5 Chronic Kidney Disease Patients on Maintenance Haemodialysis
Authors Bandiara R, Takaryanto D , Andhika R , Makmun A, Supriyadi R, Sukesi L
Received 21 February 2024
Accepted for publication 23 July 2024
Published 29 July 2024 Volume 2024:17 Pages 205—213
DOI https://doi.org/10.2147/IJNRD.S465294
Checked for plagiarism Yes
Review by Single anonymous peer review
Peer reviewer comments 2
Editor who approved publication: Professor Pravin Singhal
Ria Bandiara,1,* Davin Takaryanto,2,* Rizky Andhika,1 Afiatin Makmun,1,* Rudi Supriyadi,1,* Lilik Sukesi1,*
1Division of Nephrology and Hypertension, Department of Internal Medicine, Padjadjaran University/Hasan Sadikin General Hospital, Bandung, West Java, Indonesia; 2Department of Internal Medicine, Padjadjaran University/Hasan Sadikin General Hospital, Bandung, West Java, Indonesia
*These authors contributed equally to this work
Correspondence: Davin Takaryanto, Email [email protected]
Background: Malnutrition inflammation score (MIS) is an instrument for assessing the nutritional status of stage 5 CKD patients, while simplified creatinine index (SCI) is used to assess muscle mass indirectly.
Purpose: This study aims to analyse the correlation between SCI and MIS, as well as determine the SCI cut-off value as a predictor of malnutrition in stage 5 CKD patients on maintenance HD.
Methods: This research was an analytical observational study with a cross-sectional study approach. The 132 research subjects were stage 5 CKD patients at the HD Unit of RSUP Dr. Hasan Sadikin Bandung. The research used the Rank–Spearman test with SPSS for correlative bivariate analysis. The area under the curve (AUC) on the receiver operating characteristic (ROC) curve was analysed to find the SCI cut-off value as a predictor of malnutrition in stage 5 CKD patients.
Results: Sixty-three subjects (47.7%) were classified as good nutrition and 69 subjects (52.3%) as poor nutrition. The average SCI value in this study was 24.5 mg/kg/day ± SD 3.2 mg/kg/day, with a median MIS value was 6. This study showed a significant negative correlation between SCI and MIS (r = − 0.586, p < 0.001). The optimal SCI cut-off from the ROC curve analysis value was ≤ 24.53 mg/kg/day (sensitivity = 76.8%; specificity = 79.4%).
Conclusion: A negative correlation existed between SCI and MIS, with an SCI value ≤ 24.53 indicating poor nutritional status in stage 5 CKD patients on maintenance HD. SCI can be used as a predictor of malnutrition at a lower cost and easier.
Keywords: malnutrition, simplified creatinine index, chronic kidney disease
Introduction
Chronic kidney disease (CKD) is a global health problem with high prevalence and costs and has a poor prognosis.1,2 The Indonesian Renal Registry (IRR) 2020 reported that the number of active patients undergoing hemodialysis (HD) was 130,931 people. Malnutrition Inflammation Atherosclerosis (MIA) is a syndrome caused by inflammation, malnutrition, and atherosclerosis among CKD patients.3–5
Inflammation occurs in CKD and develops as the severity of the disease progresses. The CKD condition does not merely cause the inflammatory process in stage V CKD patients undergoing dialysis therapy but is also aggravated by the dialysis process itself, leading to a protein-energy wasting (PEW) condition.3 The pathogenesis underlying malnutrition in patients with CKD is complex and multifactorial.6,7 The incidence of PEW among patients with stage 5 CKD at Hasan Sadikin Hospital in Bandung is around 14%.8
The simplified creatinine index (SCI) was developed by Canaud et al to assess muscle mass indirectly as a diagnostic criterion for PEW. SCI requires pre-HD serum creatinine and single-pool Kt/V values as parameters that are easy to obtain.9,10 The Kidney Disease Outcomes Quality Initiative (KDOQI) recommends using Subjective Global Assessment (SGA) and MIS as parameters for assessing the nutritional status of stage 5 CKD patients on maintenance HD or post-kidney transplantation.11,12
Several previous studies have shown a negative correlation between SCI and the Geriatric Nutritional Risk Index (GNRI) as an assessment of the nutritional status of CKD patients. Other studies suggest a positive correlation between GNRI and MIS in CKD patients. Previous study used m-NUTRIC (Modified Nutrition Risk in Critically Ill) to calculate the prevalence of nutritional risk in CKD patients based on stage.3,13–16 This study aims to evaluate the correlation between SCI and MIS, as well as to determine the SCI cut-off value as a predictor of malnutrition in stage 5 CKD patients on maintenance HD.
Material and Method
Design and Setting
This was an analytical observational study with a cross-sectional study approached in stage 5 CKD patients on maintenance of HD in the HD Unit of RSUP Dr. Hasan Sadikin Bandung, which will be held in September 2023. The HD scheme as described in Figure 1.
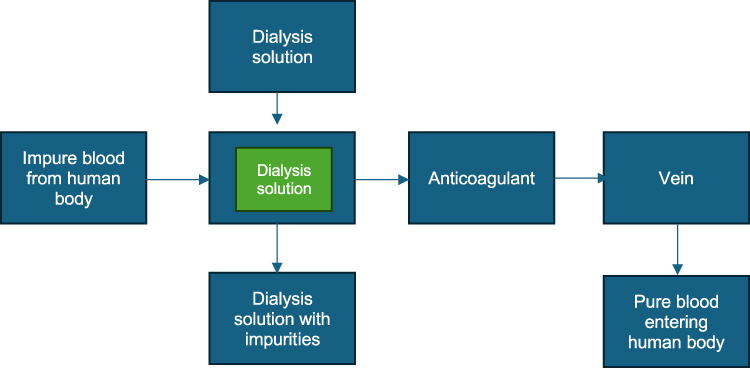 |
Figure 1 Hemodialysis scheme. |
Study Population
Inclusion criteria were determined for subjects diagnosed with stage 5 CKD patients who are older than 18 years old and had undergone routine hemodialysis for at least 3 months with a frequency of twice a week. Researchers excluded subjects with impaired consciousness, infections, malignancies, liver disease, and consumption of drugs that affect muscle mass. One hundred and thirty-two subjects who met the inclusion criteria agreed to fill in the informed consent form. This study was granted permission and ethical approval from the Research Ethics Committee of RSUP Dr. Hasan Sadikin, Bandung.
Data Collection
The demographic and clinical data were obtained from medical records. Body mass index (BMI) was calculated from body weight after HD was divided by body height and presented as a numerical variable. Laboratory examinations were carried out on hemoglobin, pre-HD creatinine, total iron-binding capacity (TIBC), and serum albumin. Single-pool Kt/V HD adequacy was obtained directly from the HD machine used by the subject. SCI was calculated using the formula of Canaud et al: 16.21 + [1.12 x {1 if male; 0 if female}] – [0.06 x age (years)] – [0.08 x single pool (sp)Kt/V urea] + [0.009 x pre-dialysis serum creatinine (µmol/L)].9,10 A questionnaire as described in Figure 2 was used to obtain the MIS, then grouping was carried out to classify subjects into good nutrition (MIS ≤ 5) and poor nutrition (MIS > 5).16
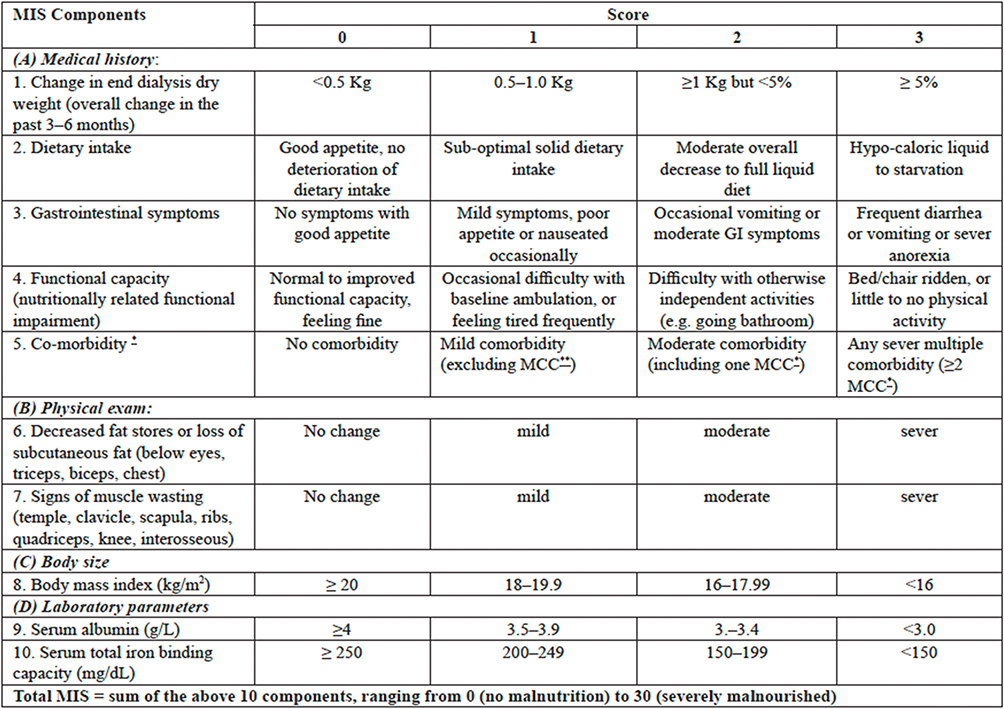 |
Figure 2 MIS questionnaire. *)In the original MIS dialysis treatment age (vintage) contributes to the comorbid condition scoring. 0 if vintage <1 year, 1 if vintage 1–4 years, and at least 2 if vintage >4 years. **) Major co-morbid conditions (MCC) include CHF class III or IV, full blown AIDS, severe coronary artery disease, moderate to severe chronic obstructive pulmonary disease, major neurological sequelae, metastatic malignancy or recent chemotherapy. |
Statistical Analysis
Univariate analysis was carried out to describe the basic characteristics of research subjects. Correlative bivariate analysis using SPSS version 23 software looked at the data distribution using the Kolmogorov–Smirnov normality test, then the Rank–Spearman test was carried out with a P-value <0.05 considered statistically significant.17 The study analyzed the area under curve (AUC) on the receiver operating characteristic (ROC) curve using MedCalc version 15 software to obtain the SCI cutoff value as a marker of malnutrition status for stage 5 CKD patients on maintenance HD.
Results
One hundred and thirty-two subjects underwent maintenance HD at RSUP, Dr. Hasan Sadikin, Bandung met the research eligibility criteria (Figure 3). The average age of the subjects was 47 years, with a standard deviation of ± 12 years. The ratio of male to female subjects was 1:1. The median MIS score in the study was 6, ranging from 2 to 11. 47.7% of the patients had good nutritional status, while 52.3% had poor nutritional status based on the MIS category. The average SCI value of research subjects was 24.5 mg/kg/day, with a standard deviation of ± 3.2 mg/kg/day. Stage 5 CKD patients on maintenance HD patients in this study had varying characteristics, including age, gender, duration of HD, nutritional status, laboratory parameters, and level of HD adequacy (Table 1).
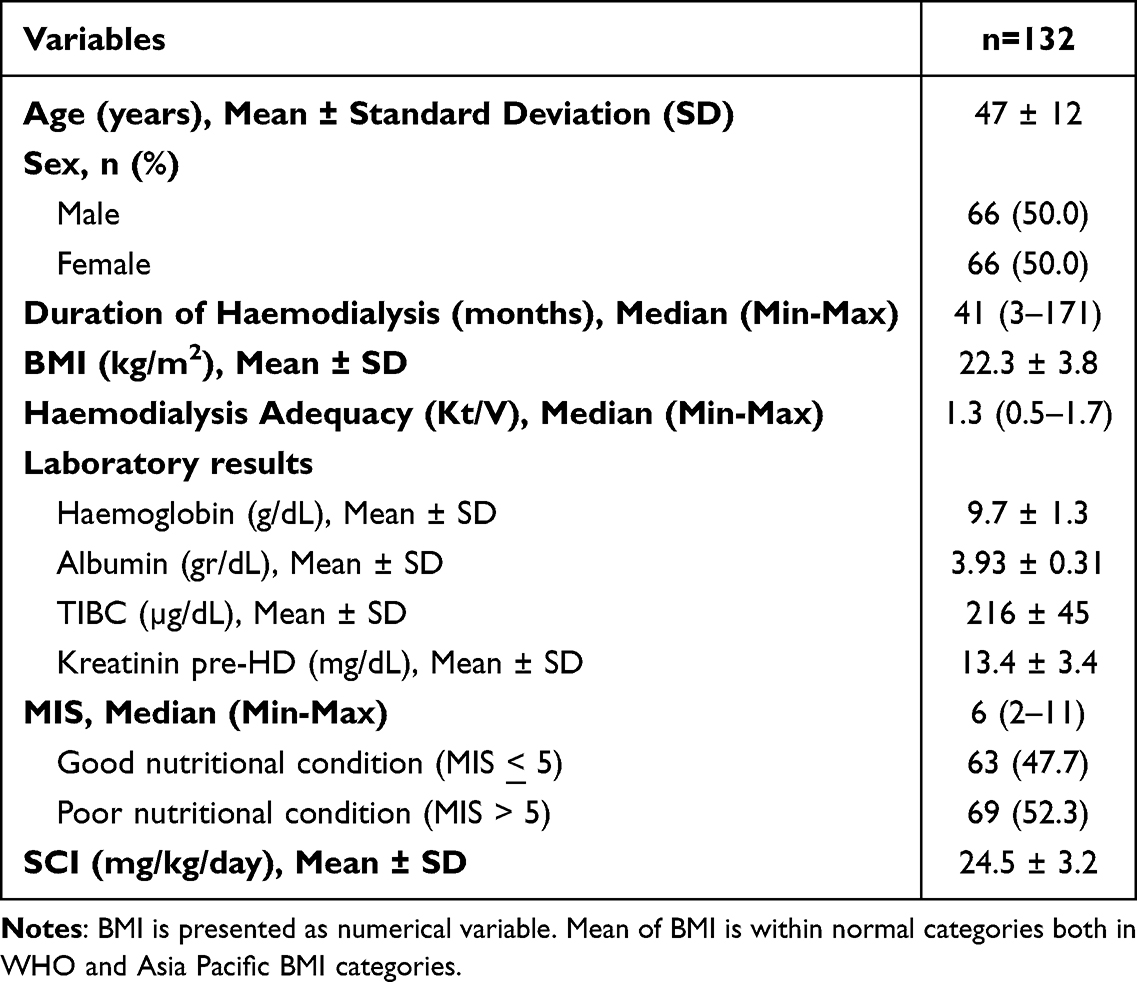 |
Table 1 Baseline Characteristics |
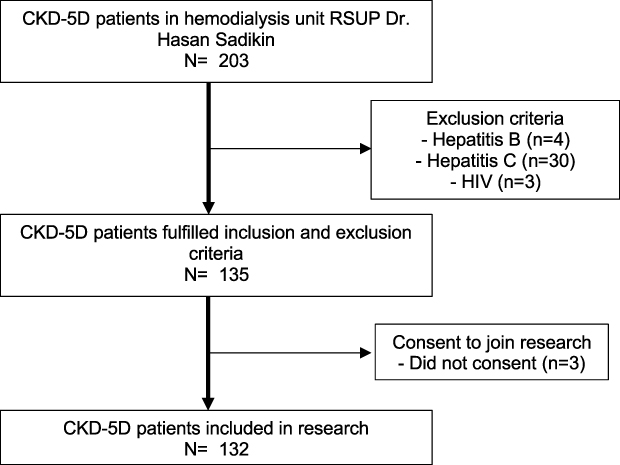 |
Figure 3 Subject selection process. |
Correlational analysis between SCI and MIS in stage 5 CKD patients on maintenance HD were presented in Figure 4A. There was a negative correlation between SCI and MIS with r = −0.586. The coefficient of determination of SCI with MIS in this study was 0.343. The p-value is <0.001, indicating this result was highly statistically significant. Patients with good nutrition had a higher mean IKD (26.31 mg/kg/day ± SD 2.96) compared to patients with poor nutrition (22.85 mg/kg/day ± SD 2.42) as shown in Figure 4B.
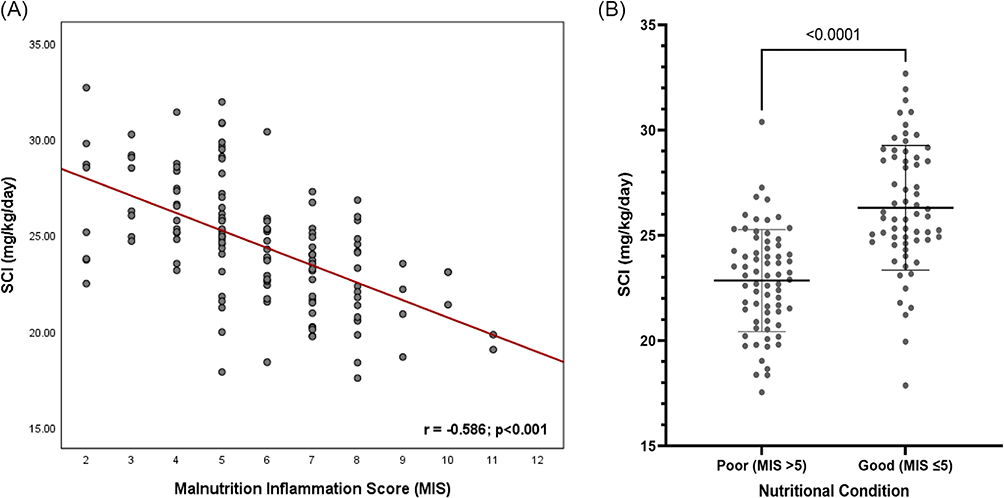 |
Figure 4 (A) Correlations analysis between SCI and MIS in stage 5 CKD patients on maintenance HD; (B) Dot plot SCI Distribution between Good and Poor Nutritional Condition. |
The SCI value of 24.53 mg/kg/day or less (sensitivity = 76.8%; specificity = 79.4%) from the results of ROC curve analysis showed the optimal cut-off value for malnutrition in research subjects (Table 2). The AUC of 0.824 indicated that SCI can determine malnutrition conditions among stage 5 CKD patients on maintenance HD. A higher SCI cut value can be used as a screening for malnutrition with better sensitivity but with lower specificity, while a lower SCI cut value can be used as a diagnostic for malnutrition with higher specificity but lower sensitivity (Figure 5). The study results showed that SCI has the potential as a screening and diagnostic tool to detect malnutrition in stage 5 CKD patients on maintenance HD.
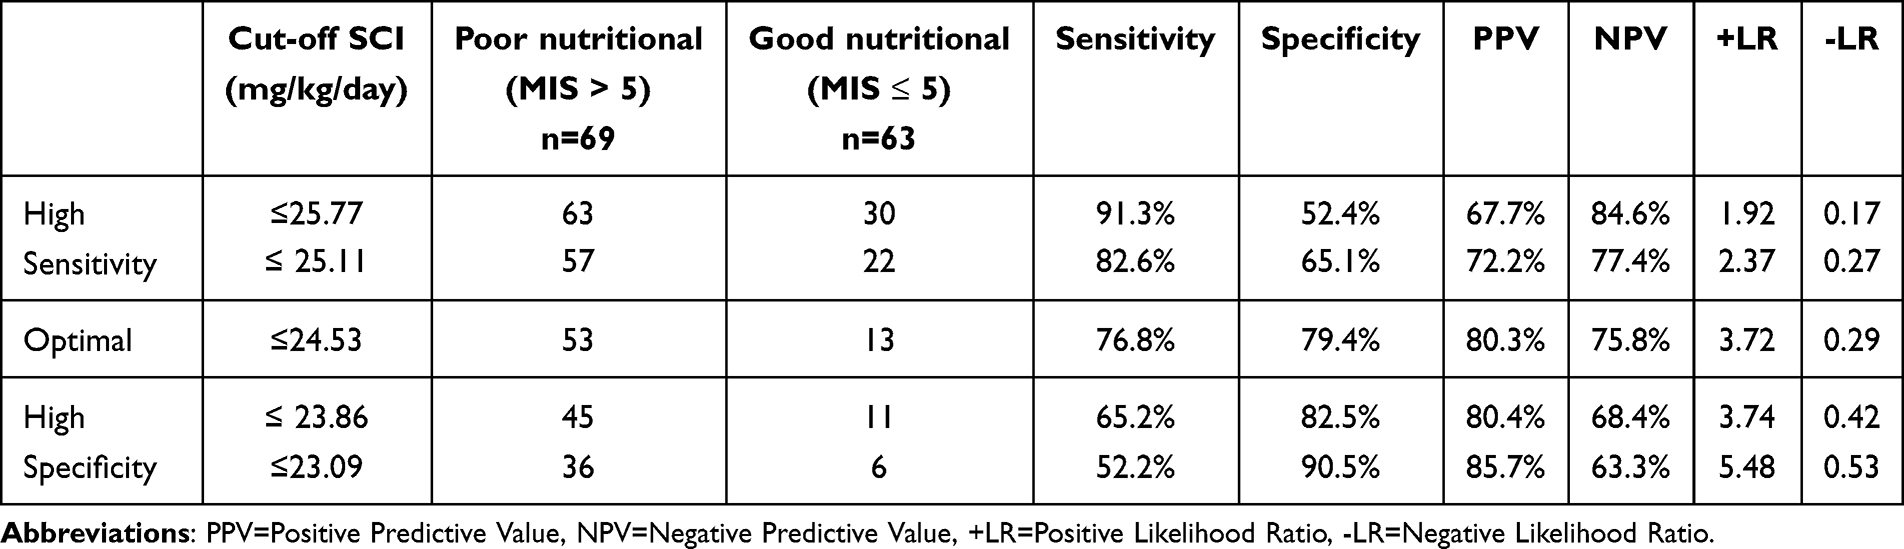 |
Table 2 SCI Cut-off Value as a Predictor of Malnutrition Based on MIS |
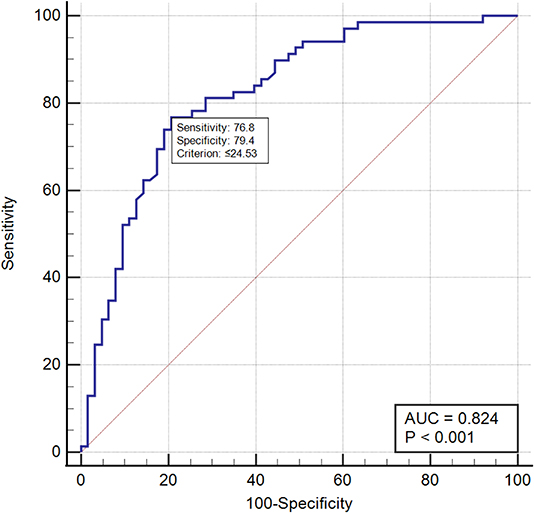 |
Figure 5 Optimal SCI ROC curve as a predictor of Malnutrition. |
Discussion
The statistical analysis concludes that there was a strong negative correlation (r = −0.586) between SCI and MIS, meaning that the highest of MIS, the lowest of SCI. No studies have looked directly at the correlation between SCI and MIS to assess the nutritional status of stage 5 CKD patients on maintenance HD. This research is based on previous research related to SCI and MIS, each of which is used to assess the PEW condition in stage 5 CKD patients.17–19 The optimal SCI cut-off value of ≤ 24.53 mg/kg/day has good sensitivity and specificity in determining the malnutrition condition of stage 5 CKD patients on maintenance HD in this study.
The average age of the subjects in this study was in the second largest age group (45–54 years old) of stage 5 CKD patients according to 2020 IRR data.13 Age is an intrinsic factor that could influence the MIS value in CKD-5D patients, as shown in the research of Rambod et al.14 The median BMI of the subjects in this study falls into the diagnostic criteria for PEW in CKD patients according to International Society of Renal Nutrition and Metabolism (ISRNM) with a BMI of less than 23 kg/m2.15
The subjects of this study belonged to the group of patients with inadequate HD, according to 2020 IRR data.14 Inadequate hemodialysis can cause an increase in complement factors and cytokines, which play a role in increasing the inflammatory process in stage 5 CKD patients on maintenance HD; besides that patients can also experience aggravating metabolic acidosis. Inadequate urea clearance through HD can also reduce appetite and reduce the patient’s nutritional intake.20,21
The average serum albumin level of the subjects in this study was higher than the PEW diagnostic criteria based on ISRNM, with albumin levels <3.8 g/dL. Differences in albumin levels for each subject are not only influenced by daily nutritional intake but the increase in protein catabolism due to the inflammatory process that occurs in stage 5 CKD patients on maintenance HD.20,22 The subjects of this study had low TIBC levels. TIBC levels are one of the assessment components in MIS and its low levels were associated with lower BMI, triceps and biceps skin folds, and arm circumference compared with patients with high serum TIBC levels.23,24
The median score of MIS in this study had the same results as previous study in the same center.25 The proportion of good and poor nutritional conditions in this study is different from other study which showed that MIS > 5 had a greater percentage (86.1%) than good nutrition (13.9%).26 This study has almost the same percentage as Barril et al that revealed the MIS > 5 of 51.7%. That previous study also divided nutritional categories into good nutrition (MIS < 2), mild malnutrition (MIS 3–5), moderate malnutrition (MIS 6–7), severe malnutrition (MIS 8–10), and extreme Malnutrition (MIS > 10).27
The mean SCI value in this study was not different from the average SCI in previous study with the same population of 23.4 mg/kg/day.25 The SCI formula in research by Canaud et al shows that the SCI value will increase as serum creatinine increases before HD.9,28 The mean serum creatinine in this study was higher than the result of study in Japan, which was 11.79 mg/dL.29,30 The mean SCI value of this study was higher than the mean SCI value of the research by Yamada et al (13.84 mg/kg/day) and Canaud et al (21.4 mg/kg/day).30,31
This study was the first study to demonstrate a correlation between SCI and MIS. The Geriatric Nutritional Risk Index (GNRI), SGA, and MIS scoring systems were developed to assess PEW conditions in stage 5 CKD patients. A high MIS value indicates increasingly severe malnutrition, while a high GNRI indicates an increasingly better nutritional status.14,30,32,33 The study in Turkey showed a negative correlation between MIS and GNRI (r = −0.264; p = 0.000).15 The same results were also shown through a previous study which showed a strong negative correlation (r = −0.52; p < 0.001).34 Other previous study showed that SCI positively correlates with GNRI (r = 0.250, p = 0.03).30 The positive correlation between SCI and GNRI was also shown through Tsai et al with r = 0.443.13,18 This study showed a strong negative correlation between SCI and MIS. Previous studies showed positive correlation between SCI and GNRI and negative correlation between MIS and GNRI.34,35
Analysis of this study showed that SCI cut-off values that are greater than the optimal cut-off value had better sensitivity but less specificity, but lower SCI cut-off values had less sensitivity and better specificity as predictor of malnutrition in stage 5 CKD patients on maintenance HD. The results of this study were not much different from previous study which showed that SCI (with a cut-off value <22) was a better predictor of malnutrition in maintenance HD patients than GNRI (cut-off value <100), with a sensitivity and specificity of 80.6% and 76.9%. %, compared to GNRI with sensitivity and specificity of 61.1% and 56.4%.20 Tsai et al showed that the optimal SCI cut-off value for detecting a decrease in fat-free body mass is <20.37 mg/kg/day for men and <18.39 mg/kg/day for women.18
Limitations of this study and the cross-sectional method of this study could not provide an analysis of the cause–effect relationship between the variables MIS and SCI. Nonetheless, the design calculates correlations and inter-variable influences through determinant coefficients. This study included all patients who had not achieved adequate HD, so further research is needed that compares the nutritional status of patients with adequate HD. This study was also done in younger patients and therefore cannot be validated in older patients. Data on history of infections, malignancies, liver disease, and consumption of drugs that affect muscle mass as exclusion criteria were obtained from the results of anamnesis and medical records, and no direct examination was carried out when collecting research data. This study was carried out solely in a single HD unit, even though it had a large number of participants and was representative of stage-5 CKD patients throughout Indonesia. Moreover, this study is the first study revealing a correlation between MIS and SCI among stage-5 CKD patients.
Conclusion
In conclusion, a strong negative correlation exists between SCI and MIS in stage 5 CKD patients on maintenance HD, with the optimal SCI cut-off value of ≤ 24.53 mg/kg/day indicating malnutrition. SCI can be used as a predictor of malnutrition in stage 5 CKD patients on maintenance HD at a lower cost and easier. The earlier the process of assessing nutritional status in CKD patients, the risk of malnutrition also can be stratified earlier. Therefore, earlier nutritional intervention can be carried out to prolong lifetime and improve quality of life. Future research can be done according to the result of the study.
Ethics Approval
This study received approval from the Health Research Ethics Committee of Hasan Sadikin General Hospital (Letter number: LB.02.01/X.6.5/291/2023). Ethical approval for this research complies with the provisions of the Declaration of Helsinki.
Acknowledgment
The authors gratefully acknowledge all staff in HD Unit of Dr. Hasan Sadikin Hospital Bandung for providing assistance in managing the patients. We are grateful to statistical analysts Mr. Evan Susandi for their help in data analysis.
Consent for Publication
The authors declare that this manuscript is original, has not been published before, and is not currently being considered for publication. All authors consent to the publication of this manuscript.
Funding
The authors received no funding for this work.
Disclosure
The authors declare that there is no conflict of interest regarding the publication of this paper.
References
1. Carrero J, Thomas F, Nagy K, Arogundade F, Avesani C, Chan M. Global prevalence of protein-energy wasting in kidney disease: a meta-analysis of contemporary observational studies from the international society of renal nutrition and metabolism. J Ren Nutr. 2018;28(6):380–392. doi:10.1053/j.jrn.2018.08.006
2. United States Renal Data System. USRDS Annual Data Report: epidemiology of Kidney Disease in the United States; 2017.
3. Eleftheriadis T, Antoniadi G, Liakopoulos V, Kartsios C, Stefanidis I. Basic Science and Dialysis: Disturbances of Acquired Immunity in Hemodialysis Patients. Wiley online library; 2007.
4. Kopple J, Greene T, Chumlea W, Hollinger D, Maroni B, Merril D. Relationship between nutritional status and the glomerular filtration rate: results from the MDRD study. Kidney Int. 2000;57(4):1688–1703. doi:10.1046/j.1523-1755.2000.00014.x
5. Stenvinkel P, Heimburger O, Lindholm B, Kaysen G, Bergstrom J. re there two types of malnutrition in chronic renal failure? Evidence for relationships between malnutrition, inflammation and atherosclerosis (MIA syndrome). Nephrol Dial Transplant. 2000;15(7):953–960.
6. Iorember F. Malnutrition in chronic kidney disease. Front Pediatr. 2018;6:161. doi:10.3389/fped.2018.00161
7. Grateror Torres F, Molina M, Soler-Majoral J, Romero-Gonzalez G, Rodriguez Chitiva N, Troya-Saborido M. Evolving concepts on inflammatory biomarkers and malnutrition in chronic kidney disease. Nutrients. 2022;14(20):4297. doi:10.3390/nu14204297
8. Indrasari A. Pengaruh Malnutrition Inflammation Score terhadap Interferon Gamma Release Assay sebagai penanda tuberkulosis laten pada hemodialisis rutin. Karya Tulis Akhir Program pendidikan dokter spesialis penyakit dalam konsultan II Departemen ilmu penyakit dalam fakultas kedokteran Universitas Padjadjaran, Bandung; 2020.
9. Canaud B. Simplified creatinine index as a new tool for monitoring protein energy malnutrition and predict outcome risk in hemodialysis patients: recent findings and perspectives. J Nephrol Renal Ther. 2021;35(7):50.
10. Terrier N, Jaussent I, Dupuy AM, Morena M, Delcourt C, Chalabi L. Creatinine index and transthyretin as additive predictors of mortality in haemodialysis patients. Nephrol Dial Transplant. 2007;23(1):345–353. doi:10.1093/ndt/gfm573
11. Ikizler T, Burrowes J, Byham-Gray L, Campbell K, Carreri J, Chan W. KDOQI clinical practice guideline for nutrition in CKD: 2020 update. Am J Kidney Dis. 2020;76(3):S1–S107. doi:10.1053/j.ajkd.2020.05.006
12. Holmes R Comparing nutrition status of in-centre nocturnal hemodialysis patients to conventional hemodialysis patients: A prospective cohort study; 2017.
13. Perhimpunan Nefrologi Indonesia. 14th Annual Report of Indonesian Renal Registry; 2020.
14. Wang W, Liang S, Zhu F, Liu J, Chen X, Cai G. Association of the malnutrition-inflammation score with anthropometry and body composition measurements in patients with chronic kidney disease. Ann Palliat Med. 2019;8(5):596–603. doi:10.21037/apm.2019.10.12
15. Fouque D, Kalantar-Zadeh K, Kopple J, Cano N, Chauveau P, Cuppari L. A proposed nomenclature and diagnostic criteria for protein–energy wasting in acute and chronic kidney disease. Kidney Int. 2018;73(4):391–398. doi:10.1038/sj.ki.5002585
16. Verma P, Kumar S, Phate N, et al. Modified Nutrition Risk in Critically Ill (m-NUTRIC) score to assess nutritional status and outcome in patients of chronic kidney disease: 2-year cross-sectional study. Int J Nutr Pharmacol Neurol Dis. 2023;13(3):152–157. doi:10.4103/ijnpnd.ijnpnd_9_23
17. Kalantas-Zadeh K, Ikizler T, Block G, Avram M, Kopple J. Malnutrition-inflammation complex syndrome in dialysis patients: causes and consequences. AmJ Kidney. 2003;42(5):864–881. doi:10.1016/j.ajkd.2003.07.016
18. Tsai M, Tseng W, Ou S, Lee K, Yang C, Tarng D. Comparison of simplified creatinine index and systemic inflammatory markers for nutritional evaluation of hemodialysis patients. Nutrients. 2021;13(6):1870. doi:10.3390/nu13061870
19. Hwang W, Cho M, Oh J, Lee J, Jeong J, Shin G. Comparison of creatinine index and geriatric nutritional risk index for nutritional evaluation of patients with hemodialysis. Hemodialysis Int. 2018;22(4):507–514. doi:10.1111/hdi.12674
20. Sahathevan S, Khor B, Ng H, Abdul Gafor A, Mat Daud Z, Mafra D. Understanding development of malnutrition in hemodialysis patients: a narrative review. Nutrients. 2020;12(10):3147. doi:10.3390/nu12103147
21. Chung S, Koh E, Shin S, Park C. Malnutrition in patients with chronic kidney disease. Open J Inter Med. 2012;2(02):89–99. doi:10.4236/ojim.2012.22018
22. Zha Y, Qian Q. Protein nutrition and malnutrition in CKD and ESRD. Nutrients. 2017;9(3):208. doi:10.3390/nu9030208
23. Gaweda A. Markers of iron status in chronic kidney disease. Hemodialysis Int. 2017;21:S21–S27. doi:10.1111/hdi.12556
24. Brooks D. Handbook of Dialysis. Nephrol Nurs J. 2015;42.
25. Mulyo L, Bandiara R, Supriyadi R Hubungan indeks kreatinin yang disederhanakan dengan massa tubuh bebas lemak dan kualitas hidup pasien penyakit ginjal kronik stadium 5 dalam terapi dialisis (PGK5D). Karya Tulis Akhir Program pendidikan dokter spesialis penyakit dalam Departemen ilmu penyakit dalam fakultas kedokteran Universitas Padjadjaran, Bandung; 2022.
26. Bandiara R, Suksesi L, Indrasari A, Rakhimullah A, Afiatin A, Santoso P. Association between Malnutrition Inflammation Score and Latent Tuberculosis among Chronic Hemodialysis Patients. Intl J Integr Health Scie. 2021;9(1):19–24. doi:10.15850/ijihs.v9n1.2370
27. Barril G, Nogueira A, Cigarran S, La Torre J, Sanchez R, de Santos A. Differences in malnutrition inflammation score of hemodialysis patients associated with hemodialysis factors. A Spanish multicenter epidemiologic study. J Ren Nutr. 2023;33(1):140–146. doi:10.1053/j.jrn.2022.03.006
28. Canaud B, Ye X, Usvyat L, Kooman J, van Der Sande F, Raimann J. Clinical and predictive value of simplified creatinine index used as muscle mass surrogate in end-stage kidney disease haemodialysis patients—results from the international Monitoring Dialysis Outcome initiative. Nephrol Dial Transplant. 2020;35(12):2161–2171. doi:10.1093/ndt/gfaa098
29. Canaud B, Granger Vallee A, Molinari N, Chenine L, Leray-Moragues H, Rodriguez A. Creatinine index as a surrogate of lean body mass derived from urea Kt/V, pre-dialysis serum levels and anthropometric characteristics of haemodialysis patients. PlosOne. 2014;9(3):e93286. doi:10.1371/journal.pone.0093286
30. Yamada K, Furuya R, Takita T, Maruyama Y, Yamaguchi Y, Ohkaea S. Simplified nutritional screening tools for patients on maintenance hemodialysis. Am J Clin Nutr. 2008;87(1):106–113. doi:10.1093/ajcn/87.1.106
31. Canaud B, Garred L, Argiles A, Flavier J, Bouloux C, Mion C. Creatinine kinetic modelling: a simple and reliable tool for the assessment of protein nutritional status in haemodialysis patients. Nephrol Dial Transplant. 1995;10(8):1405–1410.
32. Borges M, Vogt B, Martin L, Caramori J. Malnutrition Inflammation Score cut-off predicting mortality in maintenance hemodialysis patients. Clin Nutr ESPEN. 2017;58(4):775–782.
33. Hino H, Saito T, Matsui H, Taniguchi Y, Murakawa T. Utility of Geriatric Nutritional Risk Index in patients with lung cancer undergoing surgery. Eur J Cardiothorac Surg. 2020;58(4):775–782. doi:10.1093/ejcts/ezaa066
34. Beberashvili I, Azar A, Sinuani I, Kadoshi H, Shapiro G, Feldman L. Comparison analysis of nutritional scores for serial monitoring of nutritional status in hemodialysis patients. Clinical J Amer Soci Neph. 2013;8(3):443. doi:10.2215/CJN.04980512
35. Pembegul I, Yakaryilmaz F. Evaluation of the efficacy of using gnri and mis as a predictor of mortality in elderly hemodialysis patients. Niger J Clin Pract. 2023;26(2):240. doi:10.4103/njcp.njcp_672_22
 © 2024 The Author(s). This work is published and licensed by Dove Medical Press Limited. The
full terms of this license are available at https://www.dovepress.com/terms.php
and incorporate the Creative Commons Attribution
- Non Commercial (unported, v3.0) License.
By accessing the work you hereby accept the Terms. Non-commercial uses of the work are permitted
without any further permission from Dove Medical Press Limited, provided the work is properly
attributed. For permission for commercial use of this work, please see paragraphs 4.2 and 5 of our Terms.
© 2024 The Author(s). This work is published and licensed by Dove Medical Press Limited. The
full terms of this license are available at https://www.dovepress.com/terms.php
and incorporate the Creative Commons Attribution
- Non Commercial (unported, v3.0) License.
By accessing the work you hereby accept the Terms. Non-commercial uses of the work are permitted
without any further permission from Dove Medical Press Limited, provided the work is properly
attributed. For permission for commercial use of this work, please see paragraphs 4.2 and 5 of our Terms.