")
Back to Journals » Journal of Inflammation Research » Volume 17
Single-Cell RNA Sequencing Reveals a Unique Fibroblastic Subset and Immune Disorder in Lichen Sclerosus Urethral Stricture
Authors Zhang W, Zhang J, Jiao D, Tang Q, Gao X, Li Z, Yang F, Zhao Z, Yang L
Received 28 February 2024
Accepted for publication 2 August 2024
Published 13 August 2024 Volume 2024:17 Pages 5327—5346
DOI https://doi.org/10.2147/JIR.S466317
Checked for plagiarism Yes
Review by Single anonymous peer review
Peer reviewer comments 2
Editor who approved publication: Professor Ning Quan
Wei Zhang,1,* Jiayu Zhang,2,* Dian Jiao,1,* Qisheng Tang,1 Xiaoping Gao,1 Zhenyu Li,1 Fa Yang,3 Zhiguang Zhao,1 Longfei Yang4
1Department of Urology, Tangdu Hospital, Fourth Military Medical University, Xi’an, Shaanxi, 710038, People’s Republic of China; 2Department of Urology, Air Force Hospital of Southern Theater Command, Guangzhou, Guangdong, 510062, People’s Republic of China; 3Department of Urology, Xijing Hospital, Fourth Military Medical University, Xi’an, Shaanxi, 710032, People’s Republic of China; 4Department of Transfusion Medicine, Tangdu Hospital, Fourth Military Medical University, Xi’an, Shaanxi, 710038, People’s Republic of China
*These authors contributed equally to this work
Correspondence: Longfei Yang; Zhiguang Zhao, Email [email protected]; [email protected]
Purpose: Lichen sclerosus urethral stricture disease (LS USD) is a refractory and progressive disease primarily affecting the anterior urethra in males. Various potential etiological factors, such as genetics, autoimmunity, infection, and exposure to infectious urine, have been suggested. However, the accurate etiology of LS in the male urethra remains unclear.
Patients and Methods: In this study, we conducted single-cell RNA sequencing to identify the transcriptional profiles of three patients with LS USD and three patients with non-LS USD. Immunofluorescence was used to confirm the single-cell sequence results.
Results: Our study revealed distinct subsets of vein endothelial cells (ECs), smooth muscle cells (SMCs), and fibroblasts (FBs) with high proportions in LS USD, contributing to the tissue microenvironment primarily involved in proinflammatory and immune responses. In particular, FBs displayed a unique subset, Fib7, which is exclusively present in LS USD, and exhibited high expression levels of SAA1 and SAA2. The accumulation of macrophages, along with the dysregulated ratios of M1/M2-like phenotype macrophages, may be engaged in the pathogenesis of LS USD. Through cell–cell communication analysis, we identified significant interactions involving CXCL8/ACKR1 and CCR7/CCL19 in LS USD. Remarkably, Fib7 exhibited exclusive communication with IL-1B macrophages through the SAA1/FPR2 receptor–ligand pair.
Conclusion: Our study provides a profound understanding of the tissue microenvironment in LS USD, which may be valuable for understanding the pathogenesis of LS USD.
Keywords: lichen sclerosus, urethral stricture disease, single-cell RNA sequencing, heterogeneity, fibroblasts, macrophages
Graphical Abstract:

Introduction
Lichen sclerosus (LS) is a chronic inflammatory skin disease predominantly affecting the anogenital skin in both sexes.1 This disease was first described by Weir in 1875.2 Although the term balanitis xerotica obliterans (BXO) was proposed by Stühmerd in 1928, the International Society for the Study of Vulvar Disease recommended the use of the term LS in men instead of BXO.3 In males, penile LS can lead to phimosis, dyspareunia, and urethral strictures caused by scarring lesions in the prepuce, coronal sulcus, and glans penis. It can even increase the risk of developing penile squamous cell carcinoma, although the causal relationship remains to be determined.4 Urethral stricture disease (USD) is a common complication of LS, accounting for up to 15% of cases, with panurethral strictures being the most prevalent subtype (48.6%).5 Although intraurethral steroids with self-calibration have shown efficacy in some patients, urethroplasty is often necessary. However, the high risk of recurrence and the need for multistage repairs are major challenges for this disease. Perineal urethrostomy (PU) is considered the last resort for serious cases.6 Despite various proposed etiological factors over the last decade, such as genetics, autoimmunity, infection, and exposure to infectious urine, the accurate etiology of LS in men remains unclear.7 Considering the clinical heterogeneity and high postoperative failure rate in LS USD, understanding the characteristics of the disease is crucial. However, to date, studies focusing on LS USD are limited.8
In recent years, single-cell RNA sequencing (scRNA-seq) has emerged as a powerful tool for revealing the diversity of cell states and heterogeneity within cell populations.9 Analyzing the transcriptome of individual cells allows us to comprehend complex cellular interactions and obtain comprehensive insights into diseases in biological systems.10 Thus, we performed scRNA-seq to identify the transcriptional profiles of a single cell in tissues affected by LS USD and non-LS USD. By constructing a cell atlas of LS USD and shedding light on the complexity of the tissue microenvironment, we aimed to uncover characteristics specific to LS USD. Employing established cell markers, we identified nine cell types in LS USD and non-LS USD tissues. Through evaluation of cell composition and gene expression for each group, our study unveiled aberrant numbers and functions of cell subsets and highlighted the intricate crosstalk among cellular components potentially contributing to the pathogenesis of LS USD. These findings provide insights into potential therapeutic strategies for managing LS USD.
Materials and Methods
Sample Collection and Processing
The experimental materials were human urethral stricture tissues removed from three patients with LS USD and non-LS USD in Tangdu Hospital (Shaanxi, China). The specimen was taken from the middle position of urethral stricture. Clinical characteristics of these patients are shown in Table 1. This research was approved by the Clinical Ethics Committee of Tangdu Hospital, Fourth Military Medical University (K202301-04). The procedures used in this study adhere to the tenets of the Declaration of Helsinki. Fresh tissues were stored in sCelLive Tissue Preservation Solution (Singleron) on ice within 30 min after surgery. The specimens were washed with Hanks’ Balanced Salt Solution three times, minced into small pieces, and digested with 3 mL of sCelLive Tissue Dissociation Solution (Singleron) by using the Singleron PythoN Tissue Dissociation System at 37 °C for 15 min. The cell suspension was collected and filtered through a 40-micron sterile strainer. The GEXSCOPE red blood cell lysis buffer (RCLB, Singleron) was added, and the mixture (cell: RCLB = 1:2 [volume ratio]) was incubated at room temperature for 5–8 min to remove red blood cells. Then, the mixture was centrifuged at 300 ×g and 4 °C for 5 min to remove the supernatant and suspended softly in PBS. Finally, the samples were stained with trypan blue, and the cell viability was evaluated microscopically.
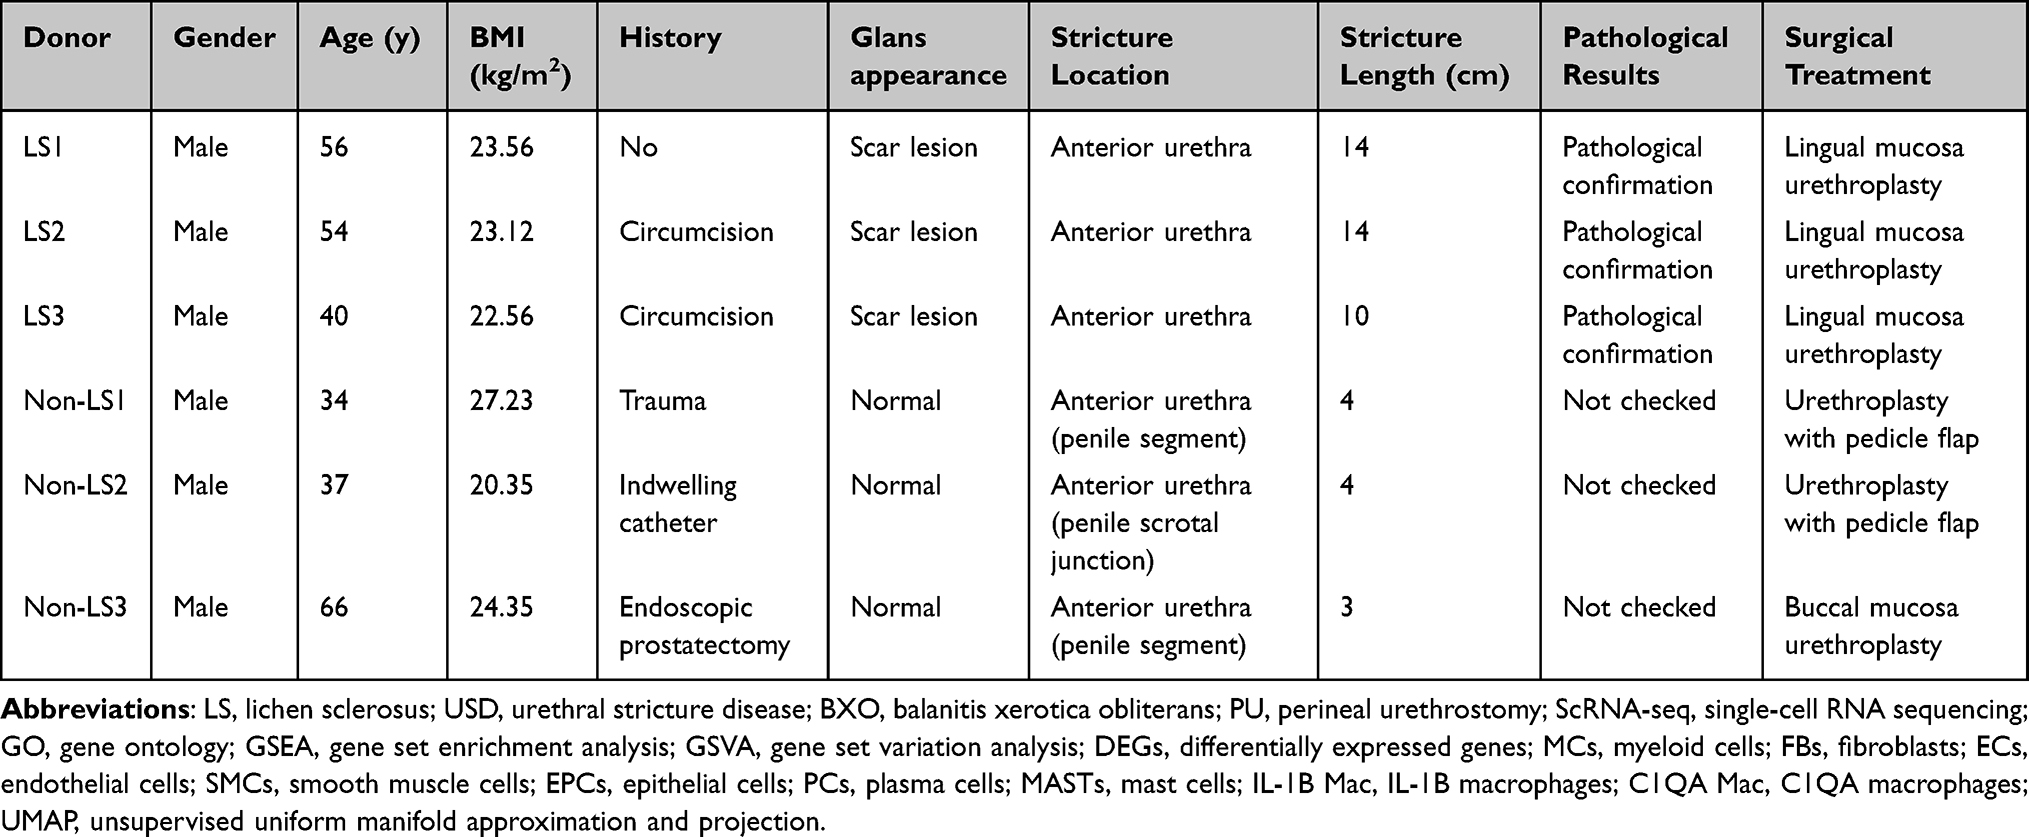 |
Table 1 Clinical Data of Single-Cell Sequencing Samples of LS USD and Non-LS USD |
RT-PCR Amplification and Library Construction
Single-cell suspensions (2 × 10⁵ cells/mL) with PBS (HyClone) were loaded onto a microwell chip using the Singleron Matrix Single Cell Processing System. Barcoding beads were collected from the microwell chip, followed by reverse transcription of the mRNA captured by the barcoding beads to obtain cDNA and PCR amplification. Then, the amplified cDNA was fragmented and ligated with sequencing adapters. The scRNA-seq libraries were constructed in accordance with the protocol of the GEXSCOPE Single-cell RNA Library Kits (Singleron).11 Individual libraries were diluted to 4 nM, pooled, and sequenced on the Illumina NovaSeq 6000 with 150 bp paired-end reads.
Primary Analysis and Identification of Cell Types
Raw reads were processed to generate gene expression matrixes using an internal pipeline. First, raw reads were processed with cutadapt12 to trim poly-A tail and adapter sequences after low-quality reads were removed. The cell barcode and UMI were extracted, and STAR13 v2.5.3a was used to map reads to the reference genome GRCh38 (ensemble version 92 gene annotation). Finally, featureCounts14 v1.6.2 was used to form UMI counts and gene counts of each cell, and expression matrix files were generated for further analysis. The data were subsequently analyzed using the Seurat package (version 3.1.2)15,16 of R (version 3.5.1). Cells were filtered by UMI counts below 30,000 and gene counts between 200 and 5000. Cells with over 50% mitochondrial content were then removed. We used the NormalizeData and ScaleData functions to normalize and scale all gene expression levels, and we selected the top 2000 variable genes with the FindVariableFeatures function for PCA. Using the top 20 principal components, we separated cells into multiple clusters with FindClusters. The batch effect among samples was removed by Harmony.17 Finally, the UMAP algorithm was applied to visualize cells. Based on published research, each cluster was annotated on the basis of the marker genes discovered by the FindAllMarkers function. Marker genes for clusters of the first clustered cells are shown as follows: myeloid cells (MCs; Lyz, Mrc1, Cd68, Cd163, and Fcer1a), endothelial cells (ECs; Cdh5, Pecam1, and Vmf), fibroblasts (FBs; Dcn, Col1a2, and Col1a1), smooth muscle cells (SMCs; Acta2, Tagln, and Mylk), plasma cells (PCs; Cd79a, Jchain, Mzb1, and Ighg1), epithelial cells (EPCs; Krt5, krt15, krt14, krt17, and krt13), T cells (TCs; Cd2, Cd3d, Trac, and Trbc1), B cells (BCs; Ms4a1, Cd79a, and Cd79b), and mast cells (MASTs; Tpsab1, Tpsb2, and Cpa3).
Differentially Expressed Genes (DEGs) Analysis
Genes expressed in more than 10% of the cells in a cluster and with an average log (fold change) of more than 0.25 were selected as DEGs by Seurat FindMarkers based on the Wilcox likelihood-ratio test with default parameters.
Pathway Enrichment Analysis
Gene ontology (GO) and Kyoto Encyclopedia of Genes and Genome (KEGG) analyses were used with the “clusterProfiler” package v3.16.1.18 Gene set enrichment analysis (GSEA) was also conducted using the GSEA toolkit.19 Normalized enrichment scores were acquired using 1000 gene set permutations, and a cutoff P value of 0.05 was used to filter significant enrichment results. Gene set variation analysis (GSVA) converted the expression matrix into a path enrichment score matrix, and the different pathways were then obtained through lmFit analysis using the limma package.
Pseudotime Trajectory Analysis
The cell lineage trajectory of subsets was inferred using Monocle2 (v2.22.0).20 In constructing the trajectory, the top 2000 highly variable genes were selected by using Seurat FindVariableFeatures, and dimensionality reduction was performed by DDRTree. The trajectory was visualized by using the plot_cell_trajectory function in Monocle2.
Cell-Cell Interaction Analysis
Cell-cell interactions between different cell types were predicted on the basis of known ligand‒receptor (LR) pairs by using the CellphoneDB package (v2.1.7).21 The permutation number for calculating the null distribution of average LR pair expression in randomized cell identities was set to 1000 times. Individual ligand or receptor expression was set by a cutoff based on the average log gene expression distribution for all genes across each cell type. Significant cell–cell interactions were defined as P < 0.05.
Transcription Factor (TF) Regulatory Network Analysis (pySCENIC)
The TF network was constructed by pySCENIC (v0.11.0)22 using the scRNA expression matrix and TFs in AnimalTFDB. First, GRNBoost2 predicted a regulatory network based on the coexpression of regulators and targets. Then, CisTarget was applied to exclude indirect targets and search TF-binding motifs. Subsequently, AUCell was used for regulon activity quantification for every cell. Cluster-specific TF regulons were identified in accordance with Regulon Specificity Scores, and the activity of these TF regulons was visualized in heatmaps.
Hematoxylin-Eosin (HE) and Immunofluorescence (IF) Staining
Tissues were typically fixed in 10% neutral-buffered formalin solution and dehydrated in gradient ethanol and xylene before they were infiltrated in paraffin to form paraffin-embedded blocks. Tissue sections were then cut from the blocks at 3–5 μm thickness and subjected to HE staining. For IF staining, tissues on slides were blocked in 5% (v/v) normal goat serum in PBS and then incubated with a primary antibody (CD86, 1:100; CD206,1:100; SAA1, 1:200; PDGFR-α,1:100) diluted in PBS with 5% goat serum overnight at 4 °C. Thereafter, the tissues were incubated with a fluorophore-conjugated secondary antibody diluted in PBS with 5% goat serum for 60 min at room temperature. DAPI was also added at a concentration of 1 μg/mL to visualize nucleic acids in each cell. Photographs were taken using a fluorescence microscope (Olympus, Tokyo, Japan) in a dark room.
Statistical Analysis
All statistical analyses were performed using R (v3.5.1). Comparisons of gene expression between two groups of cells were performed using unpaired two-tailed Wilcoxon rank-sum tests. SPSS 22.0 was used for Student’s t test. Ρ ≤ 0.05 was considered statistically significant. Immunofluorescence staining was confirmed in at least three biological replicates with consistent results.
Results
Characteristics of the Overall Cell Types in USD by scRNA-Seq
Single-cell transcriptome analysis was performed on the urethral stricture tissue in three patients with LS USD and non-LS USD (Figure 1A). Apart from the patient’s report of urination difficulties, the clinical diagnosis of LS USD was based on physical exam findings, Including white skin changes on the glans, meatus, fusion of glans to foreskin, and/or LS urethral changes such as stippled or pan-urethral disease on retrograde urethrography. Histological and morphological changes were confirmed by hematoxylin and eosin staining, which showed a classical pathognomonic appearance for LS, such as deep band-like infiltrate of mononuclear inflammatory cells, hyperkeratosis, epidermal atrophy, sclerosus, and hyalinization (Figure 1B).23 Information on these individuals’ clinical characteristics is shown in Table 1. After quality control and filtration, 16,937 cells were collected for further analysis (Table S1). Using the unsupervised uniform manifold approximation and projection (UMAP) technique, we clustered the detected cells into nine major clusters (Figure 1C and D). Based on the marker genes expressed in various cells, we isolated MCs (CD163 and LYZ), FBs (COL1A1 and DCN), ECs (PECAM1 and VWF), SMCs (ACTA2 and TAGLN), EPCs (KRT6A and KRT13), PCs (IGHG2 and IGKC), TCs (CD3E and CD3D), BCs (PTPRC and MS4A1), and MASTs (CPA3 and KIT) (Figure 1E, Table S2, Figure S1A and B). The results indicated significant differences in MCs, FBs, ECs, EPCs, and SMCs between LS USD and non-LS USD with regard to the proportion of these cell clusters. Globally, the proportion of EPCs, MCs, and SMCs increased in LS USD. Conversely, the proportion of ECs and FBs in LS USD decreased (Figure 1F, Figure S1C). Thus, these results showed significant cell population deviation between the two diseases, indicating that the different cell types in LS USD might be attributed to the pathological features of LS USD. Thus, the cell-specific function in LS USD must be further explored. Although PCs, TCs, BCs, and MASTs had different proportions between the two disease samples, the isolated cells were few for in-depth analysis. Subsequently, we investigated the molecular features of different cell types (Figure 1G). Among them, GSVA of the hallmark pathways revealed that MCs had a higher enrichment score for inflammatory response. Moreover, the upregulated Kras signaling, inflammatory response, and TNFα signaling via the NF-kB and interferon gamma response pathways indicated that MCs promoted the development of local inflammation, which was consistent with the histological results of inflammatory cell infiltration in LS USD.
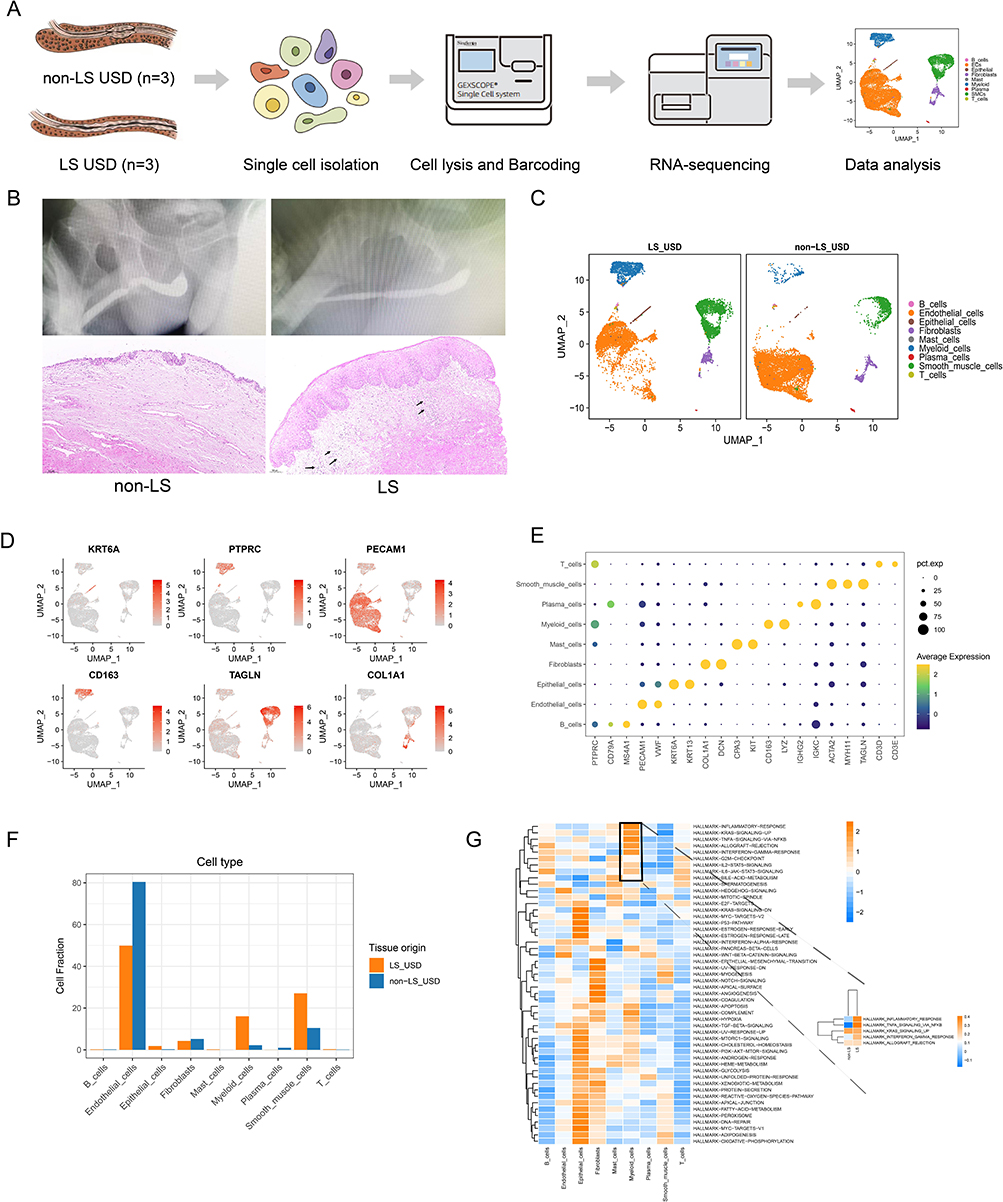 |
Figure 1 scRNA-seq reveals the cellular diversity of urethral stricture tissue in LS and non-LS patients. (A) Experimental workflow overview: urethral stricture tissues were individually collected during surgical procedures (n=3 for each group). (B) Urethrography and representative H&E staining of urethral stricture disease in LS and non-LS. (C) Uniform manifold approximation and projection (UMAP) of unbiased clustering of 16,937 cells reveals nine distinct cellular clusters. Clusters are distinguished by different colors. (D) UMAP plot showing the expression of canonical genes of each cell type in urethral stricture tissues. (E) Bubble heatmap displaying the expression levels of marker genes across clusters. The x-axis represents normalized gene expression. The bubble size corresponds to the percentage of cells expressing the gene, while the intensity of color signifies the gene expression level. (F) Comparison of the ratio of each cell type in LS USD and non-LS USD tissues. (G) Activation of hallmark pathways (scored per cell by GSVA) in nine cell types. |
EC Subsets in LS USD were Involved in the Immune Response by Engaging and Responding to Inflammatory Cell infiltration into tissues
Given the highest number of EC separations, a total of 11,091 ECs were reclustered, and five distinct subsets were illustrated for further analysis (Figure 2A). Proportionally, vein ECs were the main subsets in both samples, which contained three cell subsets, namely, vein EC1, vein EC2, and vein EC3. Although the number of ECs decreased in LS USD, vein EC1 and vein EC3 showed a relatively high proportion in LS USD (Figure 2C). As shown in Figure 2B, the encoded genes of vein EC1 were associated with triggered leukocyte adhesion and transmigration, angiogenesis, chemokines, and antigen-presenting molecules, such as ACKR1, EFEMP1, CCL2, and HLA-DRA. Vein EC3 was related to the regulation of the cell cycle phase, nuclear division, and organelle fission, such as TOP2A, STMN1, and CENPF. Conversely, vein EC2 exhibited a high proportion in non-LS USD, which was related to mitochondrial DNA, cell cycle regulation, and potent angiogenic factors, such as MT-RNR1, MT-RNR2, CCNL2, and EGFL7. Subsequent GO analysis also showed enriched pathways related to neutrophil-mediated immunity, neutrophil degranulation, and neutrophil activation in vein EC1. In contrast, vein EC3 enriched pathways related to the regulation of chromosome segregation, mitotic sister chromatid segregation, and mitotic nuclear division (Figure 2D, Figure S2A–C). Collectively, vein EC1 and vein EC3 may play an important role in the immune response, cell proliferation, and cell migration. Furthermore, we explored the DEGs of vein ECs in the pathogenesis of LS USD. Vein EC1 and vein EC3 expressed high levels of atypical chemokine receptor (ACKR1) and adhesion molecules (SELE, SELP, and ICAM1). In particular, vein EC1 expressed high levels of chemokines (CCL2) and inflammatory molecules (IL33 and IL1R1) (Figure 2E). During LS USD, ACKR1, SELE, SELP, and ICAM1 were highly expressed in vein ECs, whereas CCL2 and CXCL8 were highly expressed in vein EC1 (Figure 2F). Based on previous reports, ACKR1 can regulate the activity of chemokines, including CCL2 and CXCL8, by translocating them across the endothelial barrier after binding to them, which facilitates immobilization and presentation to leukocytes, thereby promoting their extravasation.24,25 IL33 and IL1R1 belong to the IL-1 family and play diverse roles in mediating innate and adaptive immune responses.26 We also compared the DEGs of vein EC1 and vein EC3 between LS USD and non-LS USD. As shown in Figure 2G, vein EC1 and vein EC3 highly expressed genes encoding antigen-presenting molecules and immune response molecules such as HLA-DRB5, CSF3, and C1R. Therefore, we hypothesized that vein EC1 and vein EC3 primarily participate in LS USD pathogenesis by activating inflammatory cells and assisting in their transport into the urethral stroma.
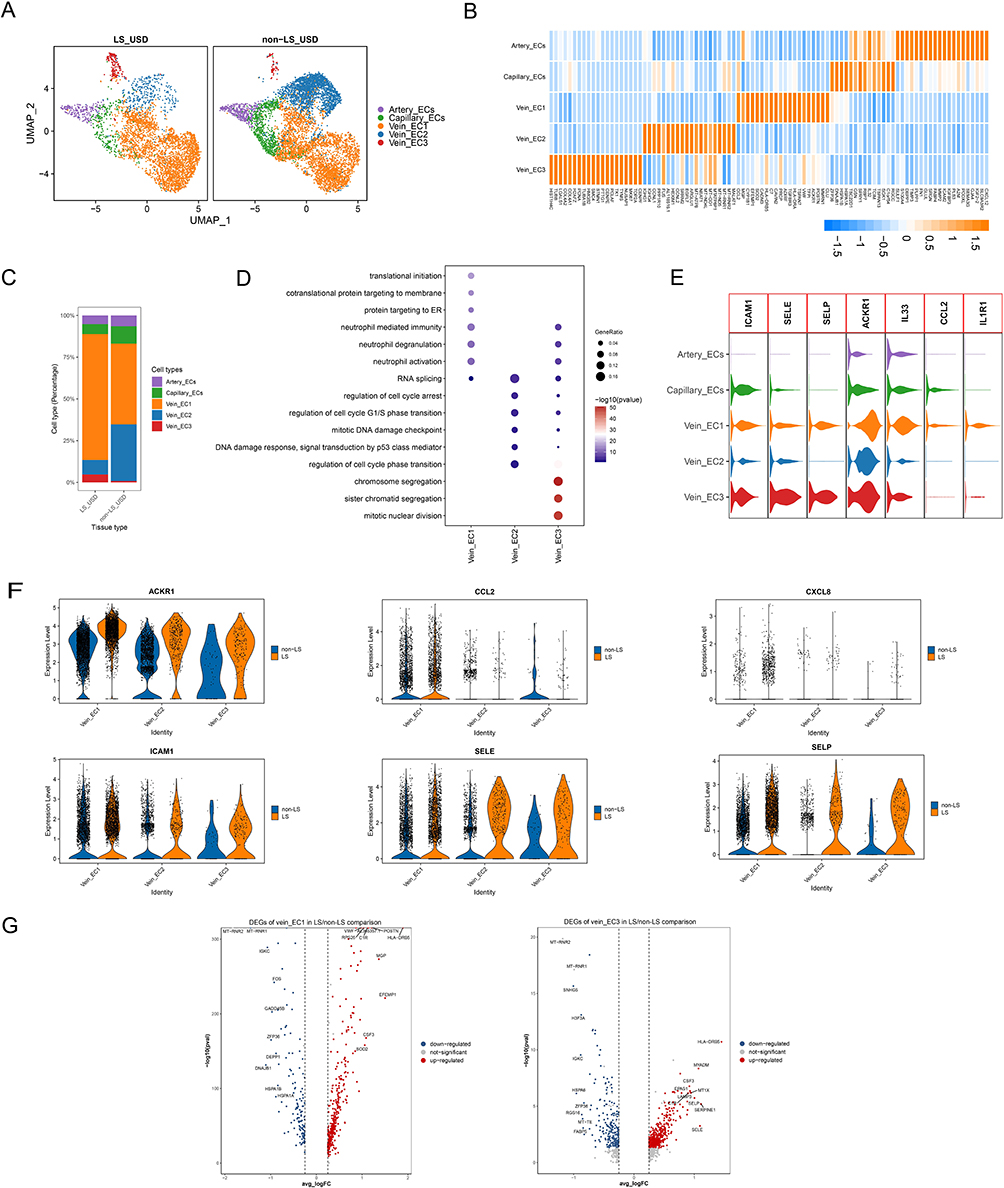 |
Figure 2 Characteristics of ECs in LS USD and non-LS USD. (A) UMAP plot showing clusters of endothelial cell subsets. (B) The heatmap displays the expression of the top 20 differentially expressed genes (rows) across the EC subsets (columns). Yellow represents genes with high expression, while blue represents genes with low expression. (C) Bar chart showing the relative proportion of each EC subset in LS USD and non-LS USD. (D) Representative GO terms enriched by upregulated DEGs in vein ECs. (E) Relative expression levels of the ICAM1, SELE, SELP, ACKR1, IL33, CCL2, and IL1R1 genes across five EC subsets. (F) Violin plot showing the expression of ACKR1, CCL2, CCL5, ICAM1, SELE, and SELP in vein EC subsets of LS USD and non-LS USD. (G) Volcano plots showing DEGs of vein EC1 and vein EC3 subsets in LS/non-LS comparison. |
SMC Subset in LS USD Primarily Perform Matrix Remodeling and Participate in the Immune Response
We also clustered SMCs into five subsets based on canonical markers (Figure 3A and B). Proportional analysis revealed that SMC2 and SMC5 were dominant in LS USD compared with non-LS USD (Figure 3C). In particular, SMC2 exhibited high expression of inflammatory and immune response-related genes (CHI3L2, CFD, and CFH), metal ion homeostasis and detoxification-related genes (MT1F and MT1X), adipogenesis or lipid metabolism genes (APOE and STEAP4), lymphoid tissue-homing chemokines (CCL21), and angiogenesis and inflammation genes (ANGPTL1). SMC5 expressed high levels of collagen-encoding genes (COL1A1, COL1A2, COL3A1, and COL6A3), cell adhesion molecule (THY1), and lymphoid tissue-homing chemokines (CCL19) (Figure 3B, Figure S3A). GO analysis indicated that SMC2 and SMC5 were enriched in pathways related to extracellular matrix organization, extracellular structure organization, and external encapsulating structure organization (Figure 3D, Figure S3B). Furthermore, we explored DEGs in SMC2 and SMC5 to understand their functions. Notably, collagen-encoding genes (such as COL1A1, COL1A2, COL3A1, COL6A3, and COL6A1), chemokines (such as CCL19, CCL21, and CXCL12), and genes mediating cell-cell and cell-matrix interactions (such as EFEMP1) were upregulated (Figure 3E).27 CCL19 and CCL21 are lymphoid tissue-homing chemokines that are essential for recruiting CCR7-expressing dendritic cells bearing pathogen-derived antigens and lymphocytes to lymph nodes.28 Therefore, the SMC subsets in LS USD, particularly SMC2 and SMC5, seem to be engaged in matrix remodeling and the immune response. SMC2 showed a distinct gene expression profile related to inflammation, immune response, and extracellular matrix organization, suggesting a potential role in recruiting lymphocytes and contributing to extracellular matrix dysregulation in LS USD. In contrast, SMC5 exhibited a gene expression profile indicating involvement in matrix remodeling, recruiting lymphocytes, and cell adhesion (Figure S3C). These findings provide valuable insights into the role of specific SMC subsets in LS USD pathogenesis, shedding light on potential targets for further research and therapeutic interventions.
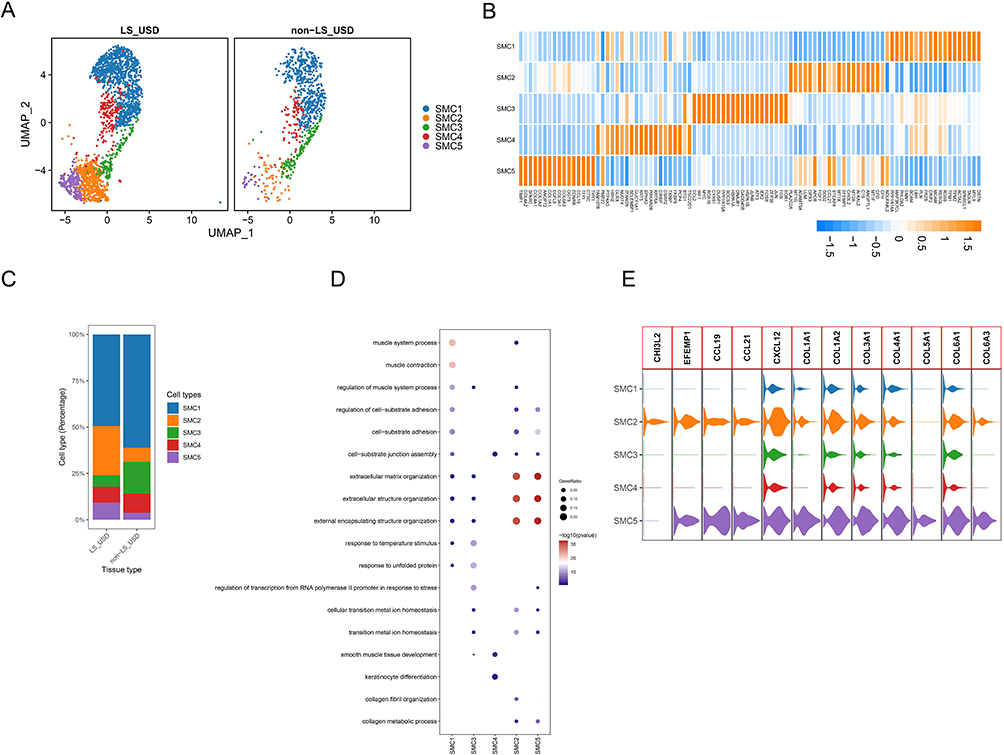 |
Figure 3 Characteristics of SMCs in LS USD and non-LS USD. (A) UMAP plot showing clusters of SMC subsets. (B) Heatmap displays the expression of the top 20 differentially expressed genes (rows) across the various subsets of SMCs (columns). Yellow represents genes with high expression, while blue represents genes with low expression. (C) Bar chart showing the relative proportion of each SMC subset in LS USD and non-LS USD. (D) Representative GO terms enriched by upregulated DEGs in SMCs. (E) E. Relative expression levels of the CHI3L2, EFEMP1, CCL19, CCL21, CXCL12, COL1A1, COL3A1, COL4A1, COL5A1, COL6A1, and COL6A3 genes across the five subsets of SMCs. |
Accumulation of Myeloid Cells, Particularly Macrophages, May Be an Important Pathogenic Factor in LS USD
Through scRNA-seq analysis, a dominant proportion of MCs, particularly macrophages, was identified in LS USD. The MC pool was further subdivided into three clusters: IL-1B macrophages (IL-1B Mac), C1QA macrophages (C1QA Mac), and dendritic cells (DCs) (Figure 4A and B). On the basis of their molecular markers, IL-1B Mac cells exhibited M1-like phenotypes that were associated with proinflammatory properties. Their molecular markers included CCL20, CXCL2, CXCL8, and IL-1B (Figure 4C). IL-1B Mac was strongly enriched in LS USD (Figure 4D). C1QA Mac cells exhibited M2-like phenotypes, and these macrophages were associated with anti-inflammatory properties involving tissue remodeling and wound healing.29 Their molecular markers included LGMN, CCL18, C1QB, and C1QA (Figure 4C). C1QA Mac were enriched in non-LS USD (Figure 4D). GO enrichment analysis was performed for the upregulated DEGs in MCs. The results showed that most of the biological processes that were enriched among the DEGs in DCs were antigen processing and presentation of exogenous antigen, antigen processing and presentation of exogenous peptide antigen via MHC class II, and regulation of inflammatory response. IL-1B Mac was related to the cellular response to tumor necrosis factor, chemokine-mediated signaling pathway, cellular response to interleukin-1 (IL-1), and transition metal ion homeostasis. C1QA Mac cells were related to receptor-mediated endocytosis, neuron death regulation, and lymphocyte-mediated immunity (Figure 4E). In exploring these propositions, IF staining was performed, and we confirmed that M1-like Mac (representative of CD86) and M2-like Mac (representative of CD206) were massively infiltrated in LS USD (Figure 4F). Thus, the accumulation of macrophages and the dysregulation of the M1/M2-like Mac ratio promoted the continuous occurrence of the inflammatory response.30
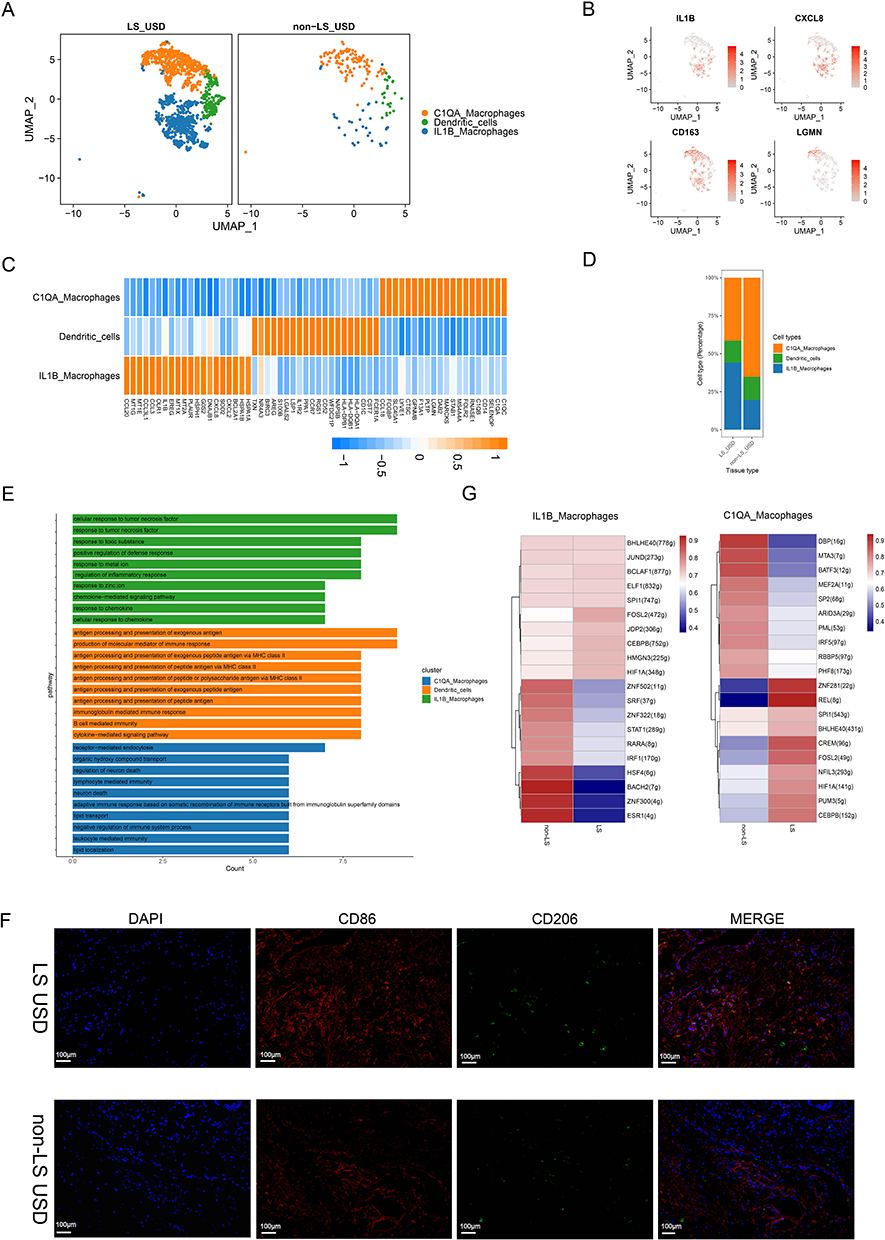 |
Figure 4 Characteristics of myeloid cells in LS USD and non-LS USD. (A) UMAP plot showing clusters of myeloid cell subsets. (B) UMAP plots showing the expression of IL-1B, CXCL8, CD163, and LGMN. (C) The heatmap displays the expression of the top 20 differentially expressed genes (rows) across the myeloid cell subsets. Yellow represents genes with high expression, while blue represents genes with low expression. (D) Comparison of the ratio of myeloid cell subsets in LS USD and non-LS USD. (E) Representative GO terms enriched by upregulated DEGs within distinct myeloid cell subsets. (F) Immunostaining for CD86 (red) and CD206 (green) indicates that the numbers of M1-type macrophages and M2-type macrophages are higher in the LS USD group. Scale bars represent 100 µm. (G) Heatmap of the expression of the top 10 transcription factors of IL-1B macrophages and C1QA macrophages in LS USD and non-LS USD. |
To further investigate the cell differentiation pathway, we performed pseudotime analysis on Mac. The results suggested that there was a major differentiation trajectory from IL-1B Mac to C1QA Mac. It seems that the transcriptomes of these two Mac subsets exhibit sustained changes (Figure S4A–D).
Subsequently, single-cell regulatory network inference and clustering (SCENIC) analysis identified the top 10 candidate TFs responsible for the differences in gene expression among different macrophage clusters in LS USD, which were notably different from those in non-LS USD. Common highly expressed TFs in all Mac subsets of LS USD included CEBPB, FOSL2, BHLHE40, HIF1A, and SPI1 (Figure 4G). However, their roles in Mac are still unknown. Therefore, these TFs are potential key regulators of Mac functions in LS USD, which warrants further research.
FBs in LS USD that Showed Significantly Different Transcriptional Profiles from Non-LS USD Might contribute to the Pathogenesis of LS USD
FBs play a key role in tissue fibrosis, a hallmark of USD. ScRNA-seq analysis revealed significant differences in the transcriptional profiles of FBs between LS-USD and non-LS USD. First, we analyzed the DEGs of FBs between LS USD and non-LS USD. In LS USD, inflammatory and immune response–related genes (PLA2G2A, CCL19, CXCL14, C3, PTX3, SLPI, SAA1, CHI3L1, and CHI3L2),31 adipogenesis-related gene (APOD), heavy metal detoxification and metal ion homeostasis-related genes (MT1E, MT1M, and MT2A), and the canonical Wnt signaling pathway gene inhibitor (DKK1) were highly expressed.32 In contrast, non-LS USD expressed genes related to matrix remodeling (COL3A1, COL5A1, COL6A1, COL7A1, COL3A1, TGFB1, CTHRC1, TNC, FN1, THBS4, and SPARC) and oxidative phosphorylation (MT-RNR1 and MT-RNR2) at high levels (Figure 5A). GSVA of the hallmark pathways revealed that FBs had a high enrichment score for epithelial mesenchymal transition, notch signaling, and peroxisomes in non-LS USD. Moreover, IL6-JAK-STAT3 signaling, inflammatory response, and TNFα signaling via the NF-kB and interferon gamma response pathways were upregulated in LS USD (Figure S5A). Next, GO analysis revealed that FBs in LS USD were enriched for transition metal ion homeostasis, neutrophil activation, and neutrophil activation involved in immune response and neutrophil-mediated immunity, whereas non-LS USD FBs were enriched for extracellular matrix organization, extracellular structure organization, collagen fibril organization, and ossification (Figure 5B, Figure S5B). GSEA also showed that myeloid leukocyte-mediated immunity and the positive regulation of inflammatory response-associated pathways were enriched in LS USD FBs, whereas non-LS USD FBs were associated with transforming growth factor-β receptor signaling and ossification (Figure 5C).
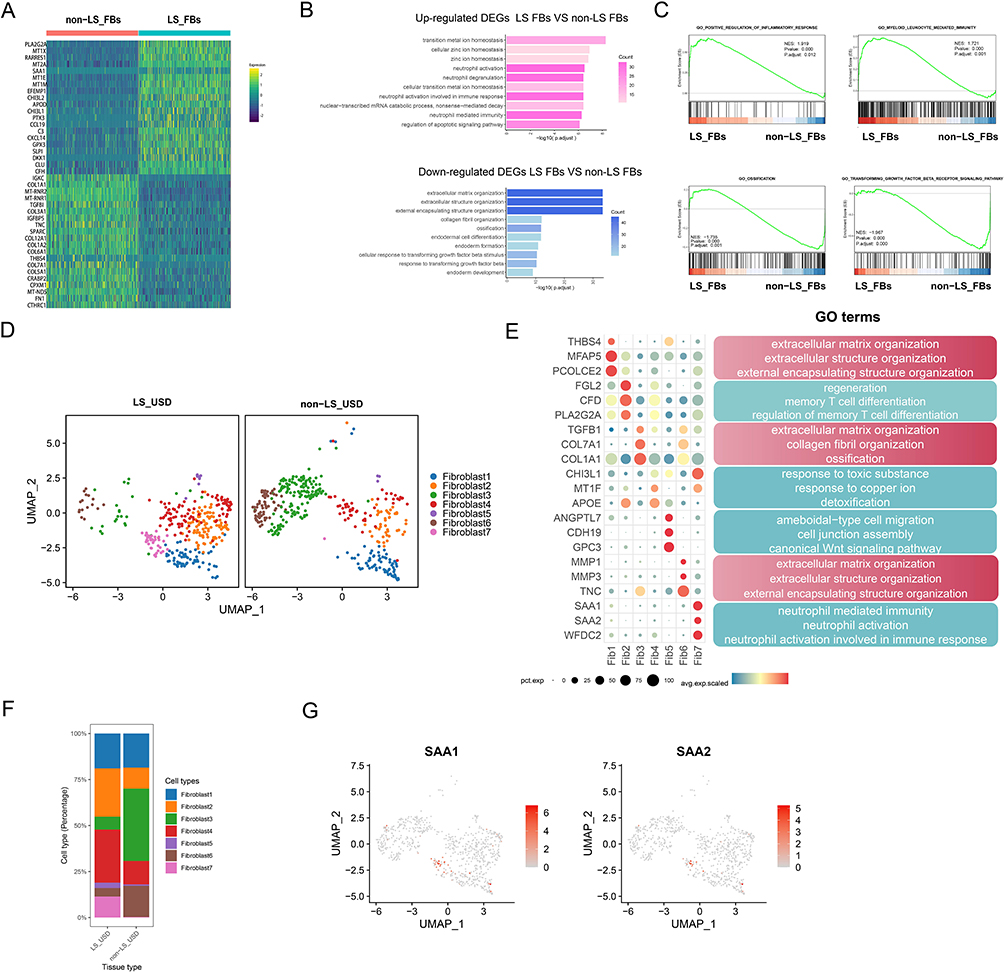 |
Figure 5 Characteristics of FBs in LS USD and non-LS USD. (A) The heatmap displays the expression of the top 20 differentially expressed genes (rows) across the FBs in the two groups (columns); the warmer the color is, the higher the expression. (B) GO analysis of upregulated and downregulated DEGs of FBs between LS USD and non-LS USD. (C) GSEA enrichment curved graph for representative signaling pathways upregulated in FBs between LS USD and non-LS USD. (D) UMAP of the unbiased clustering of FBs reveals seven cellular clusters. (E) Dot plots showing significant marker genes and enriched GO terms across FB clusters. (F) Comparison of the ratio of FB subsets in LS USD and non-LS USD. (G) UMAP of the unbiased clustering of marker genes SAA1 and SAA2 in Fib7. |
In distinguishing genes and cell populations related to LS USD, we classified FBs into seven subsets based on their unique marker gene profiles and visualized them using the UMAP technique (Figure 5D). The proportions of FB cluster 2 (Fib2), FB cluster 4 (Fib4), FB cluster 5 (Fib5), and FB cluster 7 (Fib7) were higher in LS USD, whereas FB cluster 3 (Fib3) and FB cluster 6 (Fib6) showed larger proportions in non-LS USD (Figure 5F). Gene expression profiles and GO analysis revealed that Fib2 was enriched in regeneration, memory T-cell (TC) differentiation, and regulation of memory TC differentiation. Fib4 was enriched in detoxification, response to copper ions, and response to toxic substances. Fib5 was enriched in ameboid-type cell migration, cell junction assembly, and the canonical Wnt signaling pathway. Fib7 was enriched in neutrophil-mediated immunity, neutrophil activation, and neutrophil activation involved in the immune response. Nevertheless, Fib3 expressed high levels of COL7A1, COL1A1, and TGF-β1, which were closely related to extracellular matrix organization, collagen fibril organization, and ossification. Fib6 expressed high levels of MMP3, MMP1, and TNC, which were relevant to extracellular matrix organization, extracellular structure organization, and external encapsulating structure organization. Notably, the functions of Fib3 and Fib6 were related to collagen formation, extracellular matrix composition, and fibrosis, accounting for the principal part of non-LS USD (Figure 5E, Figure S5C).
Fib7 expressed high levels of SAA1 and SAA2 and primarily existed in LS USD (Figure 5F and G). To validate this discovery, we performed IF staining with cell counts for representative markers. PDGFR-α (pink) was stained for FBs, and SAA1 (green) positive FBs were found only in the LS USD group (Figure 6A and B).
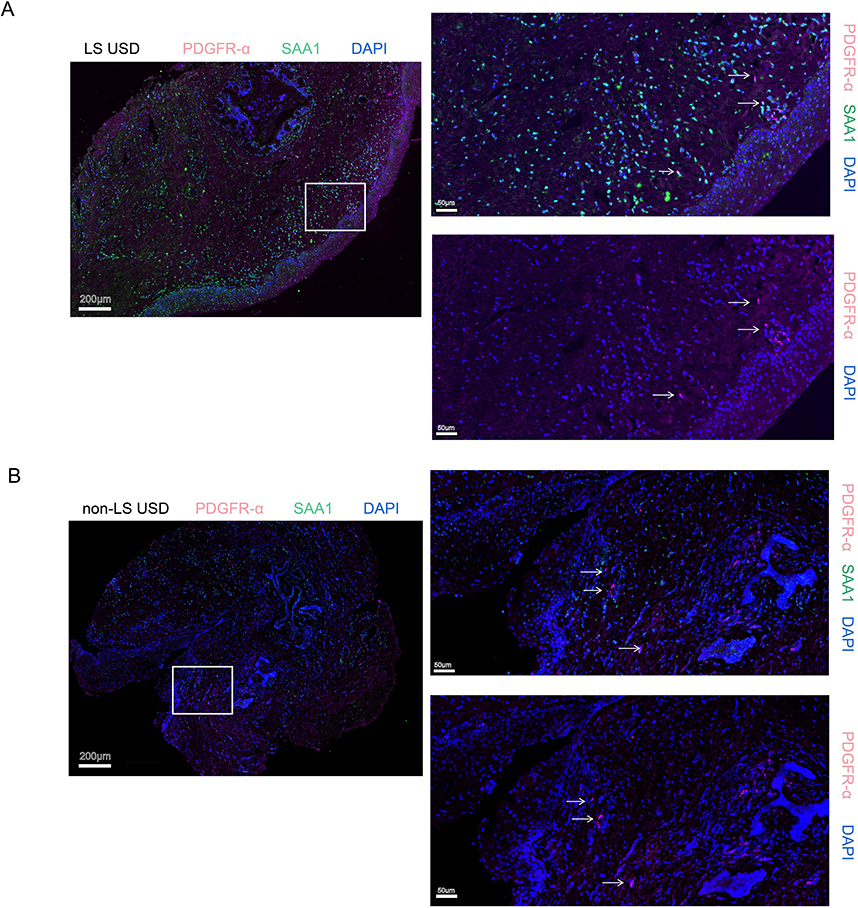 |
Figure 6 Immunostaining of Fib 7 in LS USD and non-LS USD tissues. (A) Immunostaining for PDGFR-α (pink), SAA1 (green), and DAPI (blue) showing the existence of Fib7 in LS USD (white row). PDGFR-α and SAA1 were stained to confirm the fibroblasts and Fib7 subset cells, respectively. Scale bars represent 200 µm (left) and 50 µm (right). (B) Immunostaining for PDGFR-α (pink), SAA1 (green), and DAPI (blue) showing the absence of Fib7 in non-LS USD (white row). PDGFR-α and SAA1 were stained to confirm the fibroblasts and Fib7 subset cells, respectively. Scale bars represent 200 µm (left) and 50 µm (right). |
Next, we removed Fib1 with a small difference in proportion between the two groups and analyzed the cell differentiation of the remaining six subsets via pseudotime analysis (Figure 7A and B). In the non-LS USD group, two diverging cell fates started with Fib3 and Fib6, primarily occupying the upper space of the major trajectory, and differentiated toward Fib2, Fib4, and Fib5. In the LS USD group, a small amount of Fib3 occupied one cell fate in the early stage of differentiation. Fib2, Fib4, and Fib5 occupied the lower space of the major trajectory, which belonged to the late stage of differentiation. Fib7 was the end of the trajectory, which belonged to the latest stage of differentiation (Figure 7C and D). These results suggested that LS USD-associated FBs promoted inflammation and participated in the immune response, potentially contributing to the pathogenesis of LS USD. The identification of distinct FB subsets, particularly SAA1 expressing FBs, further highlights the heterogeneity and potential functional roles of FBs in LS USD.
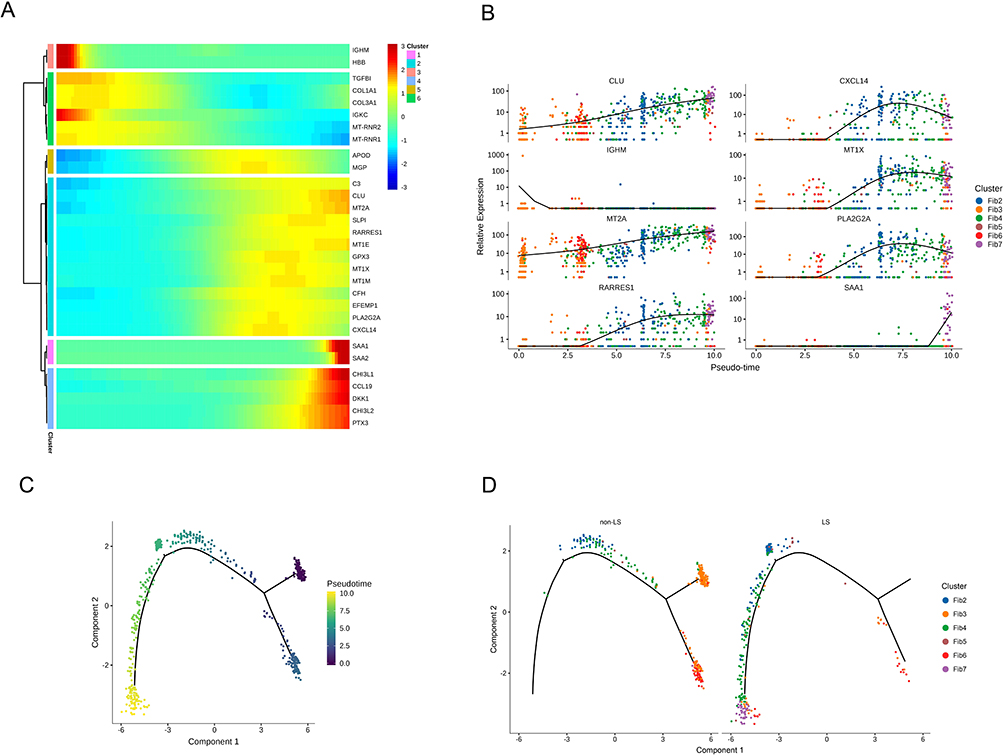 |
Figure 7 Pseudotime trajectories of FBs in LS USD and non-LS USD. (A) Heatmap presenting the relative expression of FB markers along the supposed trajectories in six fibroblast gene sets. The red and blue branches represent the two differential directions. (B) Monocle pseudotime trajectory expression pattern of six fibroblast subsets. (C and D) Pseudotime trajectories of the FB subsets in LS USD and non-LS USD. |
Cell Communication Predicted by CellPhoneDB
In investigating the interactions in these subsets of cells, we performed CellPhoneDB analysis to investigate cell communication and understand the relationships among different cell clusters in LS USD and non-LS USD. Fib7, a unique FB subset in LS USD, exhibited strong communication with other FBs, Macs, and ECs (Figure 8A, Figure S6C). The overall intercellular communication in LS USD was stronger than that in non-LS USD samples, particularly in FBs, Macs, and ECs (Figure 8A and B, Figure S6A–C). We utilized related LR pairs to predict those involved in these cell–cell interactions. In LS USD, we found that lymphocytes, FBs, and SMCs significantly communicated with vein EC1 through the LR pair CXCL8-ACKR1 (Figure 8C). As previously reported, vein EC1 highly expressed ACKR1, and CXCL8 was found to be highly expressed in stromal cells and MCs (Figure 8D and E). These results suggested that ACKR+ vein EC1 may be involved in leukocyte recruitment, and the CXCL8-ACKR1 interaction may promote leukocytes to enter the stroma and aggravate the inflammatory reaction in LS USD. Moreover, lymphocytes were identified to communicate with FBs, SMCs, and Macs through the immune-related LR pair CCR7-CCL19, especially with SMC5 (Figure 8F and G). These findings were consistent with the previous result of highly expressed CCL19 in SMC5. Intriguingly, Fib7 showed a unique interaction with IL-1B Mac via the SAA1-FPR2 LR pair (Figure 8H and I). This result supports the potential involvement of Fib7 in the pathogenesis of LS USD and warrants further exploration.
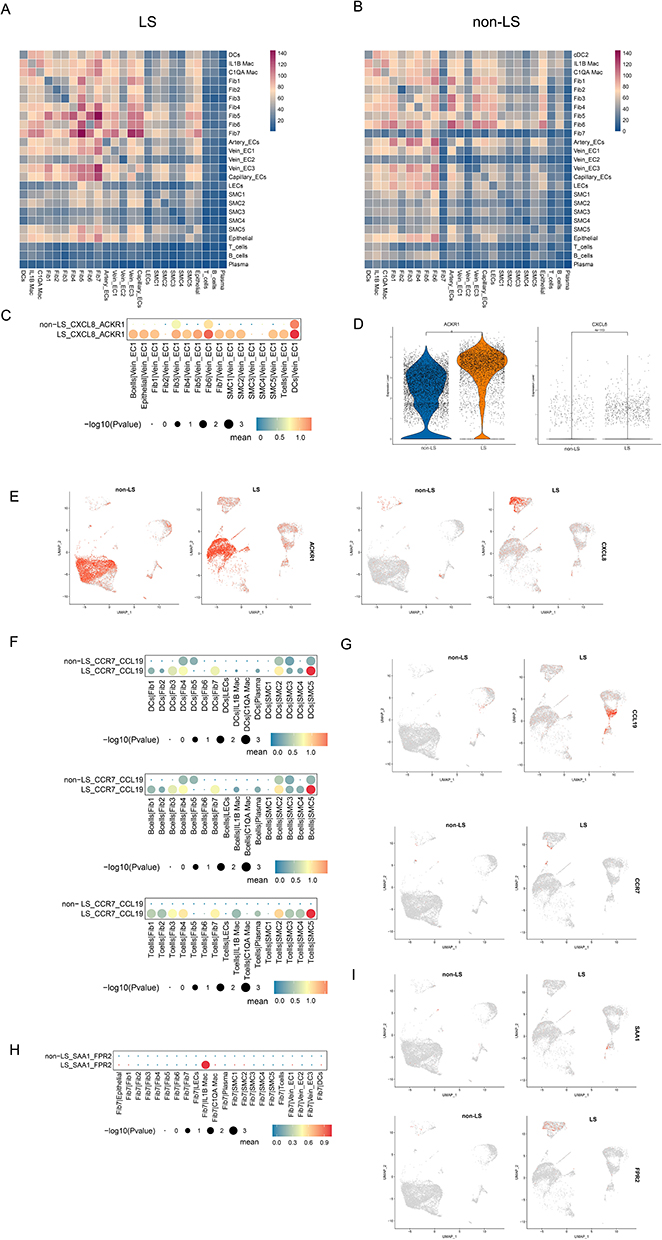 |
Figure 8 Cell communication between cell subsets in LS USD and non-LS USD. (A) Heatmap showing the interaction intensity among major cell subsets in LS USD. (B) Heatmap showing the interaction intensity among major cell subsets in non-LS USD. (C) Interaction of BCs, TCs, DCs, FBs, and SMCs with vein EC1 via the CXCL8/ACKR1 interaction pair in LS USD and non-LS USD. (D) Violin plot showing the expression of ACKR1 and CXCL8 in LS USD and non-LS USD. (E) UMAP plots showing the expression of CXCL8 and ACKR1 in LS USD and non-LS USD. (F) Interaction of BCs, TCs, and DCs with FBs, SMCs, and Macs via the CCR7/CCL19 interaction pair in LS USD and non-LS USD. (G) UMAP plots showing the expression of CCR7 and CCL19 in LS USD and non-LS USD. (H) Interaction of Fib7 with other major subsets via the SAA1/FPR2 interaction pair in LS USD and non-LS USD. (I) UMAP plots showing the expression of SAA1 and FPR2 in LS USD and non-LS USD. |
Discussion
Although the worldwide incidence of LS remains unknown, the reported incidence in Western populations was estimated to be 1 in 300 persons, and up to 30% of cases reported urethral involvement.33 To accurately assess the incidence of LS in phimosis, Czajkowski et al found that up to 67.4% of patients with phimosis were diagnosed with LS, which is much higher than the results of previous studies.34,35 However, the pathophysiology of LS USD remains unclear. Thus, the molecular mechanism of LS USD must be urgently explored. In this study, we presented nine major cell types at the single-cell level, elucidated the cell composition and specific gene expression signatures, and comprehensively compared the heterogeneous transcriptional profile between LS USD and non-LS USD, thereby providing new insights into the mechanisms related to LS USD. To our knowledge, this study is the first to research single-cell transcriptome profiling in LS USD.
Our study revealed that the principal subsets of ECs, SMCs, and FBs in LS USD were associated with promoting inflammation and participating in the immune response. Notably, we identified a unique FB, Fib7, which exhibited high expression levels of SAA1 and SAA2 in LS USD. This subset was primarily enriched in neutrophil-mediated immunity. Furthermore, we observed a significant accumulation of Macs in LS USD and a dysregulation in the ratio of M1/M2-like phenotype Macs. Cell communication analysis revealed that the CCR7-CCL19 LR pair communicated with immune cells and stromal cells in LS USD, suggesting that CCL19 may play a crucial role in recruiting and infiltrating lymphocytes into the affected area. In addition, we found that ACKR1+ vein EC1 plays a role in leukocyte recruitment through its interaction with CXCL8-ACKR1. Remarkably, Fib7 demonstrated a unique interaction with IL-1B Mac through SAA1-FPR2 signaling. Collectively, our findings strongly suggest that abnormal inflammation and the immune response play a central role in the pathogenesis of LS USD. These novel insights into the cellular and molecular mechanisms involved in the disease provide a foundation for further research and potential therapeutic interventions.
ECs play a crucial role in inflammatory disease by actively participating in and regulating inflammatory processes.36 In LS USD, we identified heterogeneity in EC subsets, particularly noting a higher proportion of vein EC1 and vein EC3 compared with non-LS USD. A notable marker for vein EC1 was ACKR1, which is known to regulate leucocyte recruitment.37 Previous studies have indicated that ACKR1 is located in endothelial junctions, promoting neutrophils through venular walls in a unidirectional luminal-to-abluminal manner.38 Interestingly, research by Ramachandran et al showed that ACKR1+ ECs are increased in human liver cirrhosis, leading to enhanced leucocyte transmigration, which is associated with organ fibrosis.39 In our study, we also observed high expression of adhesion molecules such as ICAM1, SELE, and SELP in vein EC1 and vein EC3, indicating their capacity to promote leukocyte entry into the tissue.40 In addition, inflammatory cytokines and receptors such as IL-33, CCL2, CXCL8, and IL-1 receptor (IL-1R1) were highly expressed in vein EC1. These genes were associated with the type II activation of ECs. Upon activation in response to the binding of inflammatory cytokines to relevant receptors, such as IL-1 and IL-1R1, these ECs initiate a cascade of signal transduction events and express proinflammatory proteins. One of these proteins was adhesion molecules, which increased leukocyte migration and facilitated a transition from neutrophil-rich infiltrates to mononuclear cell–rich infiltrates.41 Similarly, research on the cytokine expression profile of penile LS has also revealed an increase in the expression of the pro-inflammatory factor IL-1α.42 Thus, our results suggested that vein EC1 and vein EC3 might recruit leukocytes and participate in the inflammatory reaction in LS USD.
In SMC subsets, we observed that SMC2 and SMC5 had a higher proportion in LS USD than in non-LS USD, and they may promote collagen formation and induce lymphocytic infiltration. Notably, we discovered that SMC5 strongly interacted with lymphocytes and DCs via the LR pair CCR7-CCL19. The CCR7-CCL19 axis is known to play an important role in inflammation-related disease progression. For example, in multiple sclerosis, elevated levels of CCL19 have been found in the cerebrospinal fluid (CSF), resulting in increased TC infiltration and the presence of proinflammatory CCR7+ DCs in the CSF.43 Apart from SMC5, CCL19 was also found to be highly expressed in SMC2 and FBs of LS USD. Thus, we hypothesized that CCL19 could bind to its receptor CCR7, which is expressed on TCs, BCs, or DCs, thereby facilitating the recruitment of lymphocytes from the blood and promoting their chemotaxis toward the USD site. This observation was consistent with the typical pathological feature of lymphocytic infiltration commonly observed in LS.44 Our findings suggested that SMC2, SMC5, and their interaction with lymphocytes and DCs through the CCR7-CCL19 axis may contribute significantly to the pathogenesis of LS USD.
At present, the presence and role of inflammatory cells infiltrating LS USD remain poorly understood. Regauer et al confirmed that low-level clonal TCs infiltrating foreskin specimens with penile LS combined with immune profiles support a characteristic of local immune disorder.45 In our research, we found significant differences in the number and proportion of macrophages between LS USD and non-LS USD at the single-cell level. This result may be related to the degree of disease development and the location of tissue samples, which demonstrated the strong heterogeneity of LS USD. Notably, LS USD exhibited massive accumulation of macrophages and a high proportion of M1-like phenotype macrophages, which are important characteristics of inflammatory lesions.30 Macrophage dysfunction can lead to abnormal tissue repair and continuous tissue damage, potentially contributing to the development of pathological fibrosis.46 Similar observations have been made in other chronic wound conditions, such as diabetic foot ulcers, venous leg ulcers, and pressure ulcers. Pro-inflammatory M1-like macrophages dominate the chronic wound margin, contributing to the persistence of the wound.47,48 Therefore, these results suggested that the extended duration and high proportion of pro-inflammatory macrophages may be potential causes of the sustainable development of LS USD.49 Although some autoimmune diseases are associated with an increased M1/M2 ratio, whether the disorder ratio is the main cause of the pathogenic process in LS USD remains unknown. Considering that TFs regulate gene expression, we further detected TFs related to LS USD in macrophage subsets. The TFs CEBPB, FOSL2, BHLHE40, HIF1A, and SPI1 were upregulated in both macrophage subsets. In lung fibrosis models, macrophages can promote lung tissue fibrosis in a FOSL2-dependent manner, and targeting FOSL2 can alleviate lung fibrosis.50 Notably, FOSL2 had direct effects on autoimmunity and inflammation by inhibiting the development of regulatory TCs (Tregs). Overexpressing FOSL2 in a mouse model displayed a systemic inflammatory phenotype and immune infiltrates in multiple organs.51 CEBPB mediates the differentiation of profibrotic macrophages.52 BHLHE40, as a critical TF, promotes broad proinflammatory and glycolytic gene expression by elevating HIF1α levels in macrophages.53 The high expression level of SPI1 has also been linked to the differentiation of monocytes/macrophages.54 On the basis of these findings, we hypothesized that these TFs may play an important role in LS USD, but further research and confirmation are necessary to comprehensively understand their contributions to the disease.
An increasing body of evidence has highlighted the significant role of FBs in maintaining tissue homeostasis and immune regulation.55 FBs have been shown to have diverse functions, acting either as inflammatory cells or recruiting leukocytes and lymphocytes in various inflammatory diseases. Understanding the phenotype, mechanisms, and pathways of FBs could lead to the identification of therapeutic targets.56 In our study, FBs in LS USD had different functions and differentiations compared with those in non-LS USD. Notably, LS USD-associated FBs possessed pro-inflammatory and enhanced immune reactions. Further investigation of the cell lineage identified seven FB subsets in human USD, with high proportions of Fib2, Fib4, Fib5, and Fib7 in LS USD. Fib7 was particularly intriguing because of its high expression of SAA1/SAA2 genes, which are known to have cytokine-like activities and are associated with the regulation of inflammation and immunity.57 Moreover, LR pair analysis revealed that Fib7 communicated with IL-1B Mac via the SAA1–FPR2 interaction. Previous research has shown that SAA1 in tissues can bind to the FPR2 receptor activate the NF-κB signaling pathway, thereby promoting the release of pro-inflammatory factors such as TNF-α, IL-6, and IL-1β, inducing phagocyte migration and prolonging the lifespan of neutrophils.58,59 The present observations have shown that NFKB1 is overexpressed in advanced penile LS and exhibits a correlation with its progression.60 Furthermore, studies have demonstrated enhanced mRNA expression of pro-inflammatory cytokines such as IL-1A, INF-γ, and IL-6 in the foreskin of patients suffering from penile LS. Notably, in severe cases, there is also a significant increase in the expression of IL-1B mRNA.61 These findings, to a certain extent, confirm the validity of our research. Smole et al also confirmed that the interaction of SAA1 with FPR2 leads to airway epithelial IL-33 release and the development of allergic inflammation in vivo.62 In addition, FPR2 deletion has been shown to suppress macrophage chemotaxis and M1 polarization by blocking the cellular signaling pathway.63 Consequently, targeting the SAA1-FPR2 signaling pathway may show great application potential as a therapeutic strategy for LS USD.
Conclusion
Our study utilized high-dimensional single-cell analysis to obtain a comprehensive cell landscape of LS USD, making it the first cell atlas of its kind and providing valuable insights into the compositional and functional changes of cellular components involved in the pathogenic mechanisms. By broadening our understanding of LS USD at the single-cell level, we open up new avenues for advancing the field and improving patient outcomes.
Ethics and Consent Statement
The studies involving humans were approved by The Clinical Ethics Committee of Tangdu Hospital, Fourth Military Medical University (K202301-04). The patients/participants provided their written informed consent to participate in this study.
Acknowledgments
We thank Singleron Biotechnology Co., Ltd. (Nanjing, China) for their single-cell sequencing.
Funding
This work was supported by grants from Key Research and Development Projects of Shaanxi Province (2022SF-499).
Disclosure
The authors declare that they have no competing interests in this work.
References
1. Murphy R. Lichen sclerosus. Dermatol Clin. 2010;28(4):707–715. doi:10.1016/j.det.2010.07.006
2. Weir RF. Ichthyosis of the tongue and vulva. NY State J Med. 1875;21:240–256.
3. Stewart L, McCammon K, Metro M, et al. SIU/ICUD Consultation on Urethral Strictures: anterior Urethra-Lichen Sclerosus. Urology. 2014;83(3):S27–S30. doi:10.1016/j.urology.2013.09.013
4. Neill SM, Lewis FM, Tatnall FM, et al. British association of dermatologists’ guidelines for the management of lichen sclerosus 2010. Br J Dermatol. 2010;163(4):672–682. doi:10.1111/j.1365-2133.2010.09997.x
5. Campos-Juanatey F, Osman NI, Greenwell T, et al. European Association of Urology Guidelines on Urethral Stricture Disease. Eur Urol. 2021;80(2):201–212. doi:10.1016/j.eururo.2021.05.032
6. Granieri MA, Peterson AC, Madden-Fuentes RJ. Effect of Lichen Sclerosis on Success of Urethroplasty. Urol Clin North Am. 2017;44(1):77–86. doi:10.1016/j.ucl.2016.08.004
7. Kwok R, Shah TT, Minhas S Recent advances in understanding and managing Lichen Sclerosus. F1000 Res. 2020;15(9). doi:10.12688/f1000research.21529.1.
8. Alison L, Brendan B, Ariel F, et al. Insights into the Pathophysiology of Urethral Stricture Disease due to Lichen Sclerosus: comparison of Pathological Markers in Lichen Sclerosus Induced Strictures vs Nonlichen Sclerosus Induced Strictures. J Urol. 2019;201(6):1158–1163. doi:10.1097/JU.0000000000000155
9. Ding S, Chen XS, Shen KW. Single-cell RNA sequencing in breast cancer: understanding tumor heterogeneity and paving roads to individualized therapy. Cancer Commun. 2020;40(8):329–344. doi:10.1002/cac2.12078
10. Hedlund E, Deng Q. Single-cell RNA sequencing: technical advancements and biological applications. Mol Aspects Med. 2018;59:36–46. doi:10.1016/j.mam.2017.07.003
11. Dura B, Choi JY, Zhang KR, et al. scFTD-seq: freeze-thaw lysis based, portable approach toward highly distributed single-cell 3′ mRNA profiling. Nucleic Acids Res. 2019;47(3):e16. doi:10.1093/nar/gky1173
12. Martin M. Cutadapt removes adapter sequences from high-throughput sequencing reads. EMBnet J. 2011;17(1):10–12. doi:10.14806/ej.17.1.200
13. Dobin A, Davis CA, Schlesinger F, et al. STAR: ultrafast universal RNA-seq aligner. Bioinformatics. 2013;29(1):15–21. doi:10.1093/bioinformatics/bts635
14. Liao Y, Smyth GK, Shi W. FeatureCounts: an efficient general purpose program for assigning sequence reads to genomic features. Bioinformatics. 2014;30(7):923–930. doi:10.1093/bioinformatics/btt656
15. Butler A, Hoffman P, Smibert P, et al. Integrating single-cell transcriptomic data across different conditions, technologies, and species. Nat Biotechnol. 2018;36(5):411–420. doi:10.1038/nbt.4096
16. Satija R, Farrell JA, Gennert D, et al. Spatial reconstruction of single-cell gene expression data. Nat Biotechnol. 2015;33(5):495–502. doi:10.1038/nbt.3192
17. Korsunsky I, Millard N, Fan J, et al. Fast, sensitive and accurate integration of single-cell data with Harmony. Nat Methods. 2019;16(12):1289–1296. doi:10.1038/s41592-019-0619-0
18. Yu GC, Wang LG, Han YY, et al. ClusterProfiler: an R package for comparing biological themes among gene clusters. OMICS. 2012;16(5):284–287. doi:10.1089/omi.2011.0118
19. Subramanian A, Tamayo P, Mootha VK, et al. Gene set enrichment analysis: a knowledge-based approach for interpreting genome-wide expression profiles. Proc Natl Acad Sci USA. 2005;102(43):15545–15550. doi:10.1073/pnas.0506580102
20. Qiu XJ, Hill A, Packer J, et al. Single-cell mRNA quantification and differential analysis with Census. Nat Methods. 2017;14(3):309–315. doi:10.1038/nmeth.4150
21. Efremova M, Vento-Tormo M, Teichmann SA, et al. CellPhoneDB: inferring cell–cell communication from combined expression of multisubunit ligand–receptor complexes. Nat Protoc. 2020;15(4):1484–1506. doi:10.1038/s41596-020-0292-x
22. Sande BV, Flerin C, Davie K, et al. A scalable SCENIC workflow for single-cell gene regulatory network analysis. Nat Protoc. 2020;15(7):2247–2276. doi:10.1038/s41596-020-0336-2
23. Fergus KB, Lee AW, Baradaran N, et al. Pathophysiology, Clinical Manifestations and Treatment of Lichen Sclerosus: a Systematic Review. Urology. 2020;135:11–19. doi:10.1016/j.urology.2019.09.034
24. Nibbs RJ, Graham GJ. Immune regulation by atypical chemokine receptors. Nat Rev Immunol. 2013;13(11):815–829. doi:10.1038/nri3544
25. Cambier S, Gouwy M, Proost P. The chemokines CXCL8 and CXCL12: molecular and functional properties, role in disease and efforts towards pharmacological intervention. Cell Mol Immunol. 2023;20(3):217–251. doi:10.1038/s41423-023-00974-6
26. Sun R, Gao DS, Shoush J, et al. The IL-1 family in tumorigenesis and antitumor immunity. Semin Cancer Biol. 2022;86(Pt 2):280–295. doi:10.1016/j.semcancer.2022.05.002
27. Livingstone I, Uversky VN, Furniss D, et al. The Pathophysiological Significance of Fibulin-3. Biomolecules. 2020;10(9):1294. doi:10.3390/biom10091294
28. Purvanov V, Matti C, Samson GPB, et al. Fluorescently Tagged CCL19 and CCL21 to Monitor CCR7 and ACKR4 Functions. Int J Mol Sci. 2018;19(12):3876. doi:10.3390/ijms19123876
29. Li HZ, Xiao Y, Li Q, et al. The allergy mediator histamine confers resistance to immunotherapy in cancer patients via activation of the macrophage histamine receptor H1. Cancer Cell. 2022;40(1):36–52.e9. doi:10.1016/j.ccell.2021.11.002
30. Shapouri MA, Mohammadian S, Vazini H, et al. Macrophage plasticity, polarization, and function in health and disease. Cell Physiol. 2018;233(9):6425–6440. doi:10.1002/jcp.26429
31. Boudreau LB, Duchez AC, Cloutier N, et al. Platelets release mitochondria serving as substrate for bactericidal group IIA-secreted phospholipase A2 to promote inflammation. Blood. 2014;124(14):2173–2183. doi:10.1182/blood-2014-05-573543
32. Klavdianou K, Liossis SN, Daoussis D. Dkk1: a key molecule in joint remodelling and fibrosis. Mediterr J Rheumatol. 2017;28(4):174–182. doi:10.31138/mjr.28.4.174
33. Kurtzman JT, Blum R, Brandes SB. One-Stage Buccal Mucosal Graft Urethroplasty for Lichen Sclerosus Related Urethral Stricture Disease: a Systematic Review and Pooled Proportional Meta-Analysis. J Urol. 2021;206(4):840–853. doi:10.1097/JU.0000000000001870
34. Mateusz C, Anton Ż, Katarzyna C, et al. Lichen Sclerosus and Phimosis - Discrepancies Between Clinical and Pathological Diagnosis and Its Consequences. Urology. 2021;148:274–279. doi:10.1016/j.urology.2020.11.027
35. West DS, Papalas JA, Selim MA, et al. Dermatopathology of the foreskin: an institutional experience of over 400 cases. J Cutan Pathol. 2013;40(1):11–18. doi:10.1111/cup.12032
36. Zhang LH, Gao S, White Z, et al. Single-cell transcriptomic profiling of lung endothelial cells identifies dynamic inflammatory and regenerative subpopulations. JCI Insight. 2022;7(11):e158079. doi:10.1172/jci.insight.158079
37. Pruenster M, Mudde L, Bombosi P, et al. The Duffy antigen receptor for chemokines transports chemokines and supports their promigratory activity. Nat Immunol. 2009;10(1):101–108. doi:10.1038/ni.1675
38. Girbl T, Lenn T, Perez L, et al. Distinct Compartmentalization of the Chemokines CXCL1 and CXCL2 and the Atypical Receptor ACKR1 Determine Discrete Stages of Neutrophil Diapedesis. Immunity. 2018;49(6):1062–1076. doi:10.1016/j.immuni.2018.09.018
39. Ramachandran P, Dobie R, Wilson-Kanamori JR, et al. Resolving the fibrotic niche of human liver cirrhosis at single cell level. Nature. 2019;575(7783):512–518. doi:10.1038/s41586-019-1631-3
40. Reglero-Real N, Colom B, Bodkin JV, et al. Endothelial Cell Junctional Adhesion Molecules: role and Regulation of Expression in Inflammation. Arterioscler Thromb Vasc Biol. 2016;36(10):2048–2057. doi:10.1161/ATVBAHA.116.307610
41. Pober JS, Sessa WC. Evolving functions of endothelial cells in inflammation. Nat Rev Immunol. 2007;7(10):803–815. doi:10.1038/nri2171
42. Farrel AM, Dean D, Millard PR, et al. Cytokine alterations in lichen sclerosus: an immunohistochemical study. Br J Dermatol. 2006;155(5):931–940. doi:10.1111/j.1365-2133.2006.07414.x
43. Brandum EP, Jørgensen AS, Rosenkilde MM, et al. Dendritic Cells and CCR7 Expression: an Important Factor for Autoimmune Diseases, Chronic Inflammation, and Cancer. Int J Mol Sci. 2021;22(15):8340. doi:10.3390/ijms22158340
44. Zhang QY, Ye XP, Zheng Z, et al. Lymphocyte infiltration and thyrocyte destruction are driven by stromal and immune cell components in Hashimoto’s thyroiditis. Nat Commun. 2022;13(1):775. doi:10.1038/s41467-022-28120-2
45. Regauer S, Beham-Schmid C. Detailed analysis of the T-cell lymphocytic infiltrate in penile lichen sclerosus: an immunohistochemical and molecular investigation. Histopathology. 2006;48(6):730–735. doi:10.1111/j.1365-2559.2006.02406.x
46. Wynn TA, Vannella KM. Macrophages in tissue repair, regeneration, and fibrosis. Immunity. 2016;44(3):450–462. doi:10.1016/j.immuni.2016.02.015
47. Aitcheson SM, Frentiu FD, Hurn SE, et al. Skin Wound Healing: normal Macrophage Function and Macrophage Dysfunction in Diabetic Wounds. Molecules. 2021;26(16):4917. doi:10.3390/molecules26164917
48. Hesketh M, Sahin KB, West ZE, et al. Macrophage Phenotypes Regulate Scar Formation and Chronic Wound Healing. Int J Mol Sci. 2017;18(7):1545. doi:10.3390/ijms18071545
49. Smigiel KS, Macrophages PWC. Wound Healing, and Fibrosis: recent Insights. Curr Rheumatol Rep. 2018;20(4):17. doi:10.1007/s11926-018-0725-5
50. Ucero AC, Bakiri L, Roediger B, et al. Fra-2-expressing macrophages promote lung fibrosis in mice. J Clin Invest. 2019;129(8):3293–3309. doi:10.1172/JCI125366
51. Renoux F, Stellato M, Haftmann C, et al. The AP1 Transcription Factor Fosl2 Promotes Systemic Autoimmunity and Inflammation by Repressing Treg Development. Cell Rep. 2020;31(13):107826. doi:10.1016/j.celrep.2020.107826
52. Satoh T, Nakagawa K, Sugihara F, et al. Identification of an atypical monocyte and committed progenitor involved in fibrosis. Nature. 2017;541(7635):96–101. doi:10.1038/nature20611
53. Zafar A, Ng HP, Kim GD, et al. BHLHE40 promotes Macrophage pro-inflammatory gene expression and functions. FASEB J. 2021;35(10):e21940. doi:10.1096/fj.202100944R
54. Wang Y, Welc SS, Wehling-Henricks M, et al. Myeloid cell-specific mutation of Spi1 selectively reduces M2-biased macrophage numbers in skeletal muscle, reduces age-related muscle fibrosis and prevents sarcopenia. Aging Cell. 2022;21(10):e13690. doi:10.1111/acel.13690
55. Koliaraki V, Prados A, Armaka M, et al. The mesenchymal context in inflammation, immunity and cancer. Nat Immunol. 2020;21(9):974–982. doi:10.1038/s41590-020-0741-2
56. Wei K, Nguyen HN, Brenner MB. Fibroblast pathology in inflammatory diseases. J Clin Invest. 2021;131(20):e149538. doi:10.1172/JCI149538
57. Sun L, Ye RD. Serum amyloid A1: structure, function and gene polymorphism. Gene. 2016;583(1):48–57. doi:10.1016/j.gene.2016.02.044
58. Ye RD, Sun L. Emerging functions of serum amyloid A in inflammation. J Leukoc Biol. 2015;98(6):923–929. doi:10.1189/jlb.3VMR0315-080R
59. Chen K, Gong W, Huang J, et al. Developmental and homeostatic signaling transmitted by the G-protein coupled receptor FPR2. Int Immunopharmacol. 2023;118:110052. doi:10.1016/j.intimp.2023.110052
60. Wierzbicki PM, Czajkowski M, Kotulak-Chrząszcz A, et al. Altered mRNA Expression of NFKB1 and NFKB2 Genes in Penile Lichen Sclerosus, Penile Cancer and Zoon Balanitis. J Clin Med. 2022;11(24):7254. doi:10.3390/jcm11247254
61. Czajkowski M, Wierzbicki P, Kotulak-Chrząszcz A, et al. The role of occlusion and micro-incontinence in the pathogenesis of penile lichen sclerosus: an observational study of pro-inflammatory cytokines’ gene expression. Int Urol Nephrol. 2022;54(4):763–772. doi:10.1007/s11255-022-03130-7
62. Smole U, Gour N, Phelan J, et al. Serum amyloid A is a soluble pattern recognition receptor that drives type 2 immunity. Nat Immunol. 2020;21(7):756–765. doi:10.1038/s41590-020-0698-1
63. Chen XF, Zhuo S, Zhu TF, et al. Fpr2 Deficiency Alleviates Diet-Induced Insulin Resistance through Reducing Body Weight Gain and Inhibiting Inflammation Mediated by Macrophage Chemotaxis and M1 Polarization. Diabetes. 2019;68(6):1130–1142. doi:10.2337/db18-0469
 © 2024 The Author(s). This work is published and licensed by Dove Medical Press Limited. The
full terms of this license are available at https://www.dovepress.com/terms.php
and incorporate the Creative Commons Attribution
- Non Commercial (unported, v3.0) License.
By accessing the work you hereby accept the Terms. Non-commercial uses of the work are permitted
without any further permission from Dove Medical Press Limited, provided the work is properly
attributed. For permission for commercial use of this work, please see paragraphs 4.2 and 5 of our Terms.
© 2024 The Author(s). This work is published and licensed by Dove Medical Press Limited. The
full terms of this license are available at https://www.dovepress.com/terms.php
and incorporate the Creative Commons Attribution
- Non Commercial (unported, v3.0) License.
By accessing the work you hereby accept the Terms. Non-commercial uses of the work are permitted
without any further permission from Dove Medical Press Limited, provided the work is properly
attributed. For permission for commercial use of this work, please see paragraphs 4.2 and 5 of our Terms.