")
Back to Journals » Journal of Asthma and Allergy » Volume 17
Sources of Allergens Detected Through Allergen-Specific Serum IgE Antibody Test in Children with Suspected Allergic Diseases in Central China
Authors Yang L, Gao K, Gong W , Li C, Chen N, Li T, Wang S, Ni J , Yang J
Received 17 May 2024
Accepted for publication 31 July 2024
Published 12 August 2024 Volume 2024:17 Pages 769—781
DOI https://doi.org/10.2147/JAA.S469503
Checked for plagiarism Yes
Review by Single anonymous peer review
Peer reviewer comments 5
Editor who approved publication: Dr Luis Garcia-Marcos
Liu Yang,1 Kaijie Gao,1 Weihua Gong,1 Ci Li,1 Nan Chen,1 Tiewei Li,1 Shan Wang,1 Jiajia Ni,2,3 Junmei Yang1
1Department of Clinical Laboratory, Children’s Hospital Affiliated to Zhengzhou University, Zhengzhou Key Laboratory of Children’s Infection and Immunity, Zhengzhou, Henan, People’s Republic of China; 2Research and Development Center, Guangdong Meilikang Bio-Science Ltd, Foshan, Guangdong People’s Republic of China; 3Department of Detection and Diagnosis Technology Research, Guangzhou National Laboratory, Guangzhou, Guangdong, People’s Republic of China
Correspondence: Junmei Yang, Email [email protected]
Purpose: Although allergic diseases in children are on the rise, there has been no comprehensive investigation of the allergens affecting children with allergic diseases in central China. Therefore, we aimed to analyze the distribution of serum allergen species among children with allergic conditions in central China to inform the prevention, diagnosis, and treatment of childhood allergies.
Patients and Methods: A total of 9213 children (5543 males with 2.88 ± 0.04 years old and 3670 females with 2.91 ± 0.05 years old) underwent allergen screening, and serum allergen-specific IgE (sIgE) antibodies were detected using an automated fluorescent enzyme immunoassay system.
Results: Our findings revealed a total sIgE-positive rate (sIgE-PR) of 57.83%, with mixed food (42.10%), egg whites (30.83%), milk (28.97%), mixed dust mites (24.57%), and mixed molds (23.20%) being the most prevalent source of allergens. The sIgE-PR for common sources of allergens exhibited significant sex-based differences, with males having greater susceptibility than females (p< 0.05). Dust mites were the primary source of inhaled allergens, whereas egg white was the predominant source of food allergens. Sources of food allergens were most dominant among infants (0– 3 years old); sIgE-PRs for most source of food allergens decreased with age, whereas those for most source of inhaled allergens increased. The autumn sIgE-PRs for mixed molds, weed pollen combinations, and tree pollen combinations were significantly higher than those found in other seasons (p< 0.05).
Conclusion: Our findings suggest that sources of allergens profiles in children with allergies vary across age groups and seasons. Understanding these patterns can improve the effective prevention of childhood allergies.
Keywords: allergen, childhood allergies, IgE antibodies, source of food allergens, allergy prevention
Introduction
In recent decades, the global prevalence of allergic diseases has risen.1 Over 30% of the general population is affected by allergic diseases, making it one of the top three diseases requiring focused research and prevention efforts.2–4 The prevalence of common allergen species in children is as high as 40%-50% in children, who are at a higher risk than adults for various allergic diseases such as allergic rhinitis, atopic dermatitis, and allergic asthma.5,6
Neglected allergic disease can have substantial consequences for children’s health and in extreme cases can result in death, creating substantial psychological stress and financial strain for both children and their families. Primary risk factors for allergic diseases include exposure to sources of inhaled allergens such as dust mites, pollen, and dander or consumption of food antigens such as eggs, milk, and wheat.7,8 Recognizing allergen types and distribution patterns and taking measures to avoid high-risk sources of allergens can help prevent reactions. Thus, the serum-specific Immunoglobulin E (sIgE) test, known for its speed and simplicity, is widely employed as a standard and reliable method for identifying specific allergen.9 The prevalence of allergic diseases is strongly associated with various environmental allergen sources and direct contact, inhalation, or ingestion exposure levels. However, the vast territory of China, the wide variety of natural allergen sources, as well as the differences in geographical environment, climate and dietary habits, has led to significant regional differences in allergic diseases distribution.10,11
As a comprehensive investigation of the types of allergen affecting children with allergic diseases in central China has not yet been conducted, we examined the serum sIgE test results of 9213 children in the region to analyze the types of allergen species affecting children and to explore the distribution of sources of allergens across various ages, sexes, and seasons. We aimed to offer essential insights for the prevention, diagnosis, and treatment of allergic diseases in children in central China.
Material and Methods
Participants
Between March 2022 and March 2023, children with allergic symptoms such as cough, rash, itching, and respiratory issues who were treated in the Henan Children’s Hospital Affiliated with Zhengzhou University, a tertiary hospital located in a major city in central China. The hospital is approved as the National Children’s Regional Medical Center and is known as the Henan Children’s Medical Center. Thanks to the country’s comprehensive children’s medical insurance system, children from various socio-economic backgrounds are able to receive treatment at this center. The center is one of the largest children’s hospitals in central China, serving patients from Henan and neighboring provinces, making it a representative sample of children in central China. Allergic diseases, such as eczema, atopic dermatitis, urticaria, respiratory tract infections, food allergies, and allergic asthma, were diagnosed according to the consensus on diagnosis and management of allergic diseases in children.12 A total of 9213 children with comprehensive data were included in the subsequent analysis.
Allergen Test
Eleven inhaled allergen sources and nine sources of food allergen were tested. The specific IgE antibody testing kits for inhaled and food allergen sources were provided by ThermoFisher. Clinicians selected the most suitable allergen species based on the disease type and economic status of the patients. Therefore, not every patient was tested for all 20 allergen species. Inhaled allergen sources included Dermatophagoides pteronyssinus, Dermatophagoides farinae, dog dander, cat dander, Blattella germanica, mixed dust mite (D. pteronyssinus and D. farinae), mixed animal fur (cat, horse, cow, and dog dander), mixed molds (Penicillium chrysogenum, Cladosporium herbarum, Aspergillus fumigatus, Candida albicans, Alternaria species, and Helminthosporium species), mixed grasses (ragweed, mugwort, French chrysanthemum, dandelion, and autumn unicorn grass), and mixed trees (Alnus incana, Corylus avellana, Fagales, Ulmus americana, Salix caprea, and Populus deltoides). Food-allergen sources included egg white, milk, wheat, peanut, soybean, shrimp, crab, sesame, and mixed food (egg white, milk, peanut, wheat, fish, and soybean).
Serum allergen-specific immunoglobulin E (sIgE) levels were assayed using ImmunoCAPTM (Phadia, Uppsala, Sweden) with uniform and standardized procedures according to the manufacturer’s instructions. The ImmunoCAP system detects allergen-specific IgE in vitro with the advantages of high sensitivity, high specificity and high stability. It has been recognized as the “gold standard” for the in vitro diagnosis of allergic conditions by the World Health Organization and the European Society of Allergy and Clinical Immunology. The detection range of the ImmunoCAPTM is 0.10–100 KUA/L. As per the method recommendation, results were divided into seven levels: level 0 (0~0.35 KUA/L), level 1 (0.35~0.70 KUA/L), level 2 (0.70~3.50 KUA/L), level 3 (3.5~17.5 KUA/L), level 4 (17.5~50 KUA/L), level 5 (50~100 KUA/L), and level 6 (≥100KUA/L). The sIgE results were considered sensitization-positive for values of 0.35 KUA/L or more. The total IgE concentration was measured using a Cobas 8000 modular analyzer (Roche Diagnostics, Rotkreuz, Switzerland). The percentage of eosinophils was determined using an automatic Mindray BC-7500 analyzer (Upper Bio-Tech, Shanghai, China).
Data Analysis
Data were categorized and analyzed using R version 4.2.3. Percentages were used to depict categorical values, and the chi-square test was used to assess the variance among groups. The Spearman correlation method was used to assess the correlation between sIgE levels and other clinical and laboratory parameters. Statistical significance was set at p<0.05.
Results
Demographic Characteristics
In total, 9213 children with allergic diseases (5543 males, and 3670 females) were enrolled. Participants were divided into five age groups: “infants” (0 month–1 year; n = 3457), “toddlers” (>1–3 years; n = 2382), “preschool children” (>3–6 years; n = 1993), “school-aged children” (>6–12 years; n = 1307), and “adolescents” (>12–18 years; n = 74; Table 1). Eczema, atopic dermatitis, and urticaria were the most common symptoms, followed by respiratory tract infections, food allergies, and allergic asthma (Figure 1A). Among the tests of sources of inhaled allergens, single-type allergies reached 14.53%, followed by multiple allergies (12.4%) and double allergies (7.04%) (Figure 1B). Among the tests of sources of food allergens, multiple allergies reached 26.05%, followed by double allergies (16.1%) and single-type allergies (8.19%) (Figure 1C).
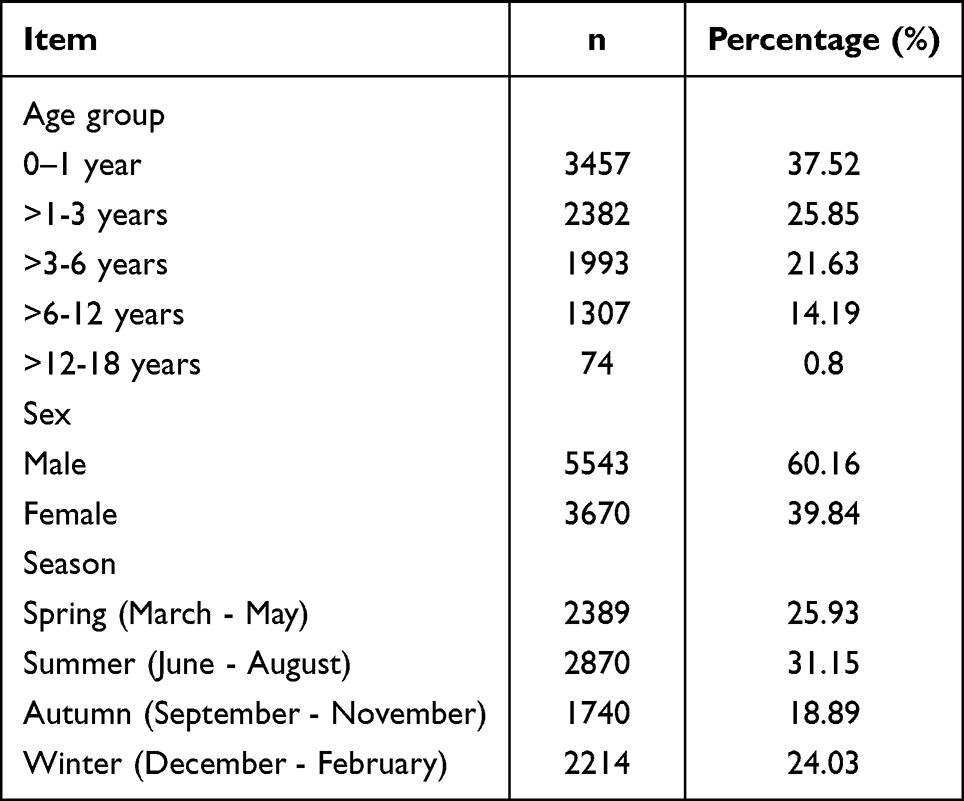 |
Table 1 Characteristics of Participants |
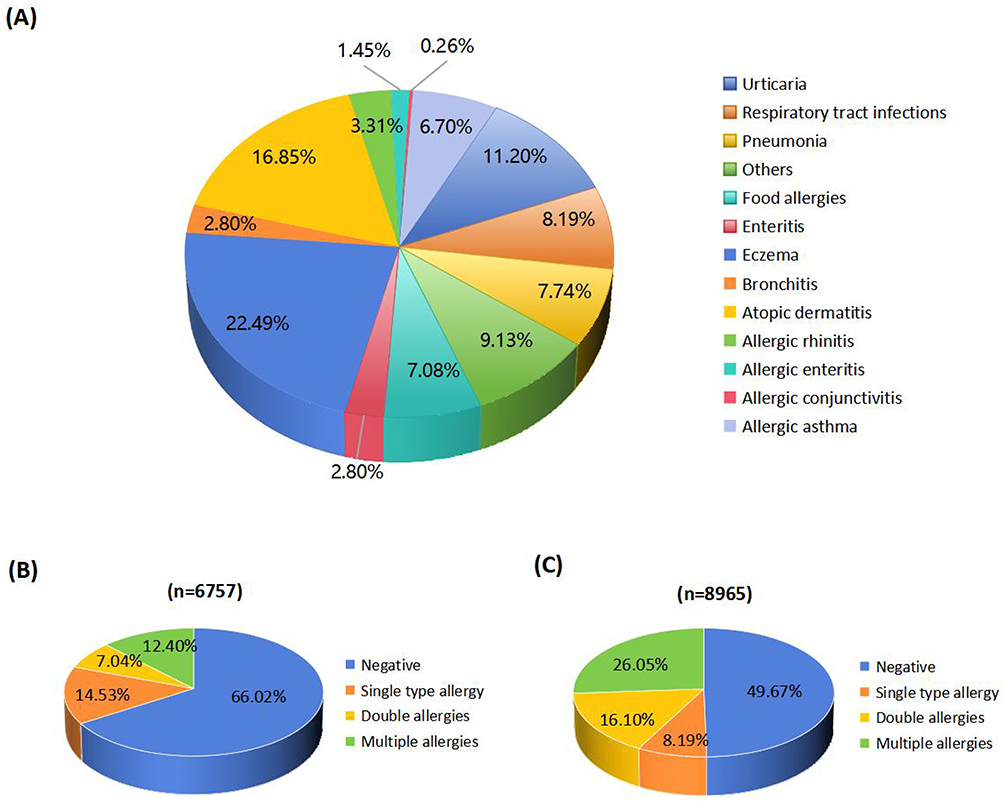 |
Figure 1 Disease composition of clinical diagnosis and sources of allergens. Disease composition of clinical diagnosis (A) and composition of inhaled (B) and food allergen species (C). The numbers in parentheses represent the number of cases and the percentage, respectively. |
Allergen Sensitization Profiles
The overall sIgE-PR rate was 57.83% (5328/9213) (33.98% with at least one positive source of inhaled allergens and 50.33% with at least one positive food allergen). Mixed dust mites (24.57%), mixed molds (23.2%), and D. farinae (21.81%) were the most common source of inhaled allergens in the Zhengzhou area, followed by D. pteronyssinus (19.73%), mixed grass (16.44%), and mixed trees (14.37%). The most common food allergen species were mixed foods (42.1%), egg white (30.83%), milk (28.97%), wheat (16.16%), and sesame (13.61%; Figure 2 and Table S1). More positive results belonged to classes 1–3 than to higher classes. D. farinae, D. pteronyssinus, mixed molds, dog dander, and mixed grasses elicited reactions in classes 4–6 (38.89%, 28.25%, 23.26%, 17.54%, and 15.16%, respectively), indicating a relatively high level of a strong positive reaction.
 |
Figure 2 Percentage of allergen-detected results and levels in allergen-positive children. The percentage of allergen-detected results (A) and different levels in the allergen-positive children with allergic diseases (B). Phadiatop is not a natural source of allergens, but a mixture of several different inhaled allergens. More than 90% of common allergens in the air are embedded in the same CAP and determined by CAP system. |
Age Differences Among Allergen Profiles
In comparing the differences in sensitization to inhaled and food allergen species among the five age groups, we found an association between age and allergic sIgE-PR. The sIgE-PRs of mixed food, egg white, and milk were highest in those aged 0–1 years and >1-3 years. In children between the ages of 3 and 6 years, the highest sIgE-PRs for food and inhaled allergen species were for mixed food and mixed molds. The sIgE-PRs of mixed dust mites and D. farinae were highest in those aged >6-12 and >12-18 years, respectively (Figure 3 and Table S2). Significant statistical differences were observed in the sIgE-PRs for each specific allergen species (except wheat) among the various age groups (p<0.05). The sIgE-PRs against D. pteronyssinus, D. farinae, dog dander, B. germanica, mixed grasses, mixed trees, Phadiatop complex, crab, and shrimp increased with age. The prevalence of egg white, milk, wheat, and mixed foods decreased with increasing age after 3 years (p<0.05). Notably, before the age of 12 years, the sIgE-PRs for most inhaled allergen species showed an increasing trend with age, whereas the positive percentage for food allergen species showed a decreasing trend with age (Figure 3). Although it was not significant, the correlation between the positivity rate of inhaled allergen species and age exhibited a trend that was opposite that between the positivity rate of food allergen species and age (Figure 3B).
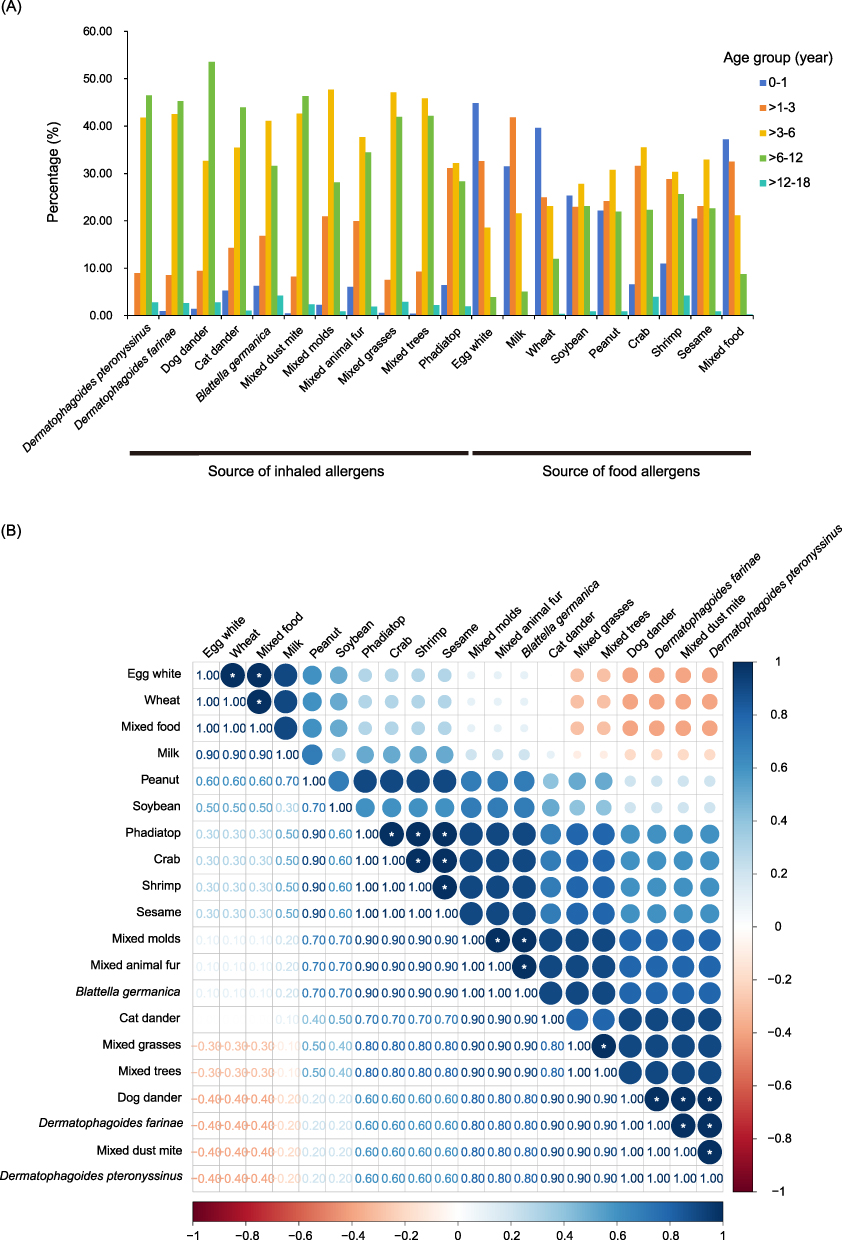 |
Figure 3 Percentage of inhaled and food allergen species in children with allergic diseases by age. Percentage of inhaled and food allergen species among different age groups (A) and Spearman correlation between the allergen species based on the percentages of allergen species in different age groups (B). The numbers at the bottom left indicate Spearman correlation coefficients. Phadiatop is not a natural source of allergens, but a mixture of several different inhaled allergens. More than 90% of common allergens in the air are embedded in the same CAP and determined by CAP system. *P < 0.05. |
In our investigation of the effect of age on the prevalence of sensitization, compared with 0–1 year-old children, the sIgE-PR of all allergen species in children increased with age and was statistically significant before 6 years of age (p<0.05). Particularly, sIgE-PR of D. pteronyssinus increased significantly with age (p<0.05; Table 2).
 |
Table 2 The Effect of Age Groups on the Prevalence of Allergen Sensitization |
Sex Differences Among Allergen Profiles
The overall prevalence of sensitization to inhaled and food allergen species was higher in males (60.47%) than females (54.99%), with a statistically significant difference in the sIgE-PRs of allergen species between the sexes (p<0.05; Figure 4 and Table S3). Males showed higher rates of sensitization to inhaled and food-allergen species than females. In both males and females, house mites D. pteronyssinus, and D. farinae, had the highest sIgE-PRs for inhaled allergen species, whereas milk, egg, and wheat had the highest sIgE-PRs for food allergen species (Figure 4).
 |
Figure 4 Composition of the sources of allergens by sex Composition of the sources of allergens in male (A) and female (B) children with allergic diseases. The numbers in parentheses represent the number of cases and the percentage, respectively. Phadiatop is not a natural source of allergens, but a mixture of several different inhaled allergens. More than 90% of common allergens in the air are embedded in the same CAP and determined by CAP system. |
In our further exploration of sex differences in the prevalence of sensitization among different age groups, we found significant differences in the sIgE-PRs of allergen species between males and females in all age groups, with the exception of dog dander, cat dander, mixed dust mite, mixed animal fur, Phadiatop complex, crab, and shrimp. There were also significant sex-specific differences in the 0–1 and >1-3 years age groups in the sIgE-PRs of egg white, wheat, soybean, peanut, sesame, and mixed food. In the >3-6 years age group, the prevalence of the main inhaled allergen species (except dog dander, cat dander, mixed animal fur, and Phadiatop complex) and the main food allergen species (except crab and shrimp) in males was significantly higher than that in females. However, sex-based differences in sensitization to all allergen species (except soybeans) were not observed in patients aged >12-18 years (Table 3).
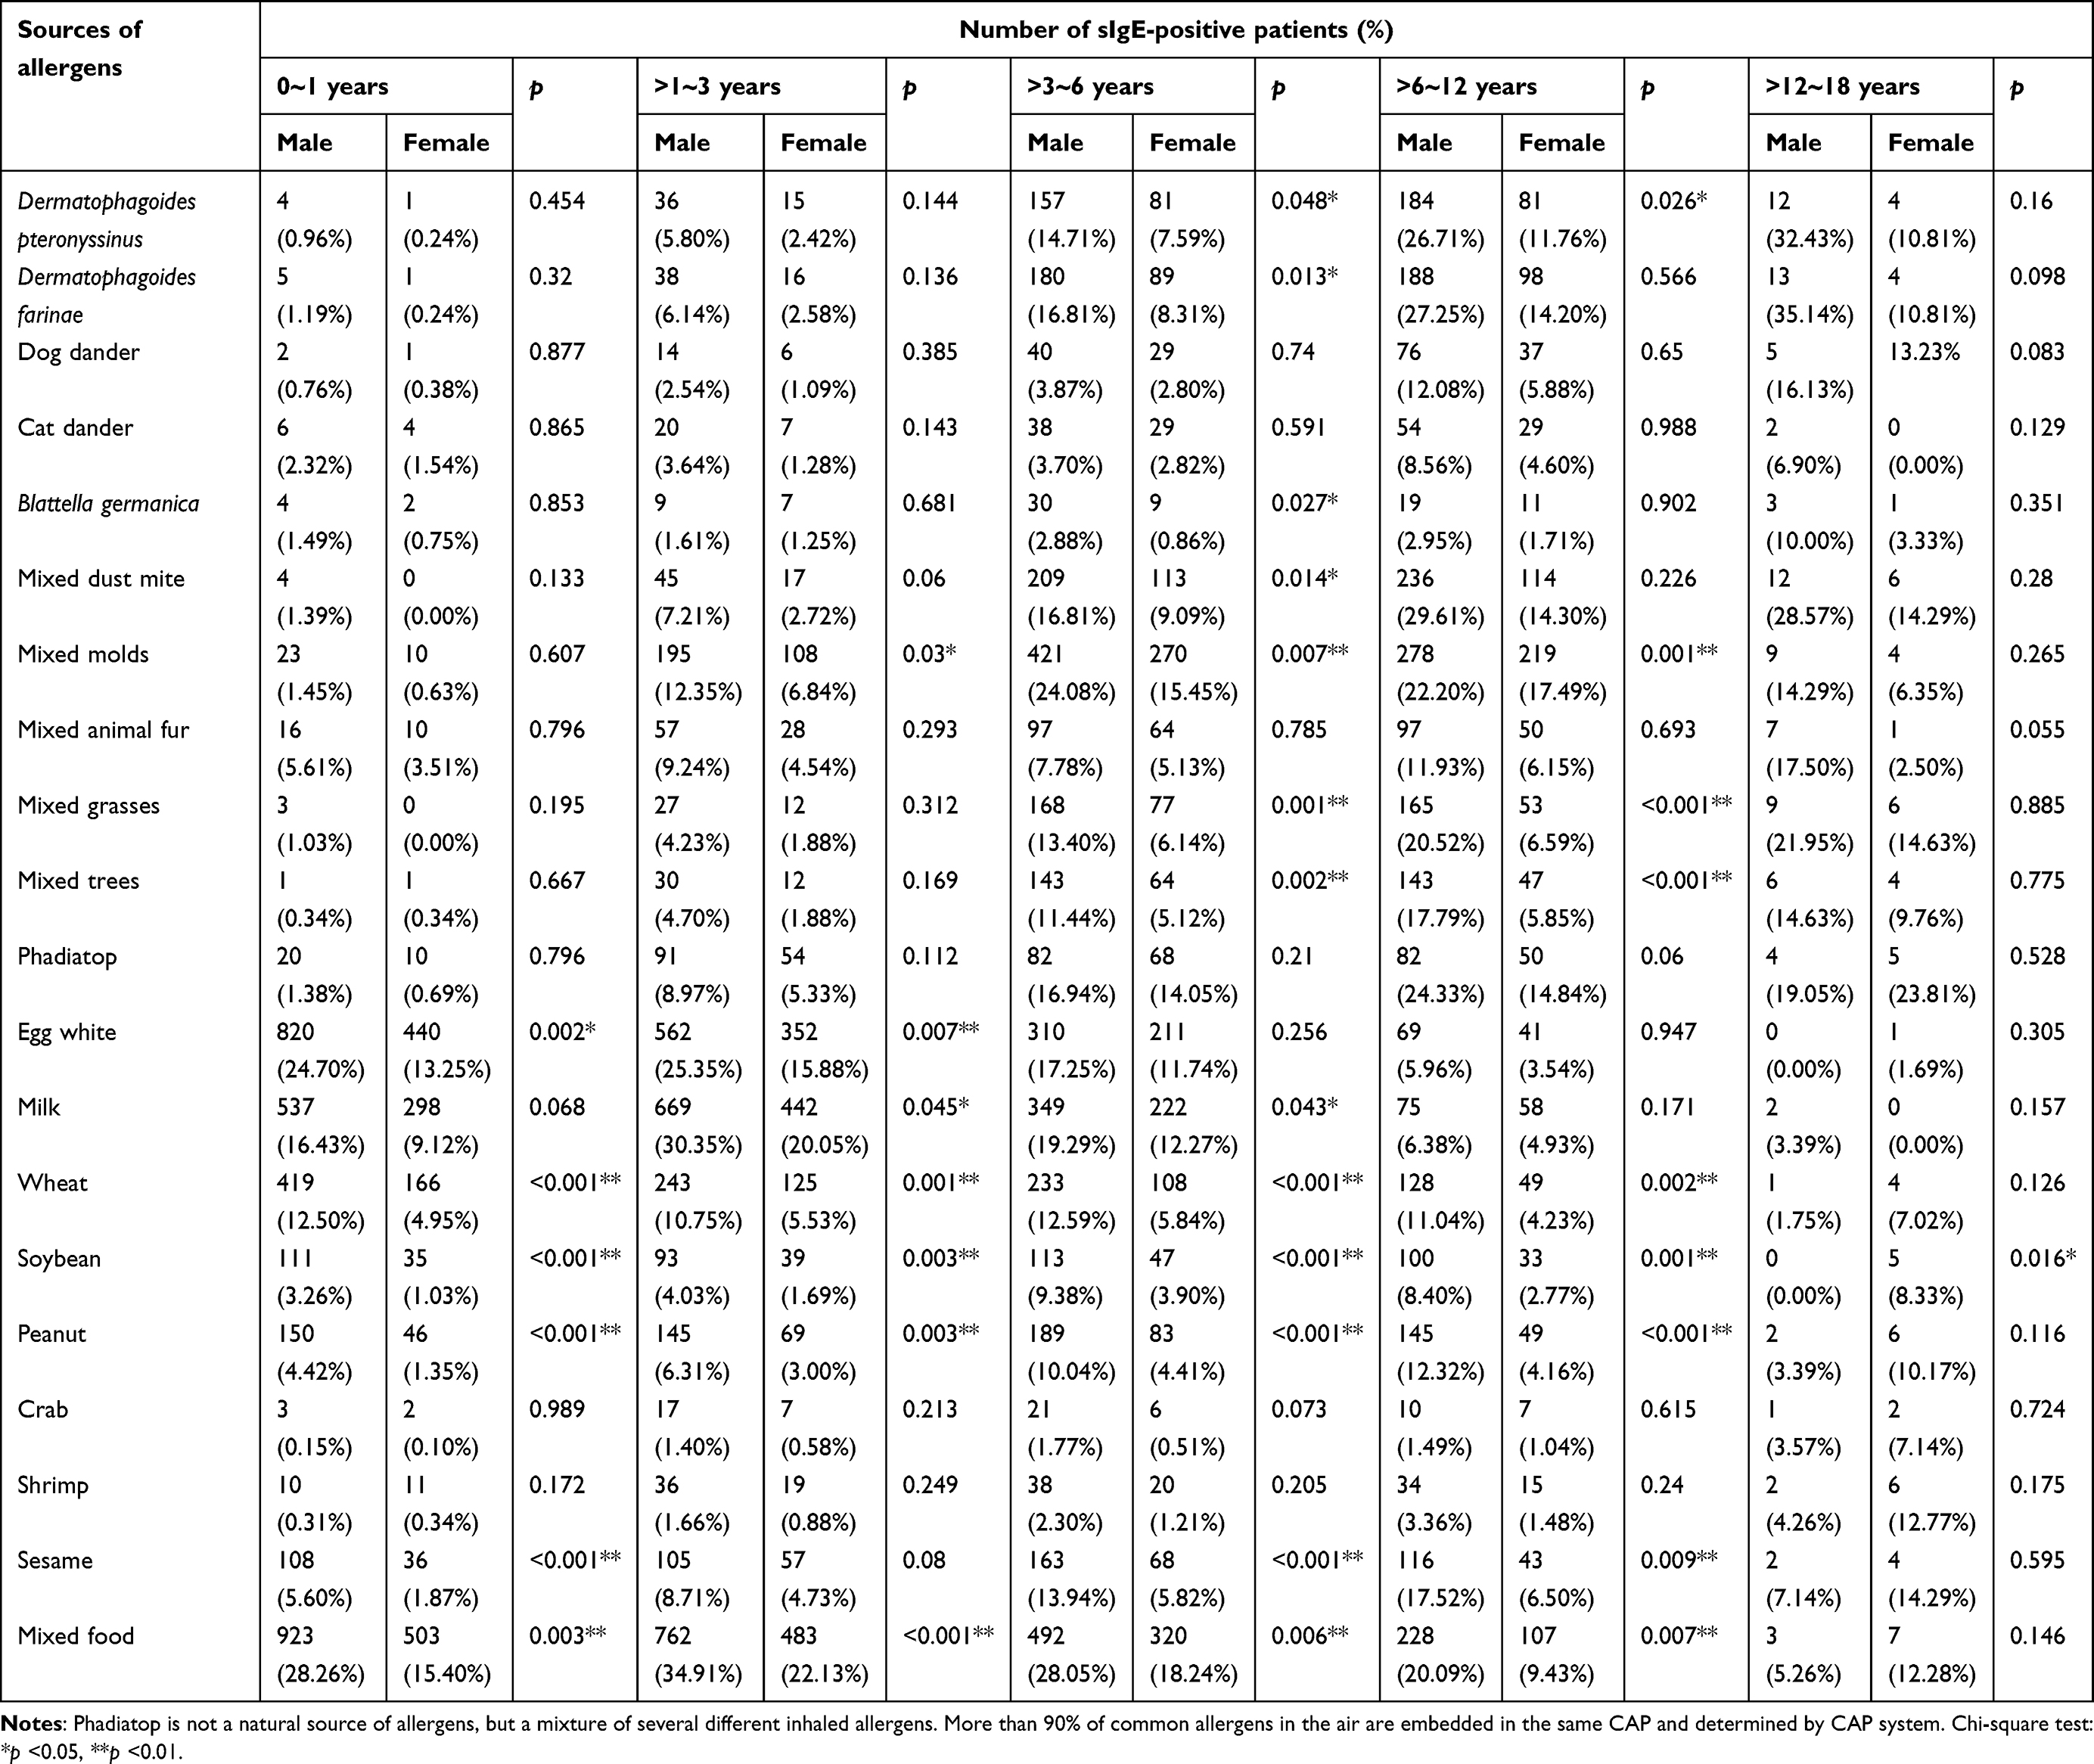 |
Table 3 Sex and Age Differences of Positive Rates (%) |
Season Difference of Allergen Profiles
The prevalence of sensitization to most inhaled and food allergen species had significant differences among seasons, except for B. germanica and milk (p>0.05). Compared with all other types of allergens, the mixed food group had the highest rate of sensitization in all seasons. Mixed molds, mixed grasses, mixed trees, Phadiatop complex, soybean, peanut, crab, shrimp, and sesame had the highest sIgE-PR values in autumn (p<0.05). D. pteronyssinus, D. farinae, dog dander, cat dander, mixed dust mites, mixed animal fur, wheat, and mixed food showed the highest sIgE-PR values in winter (p<0.05), whereas eggs showed the highest sIgE-PR values in spring (p<0.05; Figure 5A and Table S4). The correlation between the positivity rate of inhaled allergen species and season did not exhibit the opposite trend compared to the correlation between the positivity rate of food allergen species and season (Figure 5B).
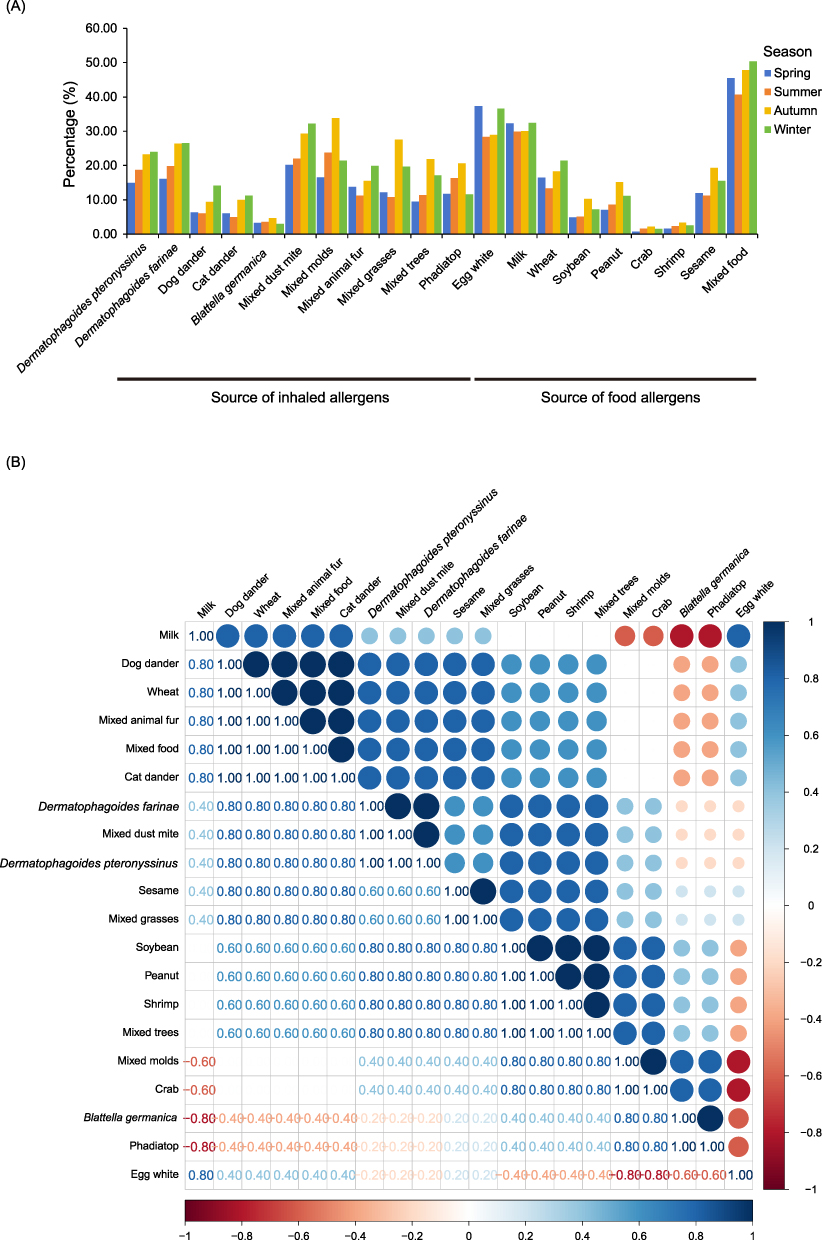 |
Figure 5 Percentage of inhaled and food allergen species in children with allergic diseases by sex. Percentage of inhaled and food allergen species in children with allergic diseases among different seasons (A) and Spearman correlation between the allergen species based on the percentages of allergen species in different seasons (B). The numbers at the bottom left were Spearman correlation coefficients. Phadiatop is not a natural source of allergens, but a mixture of several different inhaled allergens. More than 90% of common allergens in the air are embedded in the same CAP and determined by CAP system. |
The Relationship Between sIgE and Other Indicators in Serum
In measuring the concentration of total sIgE and percentage of eosinophils to reveal the correlation between sIgE and other indicators in 3826 children who underwent all tests simultaneously, there was a significant positive correlation between total IgE and all types of allergen-specific IgE and a positive correlation between eosinophilic percentage and most food allergen-specific IgE (except crab), but no correlation with all inhaled allergen species (Table 4).
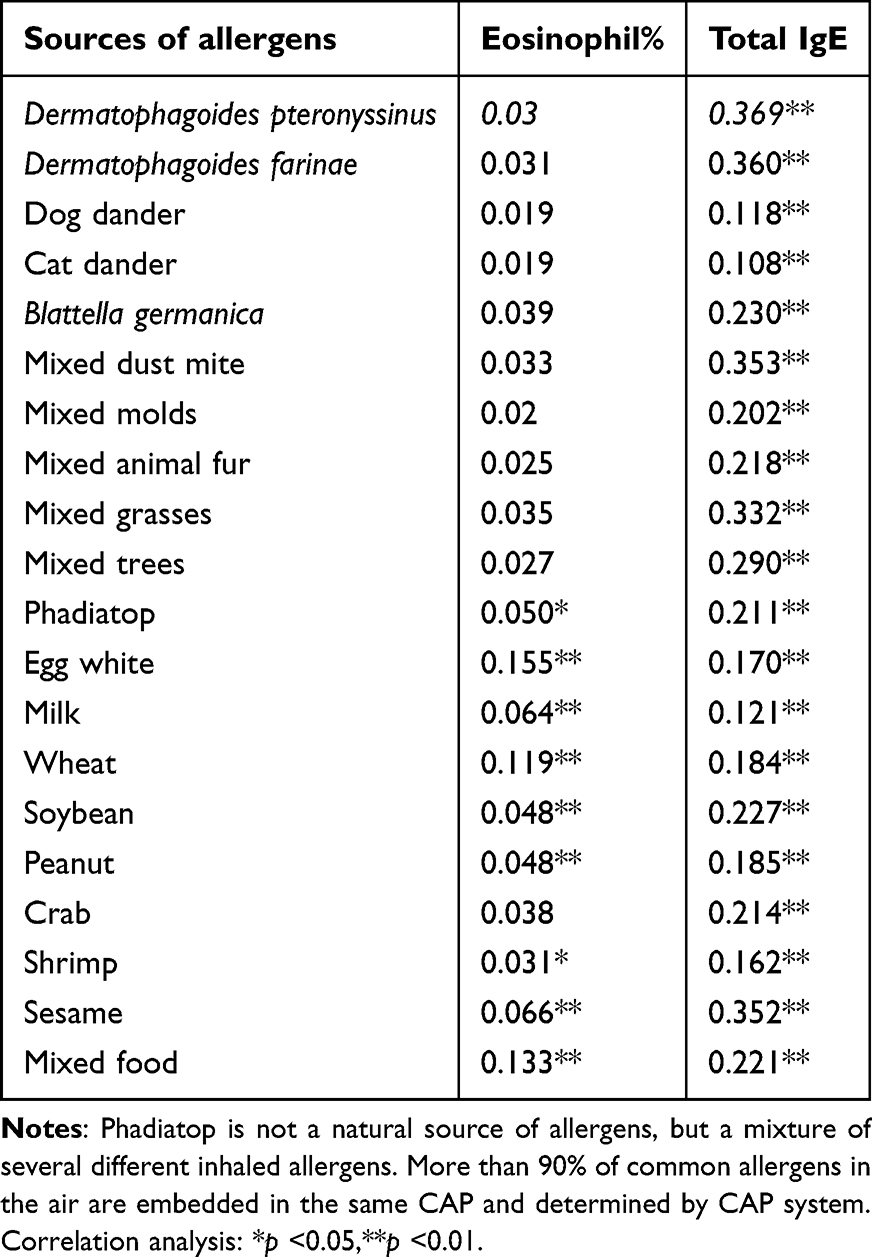 |
Table 4 Correlations Between the sIgE of Allergens and Other Indicators |
Discussion
Over recent decades, the incidence of allergic diseases has been increasing considerably worldwide. Detection of sIgE has been used widely in clinical practice to identify different sensitization profiles and avoid triggering factors. However, sensitization to different allergen species varies in different populations according to age, sex and season. This study showed the most common inhaled allergen species in children in central China were dust mites, molds, and dust mite mixtures. However, there were seasonal and sex-based differences.
Allergic disease results from hypersensitive reactions to inhalation or exposure to specific sources of allergens in the environment, the most common reactions being those mediated by IgE antibodies.13 The prevalence of allergic diseases has increased annually in recent years, causing enormous social and economic burdens.14 Additionally, different geographical environments, diets, and economic development statuses across different regions have led to large differences in the regional prevalence of allergen type.15–17 Therefore, it is critical to elucidate allergen-specific IgE distribution and characteristics of allergen species in specific regions, populations, and seasons for the diagnosis, treatment, and prevention of allergic disease.18–21
Allergen sensitization is not identical across different geographical regions.22 In the USA, the population is most sensitized to dust mites, house dust mites, and grass pollen; in Northern and Eastern Europe, cat dander, dog dander, and tree pollen are the most common;23,24 and in Western Europe, residents are most allergic to dust mites, house dust mites, and tree pollen.25–27 In this study, we found that the most common inhaled allergen species in children were dust mites, molds, and dust mite mixtures. Consistent with previous studies conducted in the US and Europe, the most commonly positive food allergen species found herein were milk, egg white, and wheat.28,29 Compared with other studies, sensitization to crabs and shrimp was relatively low, which may be related to the geographical environment of Zhengzhou, a central plain region in which many people prefer wheat and rice and are less interested in seafood. We also found that the sIgE-PR of sesame was higher than that of peanuts in Zhengzhou, which may be closely related to differences in diet structure, but was inconsistent with results reported in the literature.
This study showed that allergen types and sIgE-PRs vary by age. Food allergen species were the main reactants in infants and young children, and the sIgE-PRs of egg white and milk are much higher than those of other allergen species, which may be related to the increased permeability of the micromolecular proteins contained in eggs and milk. Children— particularly infants and young children— experience a period of growth and development. Due to insufficient gastrointestinal function, the intestinal mucosa of children is vulnerable to destruction, making them more susceptible to sensitization to such substances.30 However, the incidence of allergic diseases can be reduced to a certain extent by adhering to exclusive breastfeeding and the addition of complementary foods during infancy. With increasing age, children spend more time outdoors and are more likely to be exposed to various allergen species.31 The sIgE-PRs of food allergen species exhibited a downward trend and were replaced by mixed dust mites, tree pollen combinations, and other inhaled allergen species, which is consistent with domestic and foreign studies.32,33 Lastly, as rates of allergic reaction to cat and dog dander are increasing, it is recommended that families with allergic diseases try not to keep pets.
While the three most common allergen species in both males and females in this study were egg white, milk, and dust mites, the sex-specific sIgE-PRs for allergen species differed. Additionally, we found that males had a higher prevalence of allergic diseases than females, which is consistent with the results of other studies.34 Possible causes for this difference include lifestyle (exposure to different sources of allergens), genetic factors, sex hormone levels, environment, immune responses, and cross-reactivity. Previous studies have found that androgens have an anti-allergic effect and estrogen has a pro-allergic effect.35 During childhood, more males than females have allergic disease, whereas the number of female patients increases after puberty. However, the specific pathophysiological mechanisms behind these differences require further investigation.
This study showed that there were different types and sIgE-PRs of allergen species in children in different seasons, particularly for inhaled allergen species. The sIgE-PR of mixed molds was the highest in autumn, which may be related to the temperate continental monsoon climate of Zhengzhou. Long-term use of air conditioning and a lack of timely filter element replacement can foster mold reproduction; therefore, air quality, moisture, and ventilation must be considered in the living environments of children with mold allergies. Additionally, the sIgE-PR of the weed-pollen combination and tree-pollen combination was higher in autumn, which may be related to the peak pollen concentration in autumn in Zhengzhou, with high concentrations of pollen particles scattered in the air leading to an increased probability of sensitization. Therefore, children with pollen allergies are advised to wear a mask when going outside during the autumn pollen season.36 The sIgE-PR of dust mite mixed sources of allergens was the highest in winter, possibly because there were more haze days in winter, and dust could easily enter the room after a window is opened for ventilation, which is similar to research on children in Beijing.
We have searched for differences in sensitization for the sources of allergens with regard to sex, age and seasons group. Therefore, the prevention and treatment of allergen should consider the difference, combined with the clinical characteristics of children and laboratory testing, to make early diagnosis. Reasonable avoidance of high-risk the sources of allergens and the establishment of defensive barriers can reduce the pain and economic burden of children to a certain extent, and prevent and avoid more serious allergic diseases in adulthood.
This study had several limitations. First, only 20 sources of allergens were assessed, limiting comparability with other studies due to variations in allergen types and not all subjects were tested for 20 sources of allergens, which may lead to a certain degree of bias in the results of this study. Second, the study cohort was derived from a single center, not on behalf of all children with serum allergen sIgE distribution in central China. Furthermore, the study mainly focused on IgE-mediated sensitization and the potential underrepresentation of non-IgE-mediated mechanisms.37 Besides, the correlation between sIgE levels and the severity of allergic symptoms could not be explored as this study positive sIgE represent only sensitization, failed to combine clinical history confirm the actual circumstances of the clinical allergic. Thus, further research is warranted to carry out larger studies and more detailed questionnaire surveys, increase the types of allergen tested and conduct comprehensive analysis combined with clinical data of patients to provide more basis for clinical diagnosis and treatment and prevention, realizing precision and personalized medicine. In addition, it should be pointed out that although we regard Phadiatop complex as a source of allergens, Phadiatop complex is not a natural source of allergens. It is a mixture of several different inhaled allergens. More than 90% of common allergens in the air are embedded in the same CAP and determined by CAP system.38,39
Conclusion
By defining the variations in allergen prevalence and investigating the distribution characteristics and trends of these allergen species based on age, sex, and season, we elucidated the pediatric allergen distribution patterns and demonstrated the prevalence of specific sensitization and risk groups in children with allergic symptoms in central China. This information should aid healthcare providers and public health officials in devising targeted interventions for allergies in children and serves as a foundational framework for enhancing the prevention, diagnosis, and treatment of allergic conditions.
Data Sharing Statement
The datasets analyzed during this present study are available from the corresponding author on reasonable request.
Ethical Approval
The study was conducted according to the guidelines of the Declaration of Helsinki and was approved (2024-k-027) by the Hospital Ethics Review Board of Henan Children’s Hospital. We confirmed that all the data were anonymized and maintained with confidentiality. The requirement for informed consent has been waived by the Hospital Ethics Review Board of Henan Children’s Hospital because of the retrospective nature of the current study.
Funding
This work was supported by the Key Research, Development, and Promotion Projects of Henan Province (222102310067 and 222102310328), the Medical Science and Technology Project of Henan Province (LHGJ20230586, LHGJ20220750, LHGJ20220729, LHGJ20220764 and LHGJ20220774).
Disclosure
The authors declare that the research was conducted in the absence of any commercial or financial relationships that could be construed as a potential conflict of interest.
References
1. Mori F, Barni S, Saretta F, et al. Epidemiology of rare allergic diseases in children. Pediatr Aller Immu. 2020;31(S26):39–42. doi:10.1111/pai.13359
2. Platts-Mills TAE. The allergy epidemics: 1870-2010. J Allergy Clin Immunol. 2015;136(1):3–13. doi:10.1016/j.jaci.2015.03.048
3. Furuta Y, Yoshioka M, Sugiyama T, Miyasaka K. Rapidly increasing allergic diseases. Hokkaido Igaku Zasshi. 2005;80(1):3–7.
4. Sindher SB, Sharma R, Yarlagadda M, Chin AR, Chinthrajah RS. Recent mechanistic studies in allergic diseases. Int J Mol Sci. 2023;24(18):14312. doi:10.3390/ijms241814312
5. Shakhova NYV, Kamaltynova EM, Kashinskaya TYS. Prevalence of bronchial asthma and allergic diseases among children. Allergol Immunol Pediatr. 2022;(2):5–12. doi:10.53529/2500-1175-2022-2-5-12
6. Wu C, Huang H, Pan W, et al. Allergic diseases attributable to atopy in a population sample of asian children. Sci Rep. 2021;11(1):16052. doi:10.1038/s41598-021-95579-2
7. Yang M, Deng X, Wang S, Wang K, Niu W, Zhang Z. Risk factors for allergic diseases: a cross-sectional survey of 9501 Chinese preschool-aged children. Transl Pediatr. 2021;10(8):1989–2005. doi:10.21037/tp-21-124
8. Tikhonova RZ, Fayzullina RM. Risk factors and markers of inflammation of comorbid allergic diseases: rhinitis and bronchial asthma. Allergol Immunol Paediatr. 2023;(3):16–22. doi:10.53529/2500-1175-2023-3-16-22
9. Namyslowski A, Lipiec A, Zielinski W, et al. The importance of specific IgE antibodies in the epidemiology of allergic rhinitis and asthma (ecap survey): part four. The relationship between the concentration of specific ige antibodies in serum and types of asthma. Postepy Dermatol Alergol. 2023;40(5):611–616. doi:10.5114/ada.2023.130287
10. Li YZ, Zhang HY, Chen XX, et al. Study on the distribution pattern of allergen sIgE in patients with respiratory allergic diseases in a hospital in Shanxi Province. Chin J Prev Med. 2023;57(12):1978–1987.
11. Luo W, Hu H, Tang W, et al. Allergen sensitization pattern of allergic adults and children in southern China: a survey based on real life data. Allergy Asthma Clin Immunol. 2019;15:42. doi:10.1186/s13223-019-0357-y
12. The Editorial Board. Chinese Journal of Pediatrics, The Society of Pediatrics of Chinese Medical Association. Consensus on diagnosis and management of allergic diseases in children. Chin J Pediatr. 2019;57(3):164–171. doi:10.3760/cma.j.issn.0578-1310.2019.03.002
13. Chiu CY, Chan YL, Tsai MH, et al. Cross-talk between airway and gut microbiome links to IgE responses to house dust mites in childhood airway allergies. Sci Rep. 2020;10(1):13449. doi:10.1038/s41598-020-70528-7
14. Kang SY, Song WJ, Cho SH, Chang YS. Time trends of the prevalence of allergic diseases in Korea: a systematic literature review. Asia Pac Allergy. 2018;8(1):e8. doi:10.5415/apallergy.2018.8.e8
15. Li J, Sun B, Huang Y, et al. A multicentre study assessing the prevalence of sensitizations in patients with asthma and/or rhinitis in China. Allergy. 2009;64(7):1083–1092. doi:10.1111/j.1398-9995.2009.01967.x
16. Rotsides DZ, Goldstein IF, Canfield SM, et al. Asthma, allergy, and IgE levels in nyc head start children. Respir Med. 2010;104(3):345–355. doi:10.1016/j.rmed.2009.10.016
17. Pi JT, Song L. Aeroallergen spectrum for patients with allergic rhinitis in Chongqing. J Clin Otorhinol Head Neck Surg. 2018;32(1):64–68. doi:10.13201/j.issn.1001-1781.2018.01.013
18. Tseng YW, Er TK. Retrospective analysis of allergen distribution dynamics in central Taiwan. Br J Biomed Sci. 2023;80:12030. doi:10.3389/bjbs.2023.12030
19. Zhang X, Chen H, Liu S, et al. Allergen sensitization in children in Weifang, China: differences between monosensitization and polysensitization. J Asthma Allergy. 2023;16:397–410. doi:10.2147/JAA.S405549
20. Park DJ, Lee J, Kim SY, Kwon HJ, Lee HK, Kim Y. Evaluation of advansure alloscreen max panel with 92 different allergens for detecting allergen-specific ige. Am J Clin Pathol. 2019;151(6):628–637. doi:10.1093/ajcp/aqz023
21. Lambert C, Sarrat A, Bienvenu F, et al. The importance of EN ISO 15189 accreditation of allergen-specific IgE determination for reliable in vitro allergy diagnosis. Allergy. 2015;70(2):180–186. doi:10.1111/all.12546
22. Wang X, Zhou L, Wei G, Zhang H, Yang B. Prevalence of allergen-specific IgE in southern China: a multicenter research. Aging. 2021;13(14):18894–18911. doi:10.18632/aging.203341
23. Lo F, Bitz CM, Battisti DS, Hess JJ. Pollen calendars and maps of allergenic pollen in North America. Aerobiologia. 2019;35(4):613–633. doi:10.1007/s10453-019-09601-2
24. Pfaar O, Becker S, Calabria C, et al. Comparison of allergen immunotherapy practice patterns in inhalant allergies in the United States of America and Europe: similarities and differences 2023. World Allergy Organ J. 2023;16(5):100766. doi:10.1016/j.waojou.2023.100766
25. Pfaar O, Devillier P, Schmitt J, et al. Adherence and persistence in allergen immunotherapy (apait): a reporting checklist for retrospective studies. Allergy. 2023;78(8):2277–2289. doi:10.1111/all.15723
26. Suzuki S, Nwaru BI, Ekerljung L, et al. Characterization of sensitization to furry animal allergen components in an adult population. Clin Exp Allergy. 2019;49(4):495–505. doi:10.1111/cea.13355
27. Muddaluru V, Valenta R, Vrtala S, et al. Comparison of house dust mite sensitization profiles in allergic adults from Canada, Europe, South Africa and USA. Allergy. 2021;76(7):2177–2188. doi:10.1111/all.14749
28. Benninger MS, Daly T, Graffmiller K. Positivity rates of in vitro inhalant/respiratory and food allergy tests in the northern midwestern United States. Ear Nose Throat J. 2018;97(9):296–322. doi:10.1177/014556131809700919
29. Martinez-Pineda M, Yague-Ruiz C. The risk of undeclared allergens on food labels for pediatric patients in the European Union. Nutrients. 2022;14(8):1571. doi:10.3390/nu14081571
30. Sindher SB, Barshow S, Tirumalasetty J, et al. The role of biologics in pediatric food allergy and eosinophilic gastrointestinal disorders. J Allergy Clin Immunol. 2023;151(3):595–606. doi:10.1016/j.jaci.2023.01.007
31. Emelina YN. Sensitization to inhaled and food allergens in children. Russian J Immunol. 2020;23(2):217–224. doi:10.46235/1028-7221-262-STI
32. Na R, Shen YM, Si P, et al. Analysis of distribution characteristics of specific immunoglobulin E in 8 092 children with eczema and urticaria in a hospital of pediatric in Tianjin City. Chin J Prev Med. 2023;57(9):1385–1390. doi:10.3760/cma.j.cn112150-20221027-01042
33. Yi H, Liang Y, Xiao Y, et al. Detecting allergens IgE in infants and children with asthma and analyzing clinical significance. Chin J Immunol. 2019;35(3):340–344. doi:10.3969/j.issn.1000-484X.2019.03.018
34. Leffler J, Stumbles PA, Strickland DH. Immunological processes driving IgG sensitisation and disease development in males and females. Int J Mol Sci. 2018;19(6). doi:10.3390/ijms19061554
35. Ikuta K, Ejima A, Abe S, Shimba A. Control of immunity and allergy by steroid hormones. Allergol Int. 2022;71(4):432–436. doi:10.1016/j.alit.2022.07.006
36. Li Y, An Y, Hao Y, Zhang L, Ouyang Y. Prevalence of sensitization to specific allergens in allergic patients in Beijing, China: a 7-year retrospective study. Asian Pac J Allergy Immunol. 2021. doi:10.12932/AP-210621-1162
37. Jutel M, Agache I, Zemelka-Wiacek M, et al. Nomenclature of allergic diseases and hypersensitivity reactions: adapted to modern needs: an EAACI position paper. Allergy. 2023;78(11):2851–2874. doi:10.1111/all.15889
38. Crobach MJJS, Kaptein AA, Kramps JA, Hermans J, Ridderikhoff J, Mulder JD. The Phadiatop test compared with RAST, with the CAP system; proposal for a third Phadiatop outcome: “inconclusive”. Allergy. 1994;49(3):170–176. doi:10.1111/j.1398-9995.1994.tb00821.x
39. Chang Y-C, Lee T-J, Huang -C-C, Chang P-H, Chen Y-W, C-H F. The role of Phadiatop tests and total immunoglobulin E levels in screening aeroallergens: a hospital-based cohort study. J Asthma Allergy. 2021;14:135–140.
 © 2024 The Author(s). This work is published and licensed by Dove Medical Press Limited. The
full terms of this license are available at https://www.dovepress.com/terms.php
and incorporate the Creative Commons Attribution
- Non Commercial (unported, v3.0) License.
By accessing the work you hereby accept the Terms. Non-commercial uses of the work are permitted
without any further permission from Dove Medical Press Limited, provided the work is properly
attributed. For permission for commercial use of this work, please see paragraphs 4.2 and 5 of our Terms.
© 2024 The Author(s). This work is published and licensed by Dove Medical Press Limited. The
full terms of this license are available at https://www.dovepress.com/terms.php
and incorporate the Creative Commons Attribution
- Non Commercial (unported, v3.0) License.
By accessing the work you hereby accept the Terms. Non-commercial uses of the work are permitted
without any further permission from Dove Medical Press Limited, provided the work is properly
attributed. For permission for commercial use of this work, please see paragraphs 4.2 and 5 of our Terms.