")
Back to Journals » Drug Design, Development and Therapy » Volume 18
Tangzhiping Decoction Improves Glucose and Lipid Metabolism and Exerts Protective Effects Against White Adipose Tissue Dysfunction in Prediabetic Mice
Authors Wang C, An T, Lu C, Liu T, Shan X, Zhu Z, Gao Y
Received 7 April 2024
Accepted for publication 28 June 2024
Published 15 July 2024 Volume 2024:18 Pages 2951—2969
DOI https://doi.org/10.2147/DDDT.S462603
Checked for plagiarism Yes
Review by Single anonymous peer review
Peer reviewer comments 3
Editor who approved publication: Prof. Dr. Tin Wui Wong
Cuiting Wang,1,2 Tian An,1,2 Cong Lu,1,2 Tiantian Liu,1,2 Xiaomeng Shan,1,2 Zhiyao Zhu,1,2 Yanbin Gao1,2
1School of Traditional Chinese Medicine, Capital Medical University, Beijing, People’s Republic of China; 2Beijing Key Laboratory of TCM Collateral Disease Theory Research, Beijing, People’s Republic of China
Correspondence: Yanbin Gao; Zhiyao Zhu, School of Traditional Chinese Medicine, Capital Medical University, No. 10 You An Men Wai, Xi Tou Tiao, Feng Tai District, Beijing, 100069, People’s Republic of China, Tel +86 10 8391 1640 ; +86 10 8391 1626, Email [email protected]; [email protected]
Background: Prediabetes, characterized by a series of metabolic abnormalities, increases the risk of diabetes and cardiovascular diseases. Tangzhiping (TZP), a clinically validated traditional Chinese medicine formula, is used to treat impaired glucose tolerance. However, the underlying mechanism of TZP in intervening prediabetes is not fully elucidated.
Purpose: The current study aimed to evaluate the protective effect of TZP against prediabetes mice and explore its potential mechanism.
Methods: After establishing a prediabetic animal model through 12 weeks of high-fat diet (HFD) feeding, mice were subjected to TZP for 8 weeks. Various parameters related to body weight, glucose and lipid metabolism, and insulin sensitivity were measured. Histopathological examinations observed adipose cell size and liver lipid deposition. The Sable Promethion system assessed energy metabolism activity. Transcriptomic analysis of Epididymal white adipose tissue (EWAT) identified enriched pathways and genes. The key genes in the enriched pathways were identified through RT-PCR.
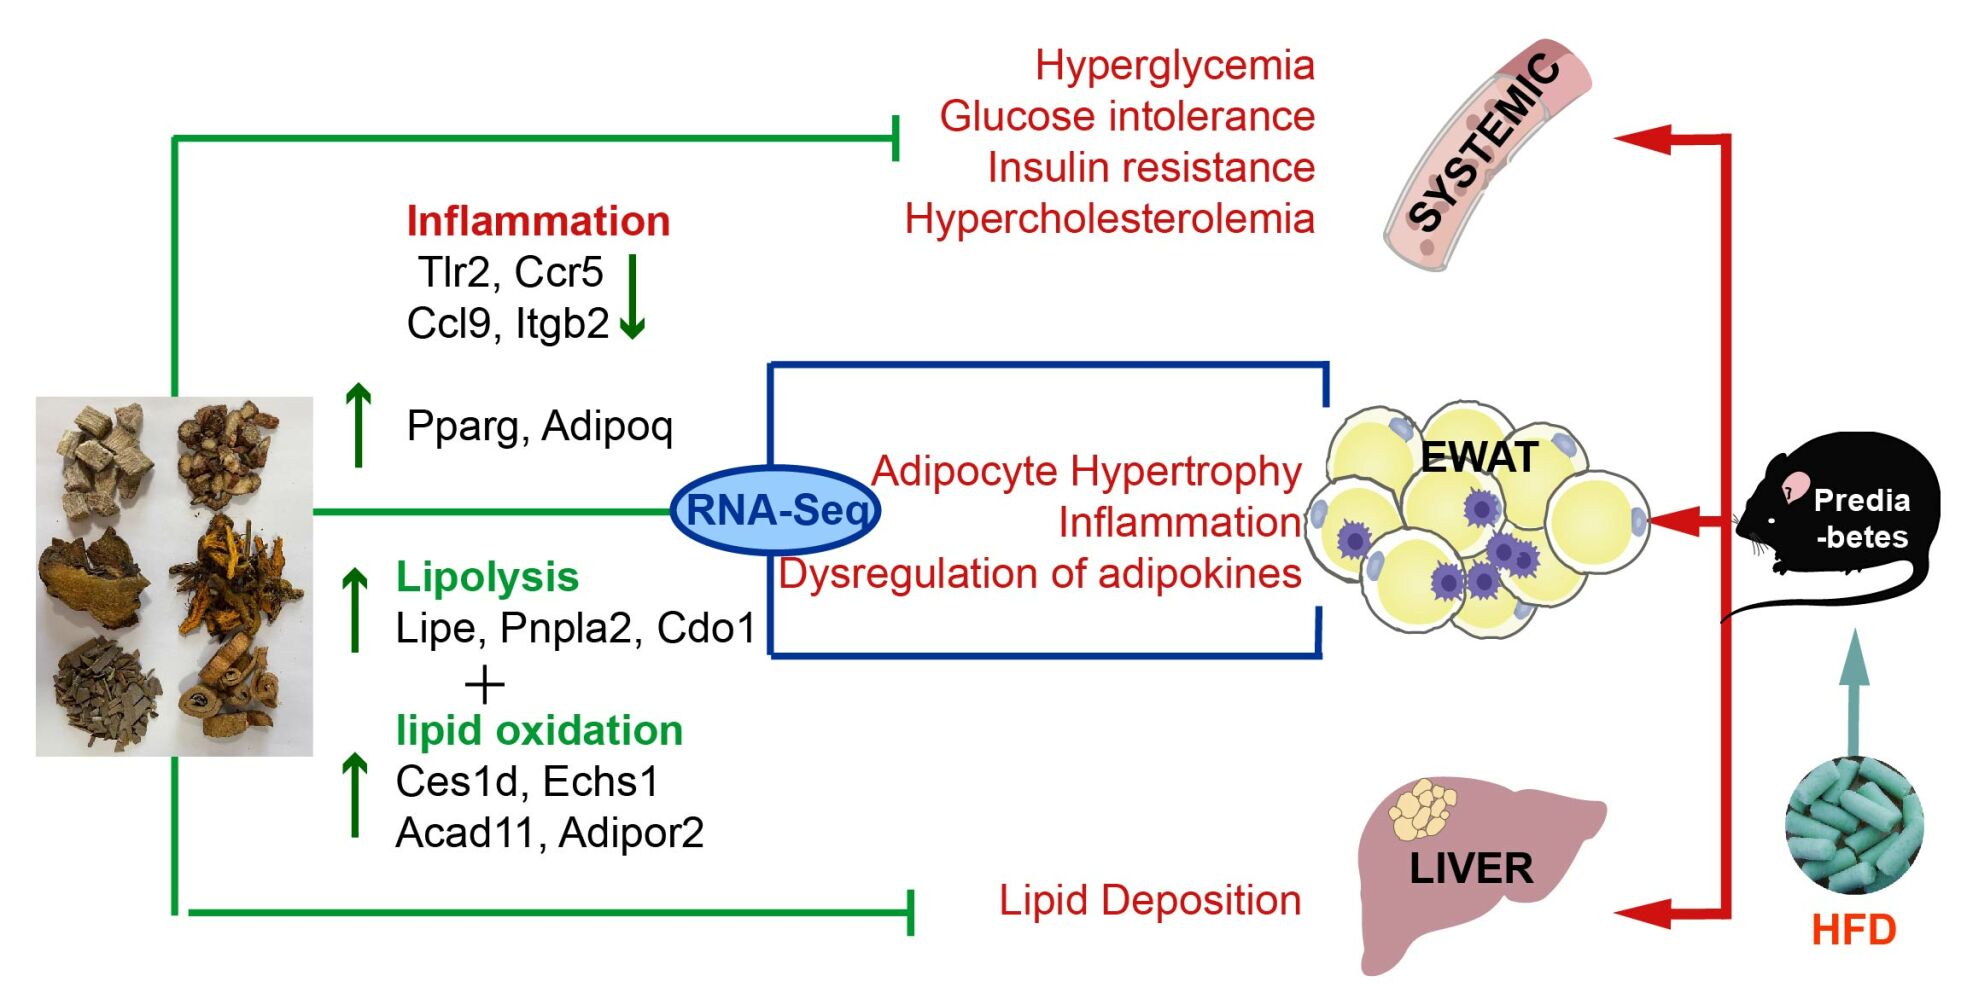
Results: Our data revealed that the administration of TZP reduced body weight and fat mass in a prediabetes mouse model. TZP normalized the glucose and insulin levels, improved insulin resistance, and decreased plasma TC and FFA. The alleviation of adipose tissue hypertrophy and lipid deposition by TZP was demonstrated through pathological examination. Indirect calorimetry measurements indicated a potential increase in VO2 and EE levels with TZP. The results of EWAT transcription showed that TZP reversed pathways and genes related to inflammation and catabolic metabolism. RT-PCR demonstrated that the mRNA expression of inflammation and lipolysis, including Tlr2, Ccr5, Ccl9, Itgb2, Lipe, Pnpla2, Cdo1, Ces1d, Echs1, and Acad11, were changed by TZP treatment.
Conclusion: TZP effectively alleviates obesity, impaired glucose and lipid metabolism, and insulin resistance. The effect of TZP might be associated with the regulation of gene expression in dysfunctional adipose tissue.
Keywords: traditional Chinese medicine, Tangzhiping, prediabetes, adipose tissue, inflammation, lipolysis
Graphical Abstract:
Introduction
Prediabetes, an intermediate state between normal glucose regulation and diabetes, encapsulates impaired fasting glucose (IFG), impaired glucose tolerance (IGT) and intermediate HbA1c level.1 Between 2017 and 2020, national surveys conducted in the United States among adults aged 18 years or older revealed an overall prediabetes prevalence of 38% in the population.2 The International Diabetes Federation projected that by 2045, the number of adults with IGT and IFG will reach 730 million and 441 million, respectively.3 Obesity and overweight status emerge as critical risk factors for prediabetes. A survey conducted in the United States revealed that more than 80% of individuals with prediabetes exhibited characteristics of obesity or overweight.4 Moreover, the escalating global rates of childhood and adolescent obesity are anticipated to contribute to an increased incidence of prediabetes.5 Prediabetes increases the risk of developing to type 2 diabetes mellitus (T2DM), accompanied by higher rates of cardiovascular diseases and microvascular complications, which pose a severe threat to overall health and longevity.6
Current first-line therapy for prediabetes is lifestyle adjustments that include weight loss and exercise or metformin.6 Sustaining high-intensity lifestyle interventions over the long term is challenging for prediabetic patients, while metformin interventions have certain side effects.6 Traditional Chinese Medicine (TCM) has gained interest for its potential in preventing and treating prediabetes due to its clinical application and low toxicity.7 One TCM concept, “pi dan”, documented in Huangdi Neijing, resembles prediabetes and is believed to be caused by overeating fatty and sweet foods, as well as obesity. Based on years of clinical observation and analysis, we propose that Tangzhiping (TZP), which functions to disperse blood stasis, reduce turbidity, and clear heat, is recommended as an effective intervention for this condition.8 The efficacy and safety of TZP were confirmed in a multicenter, large-sample, randomized controlled study.9 Furthermore, the previous animal study showed that TZP decreased fasting blood glucose and insulin levels in insulin-resistant rats.10 TZP is composed by six Chinese herbs, including Salvia miltiorrhiza Bunge (Chinese name: Danshen), Coptis chinensis Franch. (Chinese name: Huanglian), Morus alba L. (Chinese name: Sangbaipi), Pueraria lobata (Willd). Ohwi (Chinese name: Gegen), Euonymus alatus (Thunb). Siebold (Chinese name: Guijianyu), Rheum palmatum L. (Chinese name: Dahuang), in a ratio of 4:2:2:2:2:1. Pharmacological studies indicated that these herbs contained many bioactive compounds with hypoglycemic and anti-obesity effects.11,12 For instance, recent studies have shown that Salvianolic acid B from Salvia miltiorrhiza Bunge can prevent the development of obesity and diabetes by regulating gut microbiota abundances and the LPS/TLR4 signaling pathway.13,14 Berberine, found in Coptis chinensis Franch, can remodel adipose tissue by activating sirtuin3, thereby protecting mice fed a high-fat diet from obesity, insulin resistance, and hyperlipidemia.15 Additionally, Kaempferol, present in Morus alba L., has been reported to have anti-diabetic and anti-inflammatory effects.16 However, the main active components and potential molecular mechanisms of TZP remain to be elucidated.
The pathophysiology of prediabetes is complex, with insulin resistance (IR) and β-cell dysfunction being crucial mechanisms for development and prognosis. Chronic IR primarily results from an imbalance between energy intake and expenditure, despite the involvement of genetic susceptibility.17 Recent a study has shown that there is a significant causal relationship between obesity and prediabetes as well as insulin resistance.18 White adipose tissue (WAT) not only serves as the site for energy storage and utilization, but also as an endocrine and inflammatory organ, that regulates systemic energy and metabolism.19 During obesity, WAT experiences severe functional dysregulation and fail to regulate metabolic homeostasis.20 On the one hand, Dysfunctional adipose tissue fails to appropriately expand for excess lipid storage, which leads to the storage of excess fat in other organs and then disturbs the functions of these organs. For instance, lipid deposition in the liver inhibits insulin receptor kinase and induces hepatic IR, resulting in increased gluconeogenesis, decreased glycogen synthesis, and elevated endogenous glucose.17 The increased glucose in hepatocytes can further enhance intrahepatic lipid production through de novo lipogenesis, exacerbating insulin sensitivity.21 The excess fat can also accumulate in the pancreas and contribute to β-cell dysfunction, which directly participates in the pathogenesis of prediabetes.22 On the other hand, nutritional excess triggers uncontrolled inflammatory responses in WAT, leading to chronic low-grade inflammation.23 The primary role for subclinical inflammation in the pathogenesis of diseases related to prediabetes and diabetes has supported in many studies.24 Therefore, the adipose tissue plays a crucial role in pathophysiological mechanisms of prediabetes. It is imperative to address adipose tissue dysfunction in the context of obesity for the prevention and treatment of prediabetes.
Transcriptomic analysis of mRNAs enables the identification of a wide range of gene expression changes, facilitating in uncovering therapeutic targets and pathways of traditional Chinese herbal formulations.25 To assess the efficacy and potential mechanisms of TZP in HFD-induced prediabetic mice, we replicated the prediabetic model induced by an HFD, evaluated the impact of TZP on metabolism and energy in prediabetic mice, and then examined adipose tissue gene expression using RNA-Seq.
Materials and Methods
Preparation and Quality Control of TZP
Salvia miltiorrhiza Bunge, Coptis chinensis Franch., Morus alba L., Pueraria lobata (Willd). Ohwi, Euonymus alatus (Thunb). Siebold, and Rheum palmatum L. were provided by Beijing Hospital of Traditional Chinese Medicine (Beijing, China) and identified by Associate Professor Feng Qiu, School of Traditional Chinese Medicine, Capital Medical University. The plant name was checked with https://mpns.kew.org. Following the human equivalent dose conversion as per the Fourth Edition of the Experimental Methodology of Pharmacology, the daily low, medium, and high dosage of TZP for mice were 5.3, 10.6, and 21.2 g crude herb/kg/d. For preparation of TZP, the herbs were initially immersed in water for 1 h and then boiled twice. Following filtration, the resulting decoction was concentrated. Fresh decoction was prepared weekly and stored at 4°C. Prior to gavage, the decoction was heated in 37°C water bath.
The primary chemical constituents of TZP were identified through the ultra-high performance liquid chromatography-quadrupole-time of flight mass spectrometry (UPLC-Q-TOF-MS) analysis. Decoction of TZP was added to 70% methanol and centrifuged to obtain supernatant for subsequent analysis. UPLC analysis was conducted using an Agilent 1260 High Performance Liquid Chromatograph system (Agilent Technologies, USA) with chromatographic separation achieved on an Acquity UPLC HSS T3 column (100 mm × 2.1 mm, 1.8 µm). The mobile phases comprised 0.1% formic acid in water (solution A) and 0.1% formic acid in acetonitrile (solution B) with a flow rate of 0.3 mL/min. The gradient elution at various time points is detailed in Table S1. The UPLC system was coupled to a Quadrupole Time-of-Flight Mass Spectrometer (Bruker, Germany) featuring an electrospray interface operating in positive- and negative-ion modes. The instrumental conditions included IonSpray Voltage set at 5500 V (ESI+) and −4500 V (ESI-), while Curtain Gas, Ion Source Gas 1, and Ion Source Gas 2 utilized nitrogen gas at 30, 60, and 60 psi, respectively. The ion source temperature was maintained at 600°C, and the dwell time for each channel in MRM mode was set to 20 ms. Post-spectral acquisition, chemical composition identification was conducted with reference to the Chinese Pharmacopoeia (2020 edition) and pertinent literature.
Mice and Experimental Design
Male Five-week-old C57BL/6J mice weighing 17–21 g were purchased from Beijing Vital River Laboratory Animal Technology Co., Ltd., Beijing, China (Certificate No. SYXK(JING)2021-0030). The mice were housed in a specific pathogen-free (SPF) facility under standard conditions of 22 ±2°C with a humidity 50% ± 5% in a 12 h light/dark cycle. After a week of acclimatization, 8 mice were randomly assigned to the Con group and fed standard diet (SD) (10 kcal% fat, D12450B, Research Diet, USA), while the remaining mice were fed a HFD (60 kcal% fat, D12492, Research Diet, USA) for 12 weeks to induce the prediabetic mouse model (the ingredients of SD and HFD are provided in Tables S2 and S3).26,27
After 12 weeks, the mice fed a HFD were randomly divided into the following groups: pre-DM (n=8), Met (150 mg/kg/d, n=8; metformin), TZP-L (5.3 g/kg/d, n=8), TZP-M (10.6 g/kg/d, n=8), and TZP-H (21.2 g/kg/d, n=8). The Con and pre-DM groups received distilled water as a vehicle control. All groups were administered once daily for 8 weeks via intragastric gavage. The animal experimental procedures were approved by the Animal Ethics Committee of Capital Medical University (NO. AEEI-2022-022). Monitoring of body weight and food intake was conducted consistently over the course of the experiment. Fat and lean mass were examined by EchoMRI (Whole Body Composition Analyzers, Houston, USA) at the end of 8 weeks. At the end of the treatment period, the mice fasted overnight were sacrificed after anesthesia, and epididymal white adipose tissue (EWAT), liver, and blood samples were collected from each individual mouse.
Glucose Tolerance Test and Insulin Tolerance Test
Glucose tolerance tests (GTT) were conducted on mice overnight at both 0 and 8 weeks of medicine administration. Mice were orally administered 20% glucose (2 g/kg body weight) via a gavage needle. At 0, 30, 60, and 120 min, blood samples were obtained from tail veins, and glucose levels were assessed using a handheld glucometer (Roche Accu-Chek Blood Glucose Meter, Roche Diagnostics, Basel, Switzerland). The calculation of the area under the blood glucose concentration curve (AUC) involved utilizing the formula:  .
.
Insulin tolerance tests (ITT) were conducted on mice after a 4–6 h fast at the 7th week of medicine administration. Intraperitoneal administration of insulin (0.75 U/kg body weight) was performed on mice. After insulin injection, tail-blood glucose concentrations were assessed using a glucometer at intervals of 0, 15, 30, 60, and 120 min. The AUC was calculated using the formula:  .
.
Metabolic Activity
Metabolic activity was investigated using the Sable Promethion Small Animal Metabolic Measurement Analysis System (Sable Systems International, Las Vegas, Nevada, USA). Mice were individually housed for 24 h to acclimate to the system before the metabolic chamber studies. Oxygen consumption (VO2), carbon dioxide production (VCO2), and energy expenditure (EE) were recorded at 5 min intervals throughout the entire measurement period.
Biomedical Measurement
The blood samples were centrifugation at 3000 rpm for 15 min at 4°C to obtain serum. Subsequently, serum triglycerides (TG), total cholesterol (TC), low-density lipoprotein (LDL), high-density lipoprotein (HDL), and glucose were quantified using a fully automated biochemical analyzer (Chemray 240, Rayto Life and Analytical Sciences Co., Ltd., China). Non-esterified fatty acids (FFA) in the serum were quantified using a biochemical assay kit (A042-2-1, Nanjing Jiancheng Bioengineering, China). Levels of serum insulin and adiponectin (ADP) were determined through enzyme-linked immunosorbent assay (ELISA) kits (CEA448Mu, SEA605Mu, Cloud-Clone Corp., Wuhan, China). Moreover, serum TNFα levels were assessed using a mouse TNFα ELISA kit without coating (88–7324, Invitrogen, USA). Finally, the homeostatic model assessment for insulin resistance (HOMA-IR) was calculated employing the formula (HOMA-IR = FBG level (mmol/L) × fasting insulin level (mU/L)/22.5). For the determination of TG content in liver tissue, a tissue cell triglyceride enzyme assay kit (E1013, Beijing Pulilai Gene Technology Co., Ltd., China) was employed. All assays were conducted in strict adherence to the manufacturer’s instructions.
Histological Examinations
WAT and liver tissue were fixed in a 4% paraformaldehyde solution. Subsequently, the fixed tissues were embedded in paraffin and meticulously sectioned into 5-micrometer-thick slices. Following standard procedures, these sections were subjected to staining hematoxylin and eosin (H&E). Liver tissues, preserved at −80°C, were embedded in OCT, sectioned, and stained with Oil Red O. All sections were thoroughly then scanned using a Pannoramic scan (3D HISTECH, Hungary). The quantitative assessment of adipocyte size in white adipose tissue sections was carried out with precision using Image-Pro Plus software.
Immunofluorescence Staining
The EWAT sections were baked at 60°C for 1 h, followed by deparaffinization with xylene and rehydration. Antigen retrieval was accomplished by exposing the sections to EDTA solution (pH 9.0) for 23 min, facilitated by microwave heating. Following a 30 min block with bovine serum albumin, the sections were incubated overnight at 4 °C with the primary antibody against PLIN2 (1:1000; 15294-1-ap; Proteintech). After incubation with primary antibody, the sections were labeled with an HRP-tagged secondary antibody (1:500, GB23303, Servicebio) and Cy3-labeled Tyramide Signal Amplification (1:500, G1223, Servicebio) to enhance fluorescence signals. A secondary round of antigen retrieval in EDTA solution (pH 8.0) was performed via microwave heating to eliminate bound antibodies. After an additional overnight incubation with the F4/80 primary antibody (1:200; GB113373, Servicebio) at 4°C, the sections were further incubated with a fluorescent dye-conjugated secondary antibody (1:400; GB25303; Servicebio). Nuclear staining was achieved using DAPI (G1012, Servicebio). Upon spontaneous fluorescence quenching, the sections were sealed. These images were acquired using an inverted fluorescence microscope (Leica DM6000 CS, Leica, Germany).
Transcriptomics
After 8 weeks of TZP treatment, mice from the Con, pre-DM, and TZP-H groups (n = 4 each) were euthanized to collect EWAT. Total RNA preparation and RNA-seq were executed through the service provided by Novogene Co., Ltd., utilizing the Illumina NovaSeq 6000 platform. Total RNA was extracted from EWAT using TRIzol reagent, adhering to standard procedures. The integrity and quantity of total RNA from each group were scrutinized using the Agilent 2100 Bioanalyzer (Agilent 5400, Agilent Technologies Inc., USA), with all samples meeting the quality standards for library preparation and sequencing. The NEBNext® Ultra™ RNA Library Prep Kit (E7530L, NEB, USA) was employed for RNA-seq library preparation. The protocol encompassed polyA tailing, mRNA enrichment, mRNA fragmentation, cDNA synthesis, and subsequent steps such as end repair, A-tailing, adapter ligation, and PCR amplification. The constructed libraries underwent initial assessment for insert size using the Agilent 2100 Bioanalyzer, followed by quantification of concentration through RT-PCR to ensure the generation of high-quality libraries. Subsequently, sequencing was performed using the Novaseq-PE150 technology.
Clean data obtained after quality control were aligned to the Mouse Genome version 10 (mm10) reference genome. Gene expression levels were estimated using FPKM values. The subsequent steps of differential gene expression analysis and functional enrichment analysis were diligently conducted using the Novogene platform (https://magic.novogene.com/).
Real-Time Quantitative Polymerase Chain Reaction (RT-PCR) Analysis
The RNA was extracted from EWAT using the Tissue RNA Purification Kit (EZB-RN001A, EZBioscience, USA). Subsequently, the isolated RNA underwent reverse transcription into cDNA utilizing the PrimeScript™ RT Master Mix (RR036A, Takara Bio, Japan). Primer sequences were designed using DNAMAN Version 7 software, and the specific primer information can be found in the Table S4. Following with the manufacturer’s instructions, RT-PCR was conducted using the TB Green® Premix Ex Taq™ II (RR820A, Takara Bio, Japan). The ensuing data analysis was carried out using the 2^−ΔΔCT method, a widely acknowledged approach in molecular biology for relative quantification.
Statistical Analysis
All data were reported as mean ± SEM. Statistical analyses were performed using SPSS software. Normality was assessed using the Shapiro–Wilk test, and homogeneity of variance was evaluated. Based on these assessments, one-way ANOVA was employed for normally distributed data with homogeneous variance, followed by the least significant difference (LSD) test for post hoc comparisons. For normally distributed data without homogeneity of variance, Welch ANOVA or Brown-Forsythe ANOVA was used, followed by Tamhane’s T2 test. For non-normally distributed data, the Kruskal–Wallis test was applied, with the Bonferroni method used for p-value adjustment. A p-value < 0.05 was considered statistically significant. Graphs were generated using GraphPad software.
Results
The UPLC-Q-TOF-MS Analysis of TZP
Figure 1 displayed the total ion chromatograms of TZP under both positive-ion (A) and negative-ion (B) modes. The identified biochemical components substantiate the incorporation of diverse herbs in the TZP formulation. The detected cryptotanshinone, salvianolic acid B, and rosmarinic acid were directly linked to the active constituents present in Danshen. Furthermore, a comprehensive determination of six active components from Huanglian was carried out, namely, berberine, epiberberine, coptisine, palmatine, jatrorrhizine, and columbamine. Emodin, aloe-emodin, rhein, and chrysophanic acid were identified, demonstrating the presence of active ingredients sourced from Dahuang. The active components of Gegen were also part of the analyzed sample, specifically puerarin, daidzin, daidzein, and 3’-methoxypuerarin. Lastly, the active ingredients derived from Sangbaipi (mulberroside A, kuwanon G, kaempferol) and Guijianyu (kaempferol) were detected. This comprehensive analysis affirmed the complex multi-herb composition of TZP and provided a basis for understanding the pharmacological properties and potential therapeutic benefits.
 |
Figure 1 Identification of biochemical components in TZP using UPLC-Q-TOF-MS. Typical Total Ion Chromatogram (TIC) in positive (A) and negative (B) modes. Components: 1. Mulberroside A; 2. Daidzin; 3. Puerarin; 4. 3’-Methoxypuerarin; 5. Daidzein; 6. Chrysophanic acid; 7. Rhein; 8. Aloeemodin; 9. Rosmarinic acid; 10. Columbamine; 11. Epiberberine; 12. Coptisine; 13. Salvianolic acid B; 14. Palmatine; 15. Berberine; 16. Emodin; 17. Kaempferol; 18. Cryptotanshinone; 19. Kuwanon G; 20. Jatrorrhizine. |
Effects of TZP on Body Weight, Fat Mass and Adipocyte Size of Mice Models of Prediabetes
A murine model of pre-diabetes was established by feeding mice with a HFD for 12 weeks, followed by an 8 weeks treatment with medication (Figure 2A). The mice subjected to a HFD for 12 weeks showed a notable increase in body weight and more pronounced glucose disorders, encompassing IFG and IGT, in comparison to those on a SD (Figure S1A–D).
 |
Figure 2 The effects of TZP on body weight, fat tissue weight and adipose tissue histology in prediabetic mice. (A) Experimental Design. (B) Comparison of body weight among mice in diverse groups (n = 8). (C) Measurement of fat mass and lean mass using whole-body echo MRI analysis (n = 6–8). (D) Hematoxylin and Eosin (HE) staining of Epididymal White Adipose Tissue (EWAT) with a magnification of ×200 and ×400 (n = 5). (E) Adipocyte size measured using Image-Pro-Plus. *p < 0.05 and ***p < 0.001 vs Con group; #p < 0.05, ##p < 0.01, ###p < 0.001 vs pre-DM group; †p < 0.05 vs Met group. |
The body weight variation in mice over 8 weeks intervention is exhibited in Figure 2B. During weeks 0 to 8, the HFD significantly increased body weight compared to mice fed the SD. By week 8, the increased weight in the pre-DM group was significantly alleviated by TZP (L, M, H) and MET treatment. Meanwhile, food intake in the various intervention groups of the HFD was no significant difference (Figure S2A). Body composition analysis, conducted by whole-body echo MRI (Figure 2C), revealed that the fat mass in mice from the Met and TZP (L, M, H) groups was noticeably lower than that in the pre-diabetes (pre-DM) group. Additionally, no significant differences were observed in lean mass and body length (Figure S2B) among the diverse HFD-fed groups. The reduced body weight in TZP-administered mice predominantly resulted from a decrease in fat mass, without body length or lean body mass. H&E staining experiments demonstrated that the adipocyte size in EWAT in the pre-DM group was larger than that in the control group (Figure 2D and E). In contrast, the adipocyte size in pre-DM mice supplemented with Met and TZP was much smaller than that in the pre-DM group (Figure 2D and E). Moreover, there was no significant difference in the reduction of body weight, fat mass, and adipocyte size between the TZP-H group and the Met group. These Results indicated that TZP effectively reduced body weight and adiposity in HFD-induced prediabetic mice.
Effects of TZP on Glucose Metabolism and Insulin Resistance of Prediabetic Mice
To assess the impact of TZP on insulin sensitivity in prediabetic mice, we conducted GTT and ITT at end of the treatment. Each group of four randomly selected mice exhibited varying levels of average blood glucose (Figure 3A and C) and AUC in both tests (Figure 3B and D). Notably, mice in the pre-DM group demonstrated higher AUC values in both GTT and ITT compared to the Con group, whereas those in the TZP group exhibited lower AUC values than the pre-DM group. These observations suggested a potential effect of TZP in regulating blood glucose and insulin levels. Additionally, following 8 weeks of treatment, we evaluated FBG and plasma insulin levels (Figure 3E and F), and calculated the HOMA-IR index (Figure 3G). These parameters significantly increased in the pre-DM group compared to the Con group. However, the levels of these parameters were significantly reduced in the TZP-H group compared to the pre-DM group. Notably, the effects of TZP-H on FBG and HOMA-IR index were similar to those of metformin in pre-diabetic mice. Furthermore, TZP-H demonstrated a superior effect in reducing insulin levels compared to metformin. The above results showed that TZP regulated blood glucose homeostasis and improved insulin resistance in prediabetic mice.
 |
Figure 3 TZP restores glucose tolerance and ameliorates insulin resistance in prediabetic mice. (A) Glucose tolerance was assessed through a Glucose Tolerance Test (GTT) at 8 weeks, (B) with the calculation of the Area Under the Curve (AUC) (n = 4). (C) An Insulin Tolerance Test (ITT) was performed at 7 weeks, (D) and the AUC of ITT was computed accordingly (n = 4). (E) Evaluations included measurements of Fasting Blood Glucose (FBG) (n = 6), (F) serum insulin levels (n = 6), (G) and the Homeostatic Model Assessment of Insulin Resistance (HOMA-IR) index (n = 6). ***p < 0.001 vs Con group; #p < 0.05, ##p < 0.01, ###p < 0.001 vs pre-DM group; †p < 0.05 vs Met group. |
Effects of TZP on Serum Lipid Level and Hepatic Lipid Accumulation of Prediabetic Mice
Lipid levels in both serum and liver were assessed during the 8th week of treatment. The pre-DM group displayed significantly higher serum levels of TC, TG, LDL, and FFA, along with lower serum levels of HDL compared to the Con group. Notably, TZP treatment led to a marked decrease in TC, LDL, and FFA and an increased in HDL compared to the pre-DM group (Figure 4A–E). There were no statistically significant differences in TC, LDL, and HDL levels between the TZP-H group and the Met group. Additionally, the hepatic TG content was lower in the TZP group compared to the pre-DM group, similar to the Met group (Figure 4F). These biochemical improvements were supported by histological examinations, as evidenced by H&E and Oil Red O staining of the liver (Figure 4G). The pre-DM group exhibited significant hepatocellular vacuoles and lipid droplets. In contrast, livers from TZP- and Met-treated mice showed noteworthy reductions in hepatocellular vacuoles and smaller lipid droplets compared to the pre-DM group. These findings suggested that TZP exerted protective effects against dysregulated lipid metabolism in prediabetic mice.
 |
Figure 4 Improved Serum Lipid Metabolism and Hepatic Steatosis by TZP in Prediabetic Mice. (A) Serum alterations in Total Cholesterol (TC) (n = 6), (B) Triglycerides (TG) (n = 6), (C) low-density lipoprotein (LDL) (n = 6), (D) high-density lipoprotein (HDL) (n = 6), and (E) Free Fatty Acids (n = 6) for each group were assessed, (F) along with hepatic TG levels (n = 5). (G) Representative images of H&E staining and Oil Red O staining are presented. *p < 0.05 and ***p < 0.001 vs Con group; #p < 0.05, ##p < 0.01, ###p < 0.001 vs pre-DM group; †p < 0.05 vs Met group. |
Effects of TZP on Energetic Disorders of Prediabetic Mice
Indirect calorimetry measurements were conducted over a 24 h period to evaluate whole-body energy expenditure in various groups at the end of treatment period. Each group of three randomly selected mice exhibited different levels of VCO2, VO2, and EE during the indirect calorimetry assessment. Notably, the pre-DM group showed higher levels of VCO2, VO2, and EE compared to the Con group, as illustrated in Figure 5A–F. Throughout the day and night, the prediabetic mice treated with TZP displayed a rising trend in O2 consumption and exhaled CO2 compared to the pre-DM mice, leading to increased energy expenditure (Figure 5A–F). These findings suggested a potential enhancement of TZP on energy expenditure in prediabetes.
 |
Figure 5 TZP enhances energy expenditure. (A and B) VO2, (C and D) VCO2, (E and F) EE levels were measured using an indirect calorimeter. n = 3. |
TZP Reverses Transcriptome Alterations in WAT of Prediabetic Mice
To investigate the potential mechanisms by which TZP protected prediabetic mice from obesity and glucose and lipid dysmetabolism, we conducted a comprehensive transcriptomic analysis of EWAT. Samples were collected from the Con group, pre-DM group, and TZP-H group (representing TZP treatment) at the intervention endpoint. Differentially Expressed Genes (DEGs) were identified based on three conditions: a minimum mean group expression greater than 0.5 FPKM in at least one group, an adjusted p value of <0.05, and a fold change of at least 1.5. The pre-DM group, in comparison to the Con group, manifested 2130 upregulated and 1588 downregulated DEGs. Concurrently, TZP treatment led to significant alterations in gene expression (TZP/pre-DM: 837 upregulated and 1351 downregulated DEGs). The resulting Volcano plots vividly illustrated changes in DEGs in pre-DM/Con and TZP/pre-DM (Figure 6A). We then identified the intersections of differentially expressed genes in EWAT between the pre-DM group and Con group (pre-DM/Con) and between the TZP-treated group and pre-TZP group (TZP/pre-DM), as shown in a Venn diagram (Figure 6B). Among the 2130 upregulated DEGs in prediabetic mice, 1140 were downregulated by TZP treatment. Similarly, out of the 1588 downregulated DEGs in prediabetic mice, 643 were upregulated by TZP treatment. A total of 1783 differently expressed genes among the three groups underwent cluster analysis (Figure 6C). The results unveiled that these altered mRNAs were attributed to TZP, and the implicated DEGs might play a key role in HFD-induced prediabetes.
 |
Figure 6 DEGs regulated by TZP. (A) Volcano plots of differentially expressed genes (DEGs) in pre-DM/Con and TZP/pre-DM. (B) 1140 down-regulated and 643 up-regulated DEGs by treatment with TZP. (C) Heatmap of 1783 crossed-differently expressed genes in the three groups. |
Furthermore, gene ontology (GO) analysis and KEGG pathway enrichment analysis were conducted to elucidate the crucial functional pathways of DEGs induced by TZP treatment. The results revealed the top-level GO terms and KEGG pathways between the TZP and Pre-DM groups. In biological processes (BP), the downregulated DEGs were primarily enriched in inflammation and immune response, including the regulation of leukocyte activation, positive regulation of cytokine production, adaptive immune response, leukocyte-mediated immunity, and regulation of the inflammatory response, as shown in Figure 7A. Similarly, these downregulated genes were enriched in inflammatory pathways, including Cytokine-cytokine receptor interaction, Chemokine signaling pathway, Natural killer cell-mediated cytotoxicity, B cell receptor signaling pathway, Toll-like receptor signaling pathway, and more in the KEGG analysis (Figure 7B). As anticipated, up-regulated DEGs (Figure 7C) were enriched in anti-inflammatory-related pathways (AMPK signaling pathway and PPAR signaling pathway) and metabolism-related pathways (Fatty acid metabolism, Regulation of lipolysis in adipocytes, Insulin signaling pathway, etc). The top significantly enriched BP terms further indicated the vital role of metabolic pathways, particularly in catabolism. The most highly enriched terms included small molecule catabolic process, organic acid catabolic process, lipid catabolic process, cellular lipid catabolic process, fatty acid catabolic process, and more (Figure 7D). It is noteworthy that upregulated genes were also involved in oxidation mechanisms, such as fatty acid oxidation, lipid oxidation, fatty acid beta-oxidation, and acyl-CoA metabolic process (Figure 7D).
 |
Figure 7 Enrichment results of DEGs. (A and B) GO and KEGG annotations of common DEGs from the comparison of TZP downregulation vs pre-DM (red, down-regulated). (C and D) KEGG and GO annotations of common DEGs from the comparison of TZP upregulation vs pre-DM (blue, up-regulated). (E) Heatmap of prediabetes-related DEGs for the three experimental groups. |
The heatmap (Figure 7E) visually represented the significant up- and down-regulated genes associated with representative pathways influenced by TZP in prediabetic mice. Among the inflammation-related genes were Tlr6/8/2, Ccr5/3/1, Ticam2, Tnfrsf1b, Tnfrsf11a, Itgb2, Tnfsf13, Ccl9/3, Cxcl14, Pparg, and Adipoq. Simultaneously, Enrichment analysis identified Lipe, Pnpla2, Cdo1, Ces1d, Echs1, Ehhadh, Eci3, Pxmp2, Phyh, Pex3, Hibch, Acad11, Acad10, and Adipor2, involved in lipolysis and fat oxidation.
The Effects of TZP on Inflammation and Lipolysis in Adipose Tissue
Transcriptome sequencing results showed the regulatory role of TZP in genes associated with visceral fat inflammation and lipolysis. To validate these findings, we performed RT-PCR analysis and immunological experiments on relevant genes. Consistent with RNA-seq outcomes, TZP reduced pro-inflammatory gene expression (Tlr2, Ccr5, Ccl9, Itgb2) and increased anti-inflammatory gene expression (Pparg and Adipoq) in the EWAT of prediabetic mice (Figure 8A). Immunofluorescence staining of EWAT showed fewer crown-like structures in mice treated with TZP compared to prediabetic mice (Figure 8C). Moreover, the Elisa results indicated a decrease in TNFα and an increase in adiponectin serum levels in TZP-treated mice compared to the pre-DM group (Figure 8D and E). We also conducted an RT-PCR on genes associated with lipolysis (Lipe, Pnpla2) and oxidative metabolism (Cdo1, Ces1d, Echs1, Acad11, Adipor2). The results further validated the RNA-seq findings, indicating a significant upregulation by TZP in prediabetic mice (Figure 8B).
 |
Figure 8 Effects of TZP on mRNA levels of inflammation- and catabolism-related DEGs and proteins. (A and B) RT-PCR validation of the specific DEGs (n = 5). (C) Images of EWAT stained by immunofluorescent staining in different groups (the arrow indicates the location of the crown-like structure). (D) serum Tumor Necrosis Factor-alpha (TNFα) level (n = 6); (E) serum adiponectin (ADP) level (n = 6). *p < 0.05, **p < 0.01, and ***p < 0.001 vs Con group; #p < 0.05, ##p < 0.01, ###p < 0.001 vs pre-DM group. |
The Effects of Salvianolic Acid B on Glucolipid Metabolism
The 20 main chemical components in TZP were identified by UPLC-Q-TOF-MS. We selected salvianolic acid B (SalB) to evaluate its therapeutic effects on prediabetic mice (Figure S3A and B). After an 8-week administration of SalB, the SalB group showed significant decreases in body weight and fat mass compared to the pre-DM group (Figure S3C and D). The SalB group also showed decreased levels of TC, FBG, insulin, and HOMA-IR index compared to the pre-DM group (Figure S3E, G–I). Moreover, the prediabetic mice treated with SalB had smaller adipocyte sizes in EWAT (Figure S3J and K).
Discussion
Prediabetes is associated with an increased risk of T2DM, cardiovascular events, and mortality.6 Given potential reversibility, the prediabetic conditions offer opportunities for lifestyle interventions and pharmacotherapy to normalize abnormal blood sugar, thus postponing and preventing the progression to overt T2DM.28 Despite lifestyle intervention currently serving as the primary approach for prediabetes, its efficacy is notably compromised due to challenges associated with long-term adherence. Gastrointestinal symptoms and malabsorption of vitamin B12 limit the long-term use of metformin.29 The TCMs have become popular worldwide because of their prominent advantages, stable curative effects and low toxicity. Our previous research results showed TZP reduced the relative risk of IGT patients progressing to T2DM by 49.45%.9 Compared to the control group, TZP significantly reduced various indicators in IGT patients, including OGTT, 2hPG, HbA1c, weight, FINS, and HOMA-IR. And, no significant side effects were observed during the follow-up in TZP group. However, the underlying mechanisms of TZP with prediabetes remain unexplored. This study aims to elucidate the anti-prediabetic effects and potential mechanisms of TZP, thereby laying the foundation for future research and providing a basis for the development of drugs for prediabetes.
The mice induced by a HFD exhibit typical prediabetic features, including obesity, abnormal blood glucose, and insulin resistance.30 Consequently, this study selected mice fed with a HFD to establish a prediabetic model. Metformin, a recommended drug for prediabetes treatment, was chosen as a positive control medication to assess the pharmacological action.6 The experimental results demonstrated that a HFD induces prediabetes in mice, characterized by increased body weight, fat mass weight, elevated FPG, insulin, HOMA-IR, and impaired glucose tolerance. Similar to metformin, TZP alleviated the aforementioned outcomes, indicating its ameliorative effects on glucose intolerance and insulin resistance. Moreover, TZP reduced serum TC, LDL and hepatic TG levels, while increasing serum HLD in prediabetic mice, thereby improving lipid metabolism similarly to metformin. Overweight, a significant risk factor for prediabetes, can be effectively addressed through weight loss surgery to prevent the occurrence of T2DM in prediabetic and obese patients.28 In this experiment, both TZP and metformin not only exhibited weight-attenuating effects but also significantly decreased the average size of adipocytes in WAT. Adipocyte size, strongly associated with the risk of T2DM, is not only correlated with body weight.31 When WAT cannot benignly expand to store or oxidize energy, excess fat ectopically deposits in tissues regulating metabolic homeostasis such as the liver, skeletal muscle and pancreas.20 The study found that hepatic lipid deposition in prediabetic mice was reduced after intervention with TZP. Simultaneously, in terms of increasing calorie expenditure, the efficacy of TZP surpassed that of metformin. In conclusion, systemic metabolic indicators and pathological results suggest that TZP has a positive therapeutic effect on prediabetes. It offers an alternative treatment for prediabetes besides metformin.
In this study, 20 compounds in TZP were identified using UPLC-Q-TOF-MS technology. These compounds include phenolic substances such as salvianolic acid B, rosmarinic acid, mulberroside A, kuwanon G, kaempferol, puerarin, daidzin, daidzein, and 3’-methoxypuerarin. These Plant-derived polyphenols have been shown to regulate carbohydrate and lipid metabolism, alleviate hyperglycemia, dyslipidemia, and insulin resistance, improve adipose tissue metabolism, and reduce oxidative stress and inflammation, effectively treating metabolic diseases such as type 2 diabetes.32,33 Cryptotanshinone, a terpenoid, inhibited lipid accumulation by regulating adipogenesis-related genes.34 Alkaloid compounds from Rhizoma coptidis, including berberine, epiberberine, coptisine, palmatine, jatrorrhizine, and columbamine, exhibit multiple pharmacological effects such as reducing blood lipids, lowering blood glucose, improving insulin resistance, and regulating lipid metabolism.35 Emodin, aloe-emodin, rhein, and chrysophanic acid are rhubarb hydroxyanthraquinones known for their lipid-lowering activity. Recent studies have indicated that rhein regulates obesity-related adipogenesis, lipolysis, and inflammation, making it a potential anti-obesity drug.36 Modern pharmacological research on the active components of herbs has corroborated the efficacy of TZP in treating prediabetes. This combination of herbal extracts, guided by TCM theory, is believed to have synergistic interactions, enhancing therapeutic effects and reducing side effects.37 However, further research is needed to support the synergistic interactions among the components of TZP.
To further elucidate the potential mechanisms underlying the therapeutic effects of TZP in prediabetes, transcriptome sequencing was conducted on EWAT. The results indicated that in the pre-DM/Con group, 2130 and 1140 DEGs were upregulated and downregulated, respectively. TZP administration reversed 1738 genes in prediabetic mice, with 1140 genes being downregulated and 643 genes being upregulated. These findings suggested that TZP exerts a regulatory influence on the transcriptome of WAT under prediabetic conditions. TZP reversed the expression of these gene in WAT of prediabetic mice, thereby improving WAT dysfunction and enhancing its role in regulating the systematic homeostasis. Previous study has revealed that the specific knockout of Gi in adipose tissue worsened insulin resistance and disrupted glucose metabolism in HFD-fed mice, while their activation yields the opposite effect.38 The regulatory impact of TZP on the gene of WAT is a crucial mechanism that should not be overlooked. Nevertheless, more detailed research is necessary to further investigate these findings.
Further the pathway enrichment analysis indicated that TZP modulated inflammation pathways and lipid metabolism pathways in prediabetic mice. On one hand, TZP downregulated pro-inflammatory pathways, such as the Chemokine signaling pathway and Toll-like receptor signaling pathway, in prediabetic mice. Simultaneously, TZP upregulated anti-inflammatory pathways, including the AMPK signaling pathway and PPAR signaling pathway. This modulation was reflected in the downregulation of genes such as Tlr2, Ccr5, Ccl9, Itgb2, and the upregulation of inflammation-related genes like Pparg and Adipoq. Tlr2, a member of the membrane-bound Toll-like receptor (TLRs) family, acts as a pattern recognition receptor participating in the regulation of innate immune system.39 Ccr5, which can bind to pro-inflammatory chemokines, participates in the chemotaxis of macrophages. The expression of Ccr5 is increased in WAT of diet-induced obese and ob/ob mice; inhibiting its expression can reverse the suppressed expression of GLUT4 and IRS1 genes in adipose tissue under high-fat diet, thereby improving insulin resistance.40,41 Ccl9, also known as Macrophage Inflammatory Protein-1 γ (MIP1γ), is reported as a chemokine recruiting bone marrow cells. Itgb2, a member of the integrin family, is associated with various metabolic pathways and immune functions, such as leukocyte extravasation through blood vessels. ITGB2 is crucial for the development of diabetes, and the deletion of the ITGB2 gene is expected to prevent diabetes.42 Pparg can bind to NF-κB, preventing its binding to the promoter region of inflammatory factor genes, inhibiting the production of inflammatory factors (TNFα, IL-1β, IL-2, and IL-6).43
On the other hand, TZP upregulated pathways related to lipolysis (Regulation of lipolysis in adipocytes, fatty acid catabolic process) and fatty acid oxidation (fatty acid oxidation, lipid oxidation), along with genes like Lipe, Pnpla2, Cdo1, Ces1d, Echs1, Acad11, Adipor2. Pnpla2 (ATGL) and Lipe (HSL) are key enzymes in the lipolysis process, crucial for playing a crucial role in maintaining energy homeostasis and preventing obesity. Fat-specific overexpression of ATGL or enhancement of HSL activity can prevent diet-induced obesity (DIO) and improve metabolic health.44,45 Cod1, highly expressed in adipose tissue, is considered a promoter of lipolysis initiation, and its adipose tissue-specific knockout aggravated obesity and metabolic abnormalities in mice.46 Ces1d demonstrates a direct lipolytic function by mobilizing lipid droplets upon translocation onto or proximity to them, and adipose tissue-specific knockout of Ces1d in high-fat-fed mice results in severe obesity and related metabolic disorders.47 Echs1 and Acad11, located on the mitochondria, participate in fatty acid oxidation. Increasing the expression of Echs1 can reduce abdominal fat accumulation.48 Adipoq, a fat factor secreted by adipocytes binding to adiponectin receptors AdipoR1 and Adipor2, has become a potential factor against diabetes, inflammation, and atherosclerosis.49 Consistent with RNA-seq results, TZP significantly upregulated the mRNA expression of Lipe, Pnpla2, Cdo1, Ces1d, Echs1, Acad11, Adipor2, Pparg, Adipoq, and downregulated the mRNA expression of Tlr2, Ccr5, Ccl9, Itgb2 in prediabetic mice. Moreover, immunofluorescence and ELISA experiments indicated that after TZP intervention, inflammation in adipose tissue and systemic inflammation decreased in prediabetic mice, serum adiponectin expression increases, suggesting improved function in damaged adipose tissue.
The data mentioned above indicate that TZP exhibits the suppression of inflammation, enhancement of lipolysis and oxidation, thereby regulating dysfunctional adipose tissue in a high-fat diet-induced prediabetic mouse model. However, the interactions between pathways and central nodes remain unclear. Recent studies suggest that the inflammatory signaling axis can reprogram mitochondrial metabolism in adipocytes, leading to the inhibition of fatty acid oxidation and exacerbating insulin resistance. As a result, our subsequent research will aim to explore key targets of TZP in modulating the inflammation and metabolism pathways to elucidate its potential molecular mechanisms in treating prediabetes.
Conclusion
TZP has shown efficacy in managing prediabetes by inducing weight loss, lowering blood glucose levels, and improving insulin resistance, likely through the regulation of aberrant gene expression in dysfunctional adipose tissue. Notably, TZP significantly affects inflammation, lipolysis, and lipid oxidation in the adipose tissue of prediabetic mice. This study provides supportive data for the application of TZP, a clinically validated traditional Chinese medicine formula. Furthermore, the therapeutic effects of TZP in treating prediabetes are comparable to those of metformin, suggesting that TZP could serve as a treatment option.
Ethical Statement
All animal experiments were approved by the Animal Ethics Committee of the Capital Medical University (NO. AEEI-2022-022) and performed in accordance with the Guide for the Care and Use of Laboratory Animals of the Beijing Municipal Government.
Acknowledgments
The authors gratefully acknowledge the financial support from National Key R&D Program of China (No. 2018YFC1704102) and National Natural Science Foundation of China (No. 81302950).
Disclosure
The authors declare that they have no known competing financial interests or personal relationships that could have appeared to influence the work reported in this paper.
References
1. Echouffo-Tcheugui JB, Selvin E. Prediabetes and what it means: the epidemiological evidence. Annu Rev Publ Health. 2021;42(1):59–77. doi:10.1146/annurevpublhealth-090419-102644
2. Centers for Disease Control and Prevention. National Diabetes Statistics Report website. https://www.cdc.gov/diabetes/data/statistics-report/index.html.
3. Sun H, Saeedi P, Karuranga S, et al. IDF Diabetes Atlas: global, regional and country-level diabetes prevalence estimates for 2021 and projections for 2045. Diabetes Res Clin Pract. 2022;183:109119. doi:10.1016/j.diabres.2021.109119
4. Liu C, Foti K, Grams ME, Shin JI, Selvin E. Trends in self-reported prediabetes and metformin use in the USA: NHANES 2005–2014. J Gen Intern Med. 2020;35(1):95–101. doi:10.1007/s11606-019-05398-5
5. Andes LJ, Cheng YJ, Rolka DB, Gregg EW, Imperatore G. Prevalence of prediabetes among adolescents and young adults in the United States, 2005–2016. JAMA Pediatr. 2020;174(2):e194498. doi:10.1001/jamapediatrics.2019.4498
6. Echouffo-Tcheugui JB, Perreault L, Ji L, Dagogo-Jack S. Diagnosis and management of prediabetes: a review. JAMA. 2023;329(14):1206–1216. doi:10.1001/jama.2023.4063
7. Tian J, Jin D, Bao Q, et al. Evidence and potential mechanisms of traditional Chinese medicine for the treatment of type 2 diabetes: a systematic review and meta-analysis. Diabetes Obe Metab. 2019;21(8):1801–1816. doi:10.1111/dom.13760
8. Chen LY, Zhou H, Gao YB. Traditional Chinese medicine syndrome differentiation of impaired glucose tolerance reduction. Chin J Basic Med Traditional Chin Med. 2007;13(3):223–224. doi:10.3969/j.issn.1006-3250.2007.03.026
9. Gao YB, Zhou H, Zhao H, et al. Clinical research of traditional Chinese medical intervention on impaired glucose tolerance. Am J Chin Med. 2013;41(1):21–32. doi:10.1142/S0192415X1350002X
10. Zhu ZY, Gao YB, Liu J, et al. Impacts of Tangzhiping on glucose and insulin metabolism in the rats of insulin resistance. World J Integr Trad Western Med. 2015;4(12):1516–1518. doi:10.13935/j.cnki.sjzx.151111
11. Gong X, Ji MY, Xu JP, Zhang CH, Li MH. Hypoglycemic effects of bioactive ingredients from medicine food homology and medicinal health food species used in China. Crit Rev Food Sci. 2020;60(14):2303–2326. doi:10.1080/10408398.2019.1634517
12. Wang HN, Xiang JZ, Qi Z, Du M. Plant extracts in prevention of obesity. Crit Rev Food Sci. 2022;62(8):2221–2234. doi:10.1080/10408398.2020.1852171
13. Li L, Li R, Zhu RY, et al. Salvianolic acid B prevents body weight gain and regulates gut microbiota and LPS/TLR4 signaling pathway in high-fat diet-induced obese mice. Food Funct. 2020;11(10):8743–8756. doi:10.1039/D0FO01116A
14. Raoufi S, Baluchnejadmojarad T, Roghani M, Ghazanfari T, Khojasteh F, Mansouri M. Antidiabetic potential of salvianolic acid B in multiple low-dose streptozotocin-induced diabetes. Pharm Biol. 2015;53(12):1803–1809. doi:10.3109/13880209.2015.1008148
15. Li D, Yang C, Zhu JZ, et al. Berberine remodels adipose tissue to attenuate metabolic disorders by activating sirtuin 3. Acta Pharmacol Sin. 2022;43(5):1285–1298. doi:10.1038/s41401-021-00736-y
16. Yang Y, Chen ZT, Zhao XY, et al. Mechanisms of Kaempferol in the treatment of diabetes: a comprehensive and latest review. Front Endocrinol. 2022;13:990299. doi:10.3389/fendo.2022.990299
17. Roden M, Shulman GI. The integrative biology of type 2 diabetes. Nature. 2019;576(7785):51–60. doi:10.1038/s41586-019-1797-8
18. Miao Z, Alvarez M, Ko A, et al. The causal effect of obesity on prediabetes and insulin resistance reveals the important role of adipose tissue in insulin resistance. PLoS Genet. 2020;16(9):e1009018. doi:10.1371/journal.pgen.1009018
19. Morigny P, Boucher J, Arner P, Langin D. Lipid and glucose metabolism in white adipocytes: pathways, dysfunction and therapeutics. Nat Rev Endocrinol. 2021;17(5):276–295. doi:10.1038/s41574-021-00471-8
20. Kusminski CM, Bickel PE, Scherer PE. Targeting adipose tissue in the treatment of obesity-associated diabetes. Nat Rev Drug Discov. 2016;15(9):639–660. doi:10.1038/nrd.2016.75
21. Roumans KHM, Lindeboom L, Veeraiah P, et al. Hepatic saturated fatty acid fraction is associated with de novo lipogenesis and hepatic insulin resistance. Nat Commun. 2020;511(1):1891. doi:10.1038/s41467-020-15684-0
22. Singh RG, Yoon HD, Wu LM, Lu J, Plank LD, Petrov MS. Ectopic fat accumulation in the pancreas and its clinical relevance: a systematic review, meta-analysis, and meta regression. Metabolism. 2017;69:1–13. doi:10.1016/j.metabol.2016.12.012
23. Longo M, Zatterale F, Naderi J, et al. Adipose tissue dysfunction as determinant of obesity-associated metabolic complications. Int J Mol Sci. 2019;20(9):2358. doi:10.3390/ijms20092358
24. Wu H, Ballantyne CM. Metabolic inflammation and insulin resistance in obesity. Circ Res. 2020;126(11):1549–1564. doi:10.1161/CIRCRESAHA.119.315896
25. Wu F, Shao Q, Xia Q, et al. A bioinformatics and Transcriptomics based investigation reveals an inhibitory role of Huanglian-Renshen-Decoction on hepatic glucose production of T2DM mice via PI3K/Akt/FoxO1 signaling pathway. Phytomedicine. 2021;83:153487. doi:10.1016/j.phymed.2021.153487
26. Ma QL, Deng P, Lin M, et al. Long-term bisphenol A exposure exacerbates diet-induced prediabetes via TLR4-dependent hypothalamic inflammation. J Hazard Mater. 2021;402:123926. doi:10.1016/j.jhazmat.2020.123926
27. O’Brien PD, Guo K, Eid SA, et al. Integrated lipidomic and transcriptomic analyses identify altered nerve triglycerides in mouse models of prediabetes and type 2 diabetes. Dis Model Mech. 2020;13(2):dmm042101. doi:10.1242/dmm.042101
28. Rendell M. Pharmacotherapeutic options for prediabetes. Expert Opin Pharmaco. 2021;22(1):45–54. doi:10.1080/14656566.2020.1817381
29. ElSayed NA, Aleppo G, Aroda VR, et al. 3. Prevention or delay of type 2 diabetes and associated comorbidities: standards of care in diabetes-2023. Diabetes Care. 2023;46:S41–S48. doi:10.2337/dc22-S003
30. SinhaR, Ngo MD, Bartlett S, et al. Pre-Diabetes Increases Tuberculosis Disease Severity, While High Body Fat Without Impaired Glucose Tolerance Is Protective. Front Cell Infect Microbiol. 2021; 11; 691823. doi:10.3389/fcimb.2021.691823
31. Stenkula KG, Erlanson-Albertsson C. Adipose cell size: importance in health and disease. Am J Physiol-Reg I. 2018;315(2):R284–R295. doi:10.1152/ajpregu.00257.2017
32. Lin D, Xiao MS, Zhao J, et al. An overview of plant phenolic compounds and their importance in human nutrition and management of type 2 diabetes. Molecules. 2016;21(10):1374. doi:10.3390/molecules21101374
33. Rodriguez-Perez C, Segura-Carretero A, Del Mar Contreras M. Phenolic compounds as natural and multifunctional anti-obesity agents: a review. Crit Rev Food Sci. 2019;59(8):1212–1229. doi:10.1080/10408398.2017.1399859
34. Rahman N, Jeon M, Song HY, Kim YS. Cryptotanshinone, a compound of Salvia miltiorrhiza inhibits pre-adipocytes differentiation by regulation of adipogenesis-related genes expression via STAT3 signaling. Phytomedicine. 2016;23(1):58–67. doi:10.1016/j.phymed.2015.12.004
35. Wang J, Wang L, Lou GH, et al. Coptidis Rhizoma: a comprehensive review of its traditional uses, botany, phytochemistry, pharmacology and toxicology. Pharm Biol. 2019;57(1):193–225. doi:10.1080/13880209.2019.1577466
36. Fang JY, Huang TH, Chen WJ, Aljuffali IA, Hsu CY. Rhubarb hydroxyanthraquinones act as antiobesity agents to inhibit adipogenesis and enhance lipolysis. Biomed Pharmacother. 2022;146:112497. doi:10.1016/j.biopha.2021.112497
37. Wagner H, Ulrich-Merzenich G. Synergy research: approaching a new generation of phytopharmaceuticals. Phytomedicine. 2009;16(2–3):97–110. doi:10.1016/j.phymed.2008.12.018
38. Wang L, Pydi SP, Zhu L, et al. Adipocyte G(i) signaling is essential for maintaining whole-body glucose homeostasis and insulin sensitivity. Nat Commun. 2020;11(1):2995. doi:10.1038/s41467-020-16756-x
39. Davis JE, Braucher DR, Walker-Daniels J, Spurlock ME. Absence of Tlr2 protects against high-fat diet-induced inflammation and results in greater insulin-stimulated glucose transport in cultured adipocytes. J Nutr Biochem. 2011;22(2):136–141. doi:10.1016/j.jnutbio.2009.12.008
40. Chan PC, Liao MT, Lu CH, Tian YF, Hsieh PS. Targeting inhibition of CCR5 on improving obesity-associated insulin resistance and impairment of pancreatic insulin secretion in high fat-fed rodent models. Eur J Pharmacol. 2021;891:173703. doi:10.1016/j.ejphar.2020.173703
41. Kitade H, Sawamoto K, Nagashimada M, et al. CCR5 plays a critical role in obesity-induced adipose tissue inflammation and insulin resistance by regulating both macrophage recruitment and M1/M2 status. Diabetes. 2012;61(7):1680–1690. doi:10.2337/db11-1506
42. Xu MM, Zhou H, Hu P, et al. Identification and validation of immune and oxidative stress-related diagnostic markers for diabetic nephropathy by WGCNA and machine learning. Front Immunol. 2023;14:1084531. doi:10.3389/fimmu.2023.1084531
43. Del Cornò M, Varano B, Scazzocchio B, Filesi C, Masella R, Gessani S. Protocatechuic acid inhibits human dendritic cell functional activation: role of PPARγ up-modulation. Immunobiology. 2014;219(6):416–424. doi:10.1016/j.imbio.2014.01.007
44. Kim K, Kang JK, Jung YH, et al. Adipocyte PHLPP2 inhibition prevents obesity-induced fatty liver. Nat Commun. 2021;12(1):1822. doi:10.1038/s41467-021-22106-2
45. Ahmadian M, Duncan RE, Varady KA, et al. Adipose overexpression of desnutrin promotes fatty acid use and attenuates diet-induced obesity. Diabetes. 2009;58(4):855–866. doi:10.2337/db08-1644
46. Guo YY, Li BY, Xiao G, Liu Y, Guo L, Tang QQ. Cdo1 promotes PPARgamma-mediated adipose tissue lipolysis in male mice. Nat Metab. 2022;4(10):1352–1368. doi:10.1038/s42255-022-00644-3
47. Li G, Li X, Yang L, et al. Adipose tissue-specific ablation of Ces1d causes metabolic dysregulation in mice. Life Sci Alliance. 2022;5(8). doi:10.26508/lsa.202101209
48. Fan C, Hu HT, Huang XY, et al. Betaine supplementation causes an increase in fatty acid oxidation and carbohydrate metabolism in livers of mice fed a high-fat diet: a proteomic analysis. Foods. 2022;11(6):881. doi:10.3390/foods11060881
49. Pandey GK, Vadivel S, Raghavan S, Mohan V, Balasubramanyam M, Gokulakrishnan K. High molecular weight adiponectin reduces glucolipotoxicity-induced inflammation and improves lipid metabolism and insulin sensitivity via APPL1-AMPK-GLUT4 regulation in 3T3-L1 adipocytes. Atherosclerosis. 2019;288:67–75. doi:10.1016/j.atherosclerosis.2019.07.011
 © 2024 The Author(s). This work is published and licensed by Dove Medical Press Limited. The
full terms of this license are available at https://www.dovepress.com/terms.php
and incorporate the Creative Commons Attribution
- Non Commercial (unported, v3.0) License.
By accessing the work you hereby accept the Terms. Non-commercial uses of the work are permitted
without any further permission from Dove Medical Press Limited, provided the work is properly
attributed. For permission for commercial use of this work, please see paragraphs 4.2 and 5 of our Terms.
© 2024 The Author(s). This work is published and licensed by Dove Medical Press Limited. The
full terms of this license are available at https://www.dovepress.com/terms.php
and incorporate the Creative Commons Attribution
- Non Commercial (unported, v3.0) License.
By accessing the work you hereby accept the Terms. Non-commercial uses of the work are permitted
without any further permission from Dove Medical Press Limited, provided the work is properly
attributed. For permission for commercial use of this work, please see paragraphs 4.2 and 5 of our Terms.